0121
Ultrashort Echo Time Single Point Dixon Using 3D Phase Modeling1Department of Radiology, University of California San Diego, La Jolla, CA, United States, 2GE Healthcare, La Jolla, CA, United States
Synopsis
Keywords: Fat, MSK
Fat signals can obscure morphological structures and influence quantitative parameter mapping in ultrashort echo time (UTE) musculoskeletal MRI. However, conventional fat suppression methods have challenges in UTE imaging of short T2 species. For example, the chemical-shift based fat saturation can significantly attenuate short T2 signals with broad spectra, and water excitation with long composite pulses may yield a long minimum echo time (TE). Alternatively, the feasibility of single-point Dixon (1p-Dixon) has been demonstrated for UTE imaging. In this study, we investigate the feasibility of 1p-Dixon based on the 3D phase modeling approach, which achieves fat suppression without additional data acquisition.Introduction
Strong signal from fat is one of the major confounding factors obscuring morphological structures and complicating quantitative parameter mapping in musculoskeletal (MSK) MRI1. Many fat suppression techniques have been developed for clinical MRI, including fat-saturation2-6, inversion recovery-based methods3, m-point Dixon4,5, and water excitation6. Recently, ultrashort echo time (UTE) imaging has been extensively investigated for MSK imaging. However, conventional fat suppression methods have challenges in UTE imaging of short T2 species7,8. The m-point Dixon is one of the feasible techniques for fat suppression in UTE imaging. However, multiple images are required to model the fat and water signal, which imposes a longer scan time. Recently, the feasibility of single-point Dixon (1p-Dixon) in UTE-MSK imaging has been demonstrated8,9. The previously proposed 1p-Dixon UTE imaging requires additional image acquisition to compensate for B1 and B0 inhomogeneity8 or a complicated process with manual parameter tuning10. In this study, we present a simple but robust approach to achieve 1p-Dixon using 3D phase modeling.Methods
1p-Dixon decomposes the water signal from the fat signal using the measured complex MRI signal, $$$S_{exp}$$$ that can be modeled as:$$S_{exp} = (W + Fe^{i\theta(t)})e^{i\phi}\qquad(1)$$
where t is the time delay in free induction decay, W and F are the magnitudes of the water and fat signals, $$$\theta$$$ denotes the phase evolution due to chemical shift of fat, and $$$\phi$$$ denotes additional phase error due to B1 and B0 field inhomogeneity. If the phase error, $$$\phi$$$, is removed, the complex signal can be directly decomposed to W and F based on the fat signal model:
$$\frac{Im(s)}{sin(\theta(t))}\qquad(2)$$
$$W=Re(S)-Fcos(\theta(t))\qquad(3)$$
where Im and Re are the operators to take imaginary and real parts in the complex signal. $$$\phi$$$ is slowly varying in space and can be shown to roughly resemble a low-order polynomial from Maxwell’s equation. In the proposed approach, the phase map was first unwrapped and then fitted to a 3D phase model based on the 4th-order polynomials represented in Equation 4:
$$ \phi(x,y,z)= \sum_{k=0}^{3}\sum_{j=0}^{3-k}\sum_{i=0}^{3-j-k}C_{ijk}x^iy^jz^k + \sum_{n=0} C_{n4}x^iy^{4-i}\qquad (4)$$
$$C =argmin_c(\sum_{i,j,k=1}^{n}(<S_{exp} - \phi(C,x_i,y_j,z_k))^2)\qquad(5)$$
where C represents all coefficients to be minimized. The baseline phase for water and $$$\theta$$$ for fat were approximated from the distribution of the corrected phase after removing $$$\phi$$$. The outliers with phase values two standard deviations away from the mean were cropped. Then, the refined phase values were shifted to ensure all values are positive, and the maximum phase was taken as $$$\theta$$$.
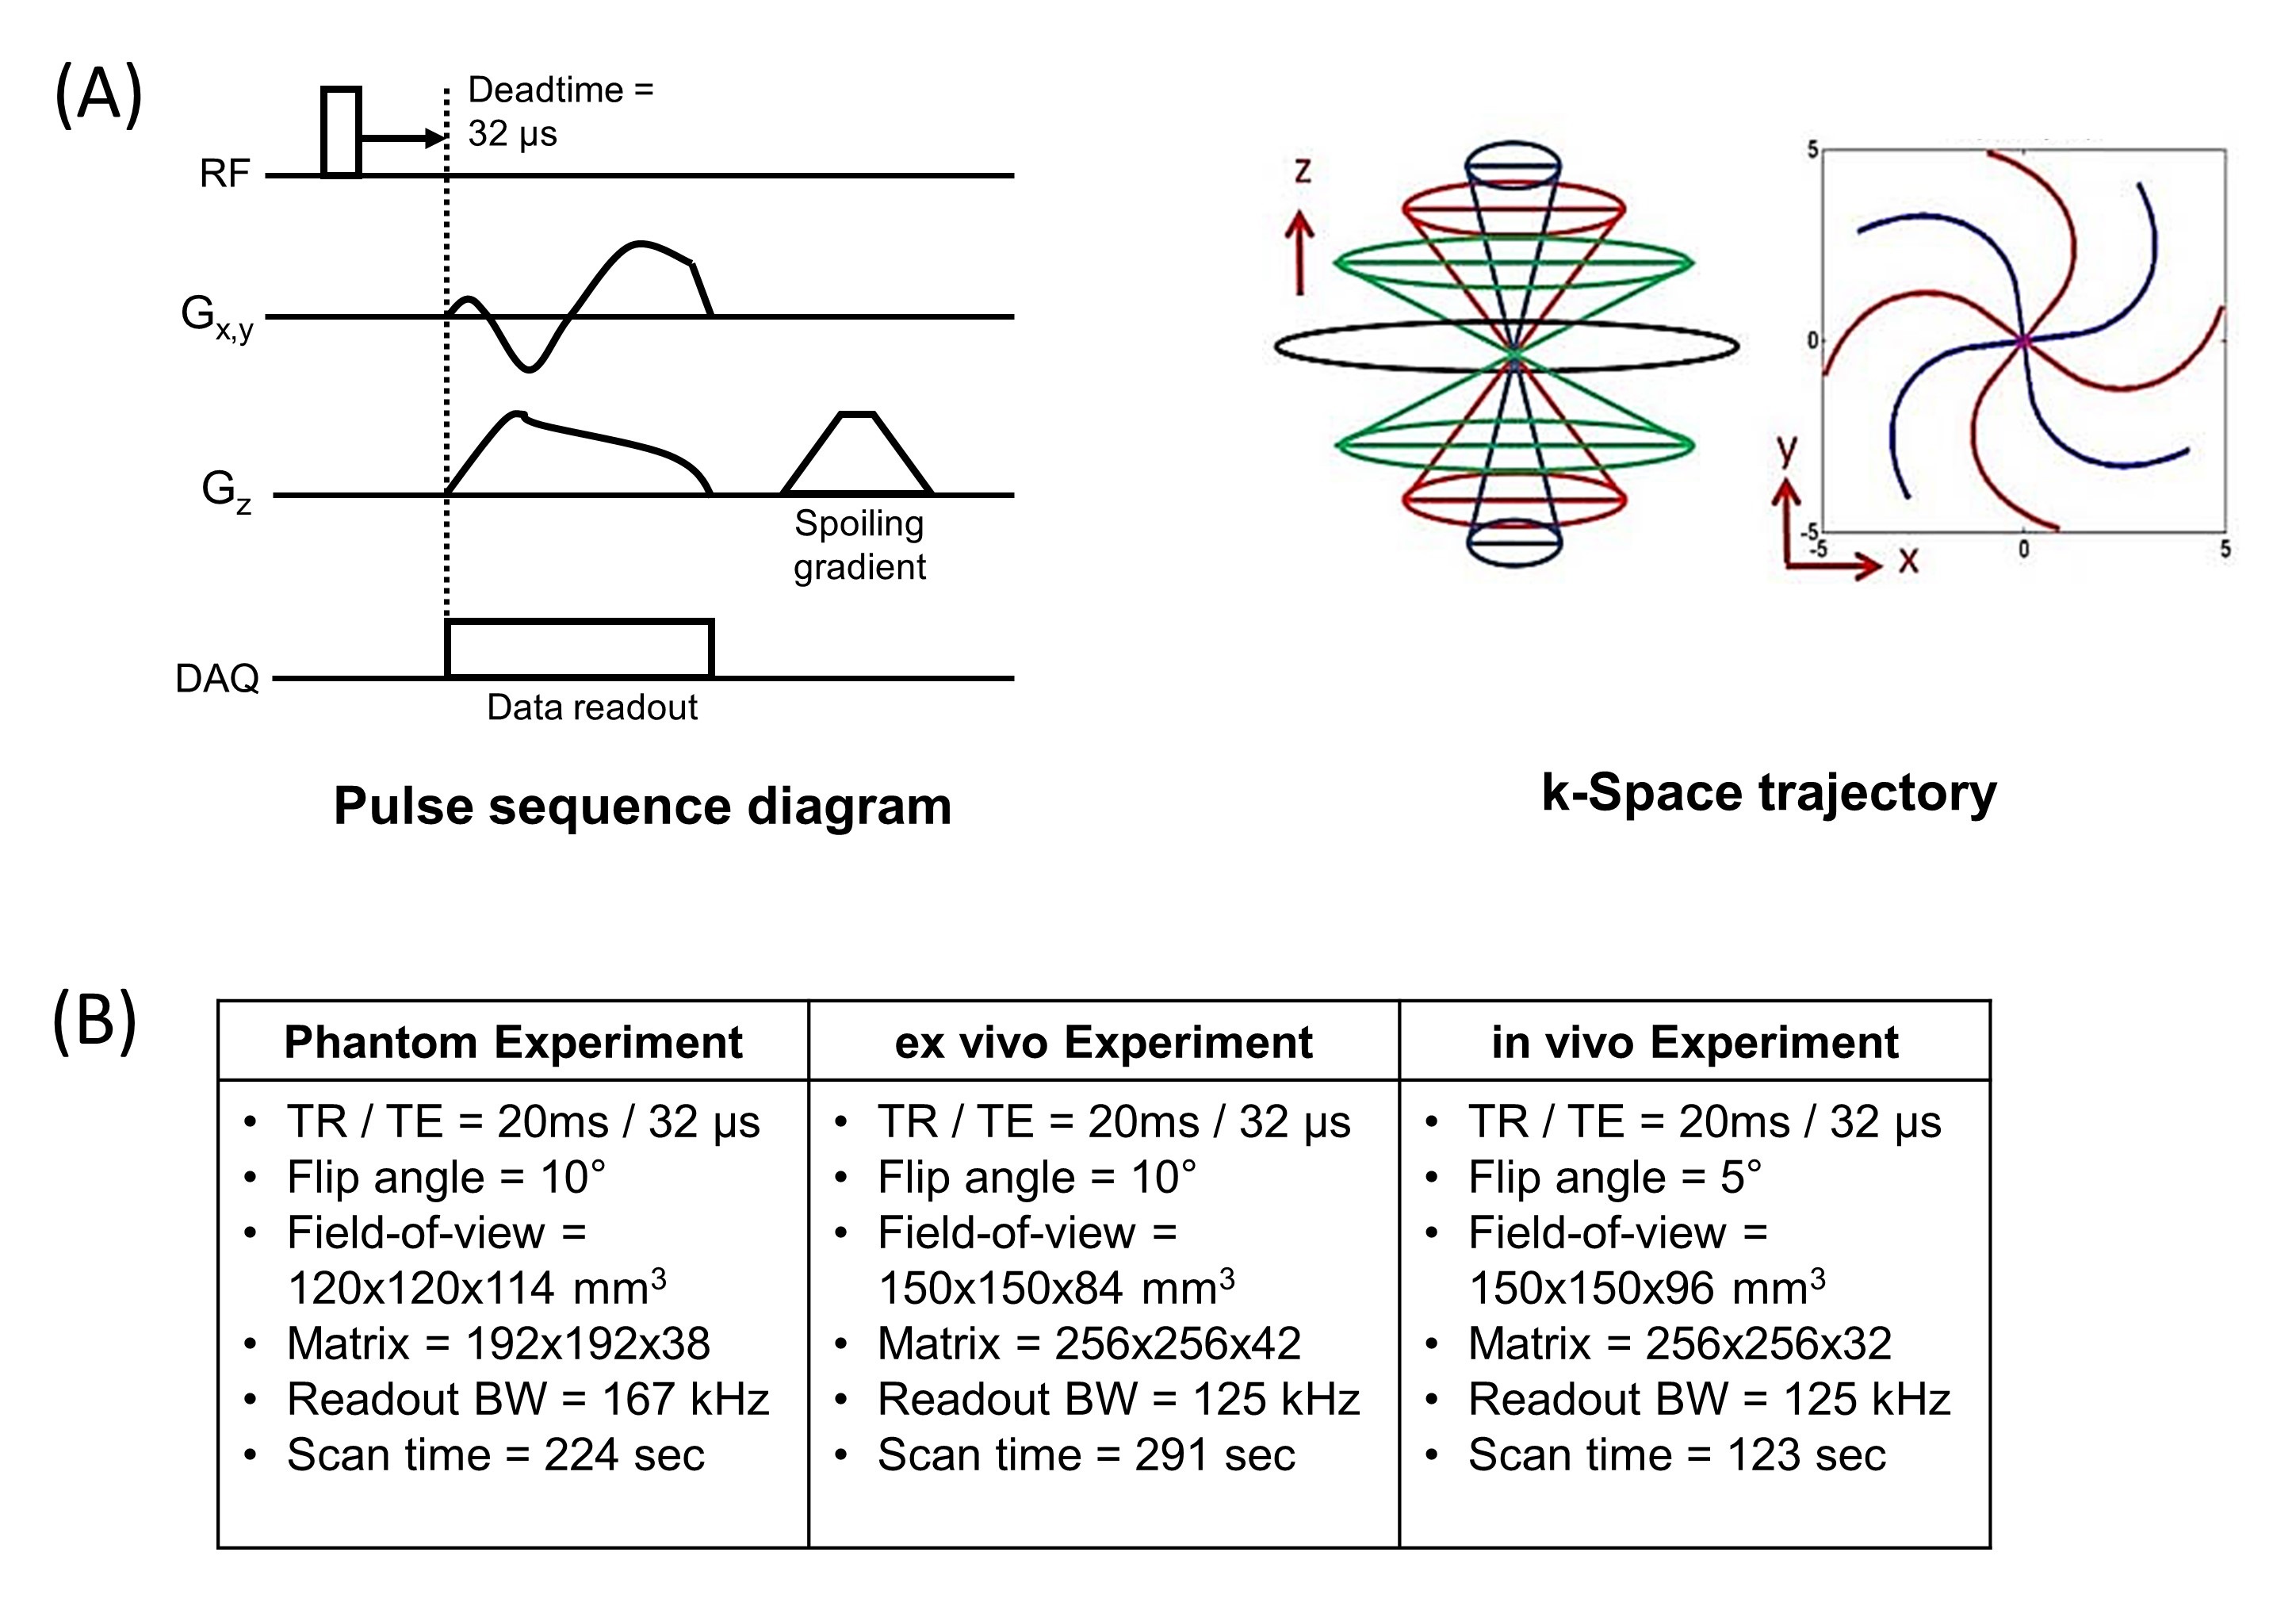
To validate the proposed approach, MRI experiments were conducted using a 3D UTE-Cones sequence implemented in a 3T clinical MRI scanner (MR750, GE Healthcare) as shown in Figure 1A. An experiment was performed with a phantom comprised of two sets of tubes made of lard and peanut oil respectively, where each set included six tubes with different fat fractions (0%, 10%, 20%, 40%, 60%, and 100%). An ex vivo experiment was conducted with four cadaveric knee joints. Finally, an in vivo experiment was conducted with two healthy volunteers. The detailed imaging parameters are shown in Figure 1B.
All data processing was performed in Matlab. The raw data from individual coils were reconstructed using the NuFFT11 and were combined into one complex image inputted to the proposed 1p-Dixon pipeline. The least squares minimization shown in Equation 5 was solved using the Levenberg–Marquardt algorithm.
Results
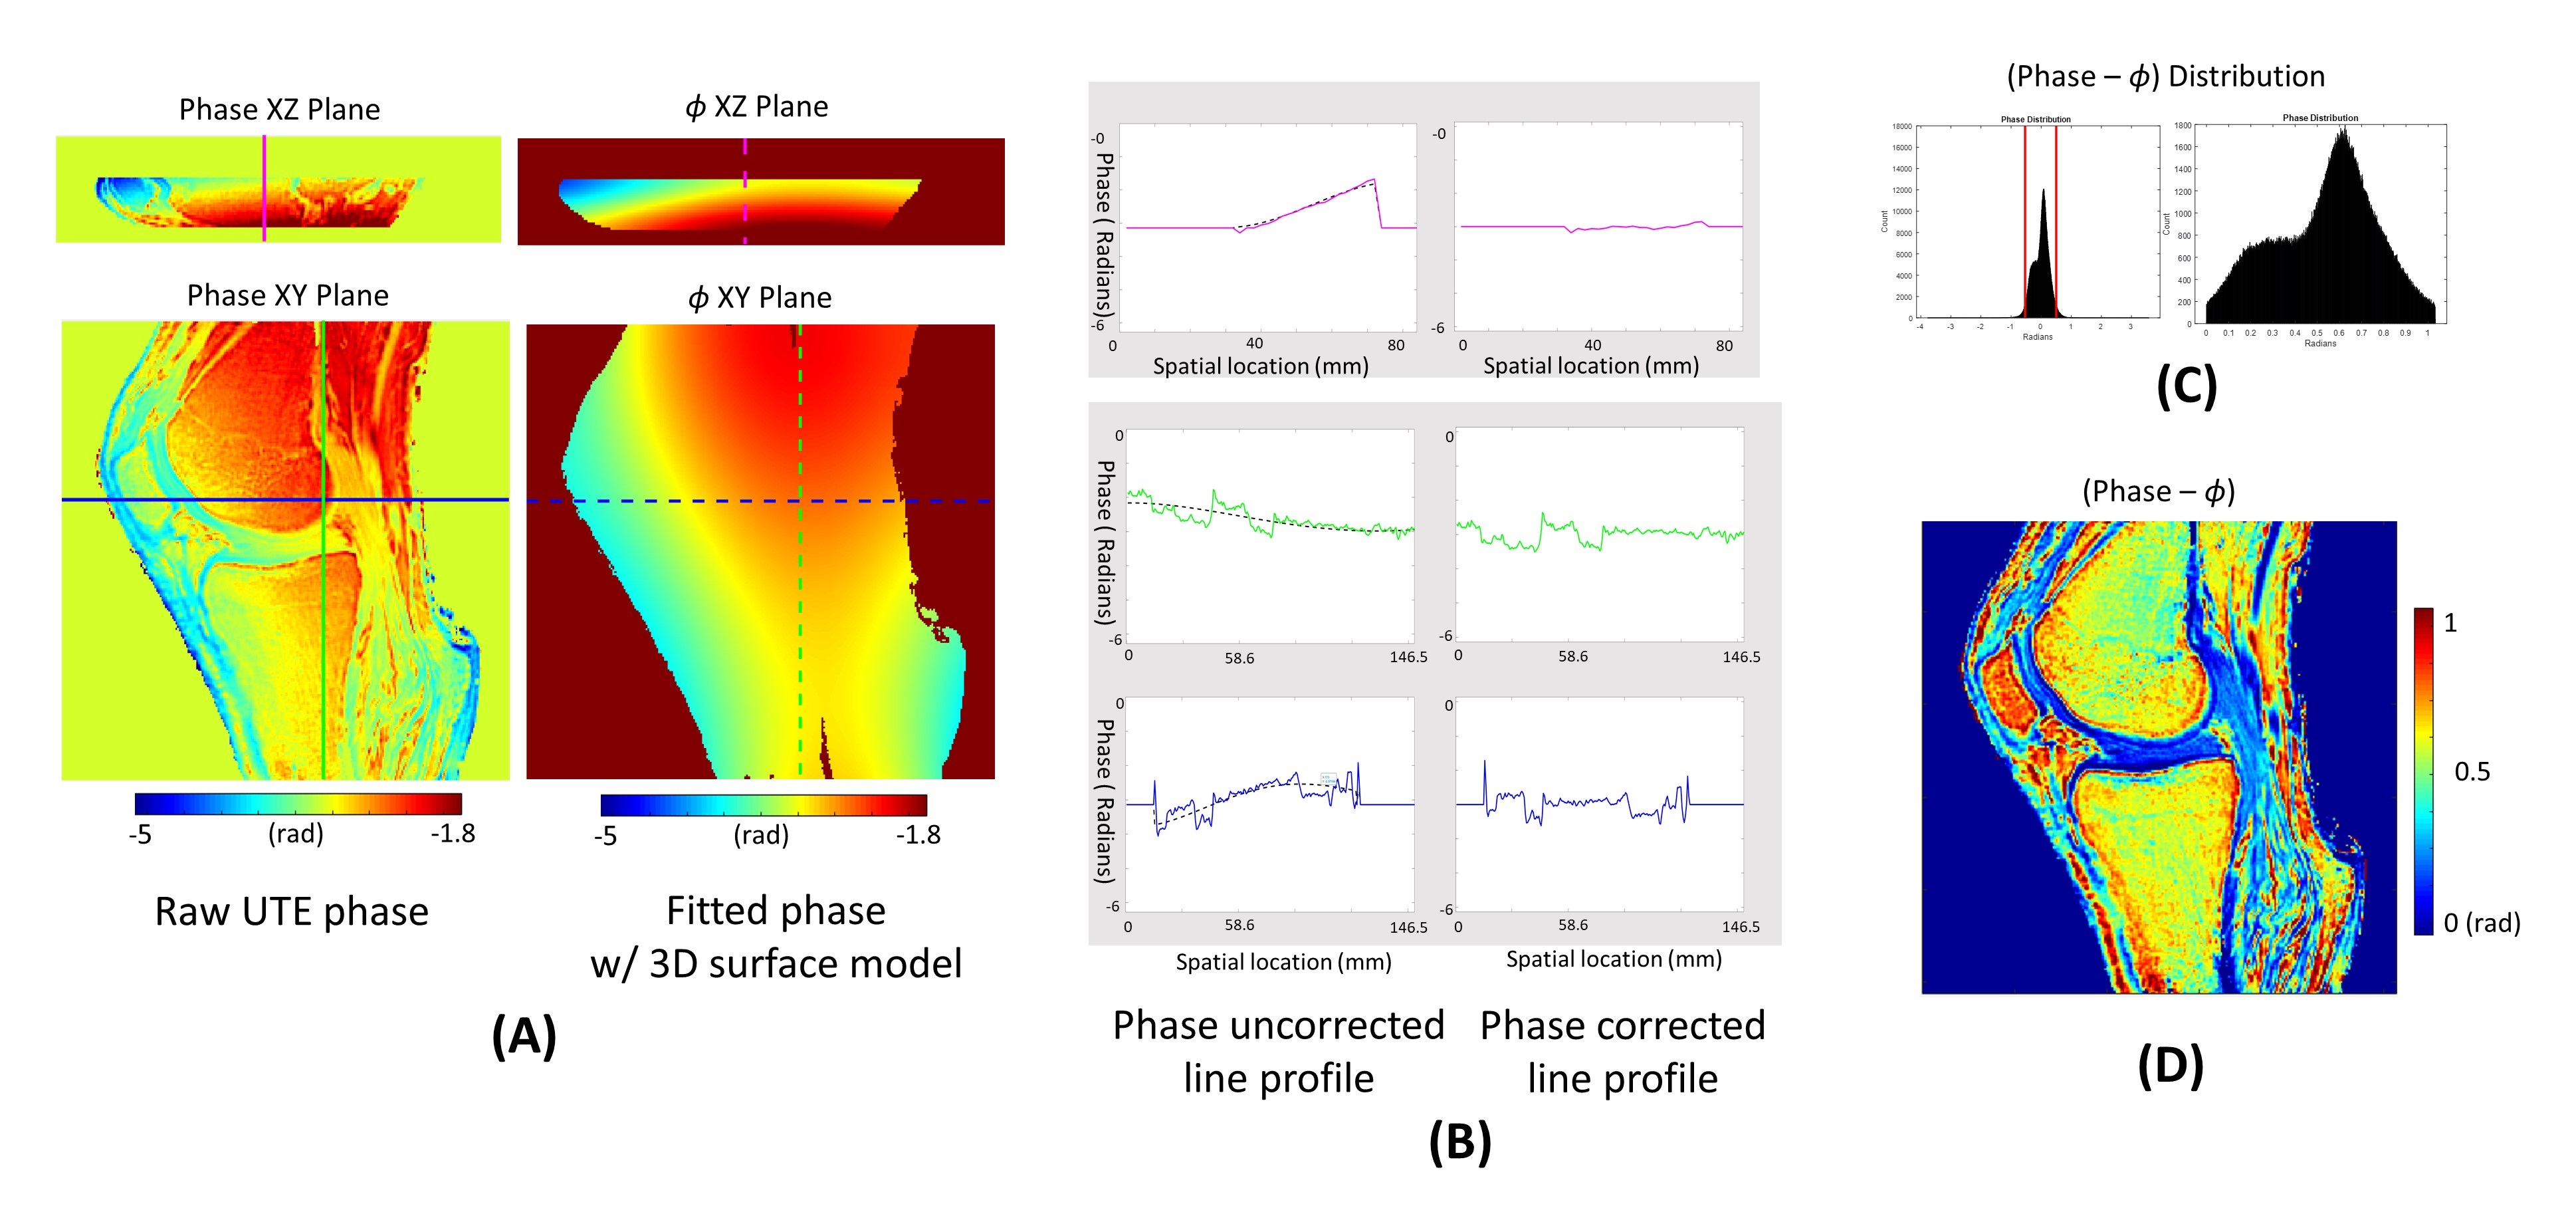
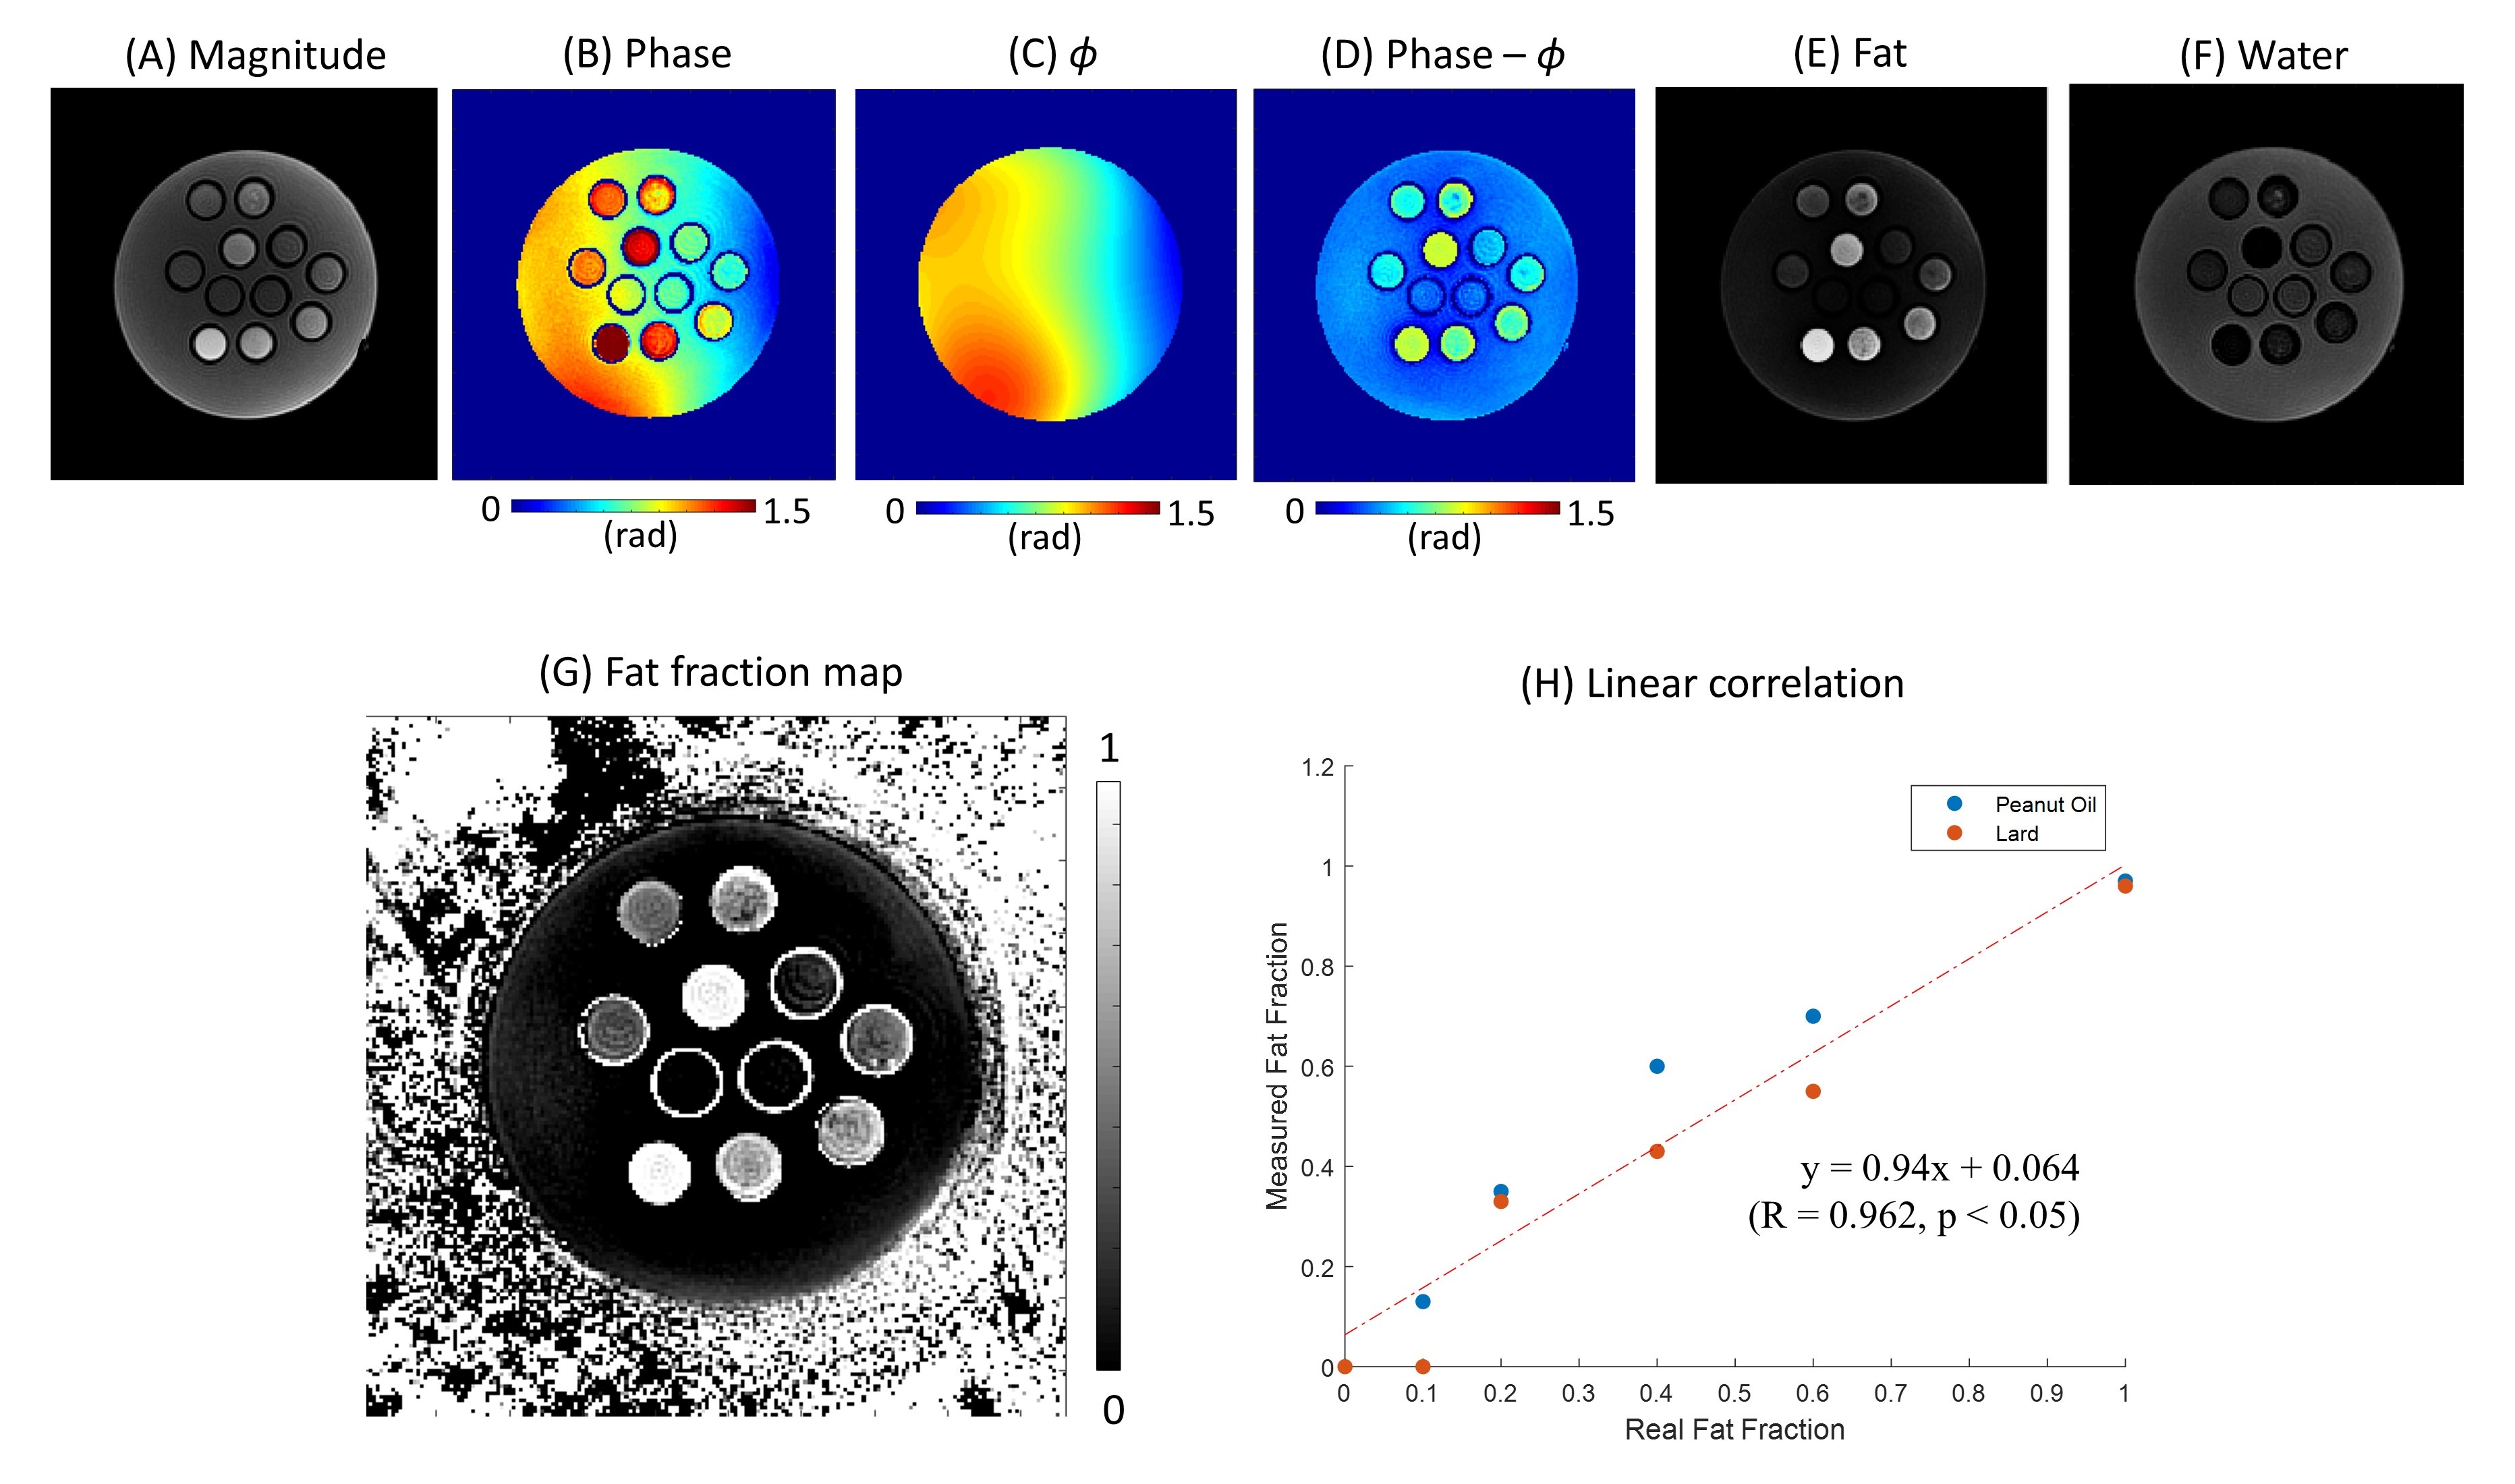
Figure 2 shows an example demonstrating the fitted 3D phase model of $$$\phi$$$ and the line profile, as well as the resultant $$$\phi$$$-corrected phase image. The smoothly varying phase error was dramatically suppressed in Figure 2D by using the proposed phase modeling approach, as also shown with the line profiles in Figure 2B.Figure 3 shows the results from the phantom experiment. After correction of $$$\phi$$$, 1p-Dixon yielded reliable fat and water separation. The estimated fat fraction showed high linearity with respect to the actual fat fraction (Figure 3H), with Pearson’s correlation (R) > 0.96 and p-value < 0.05.
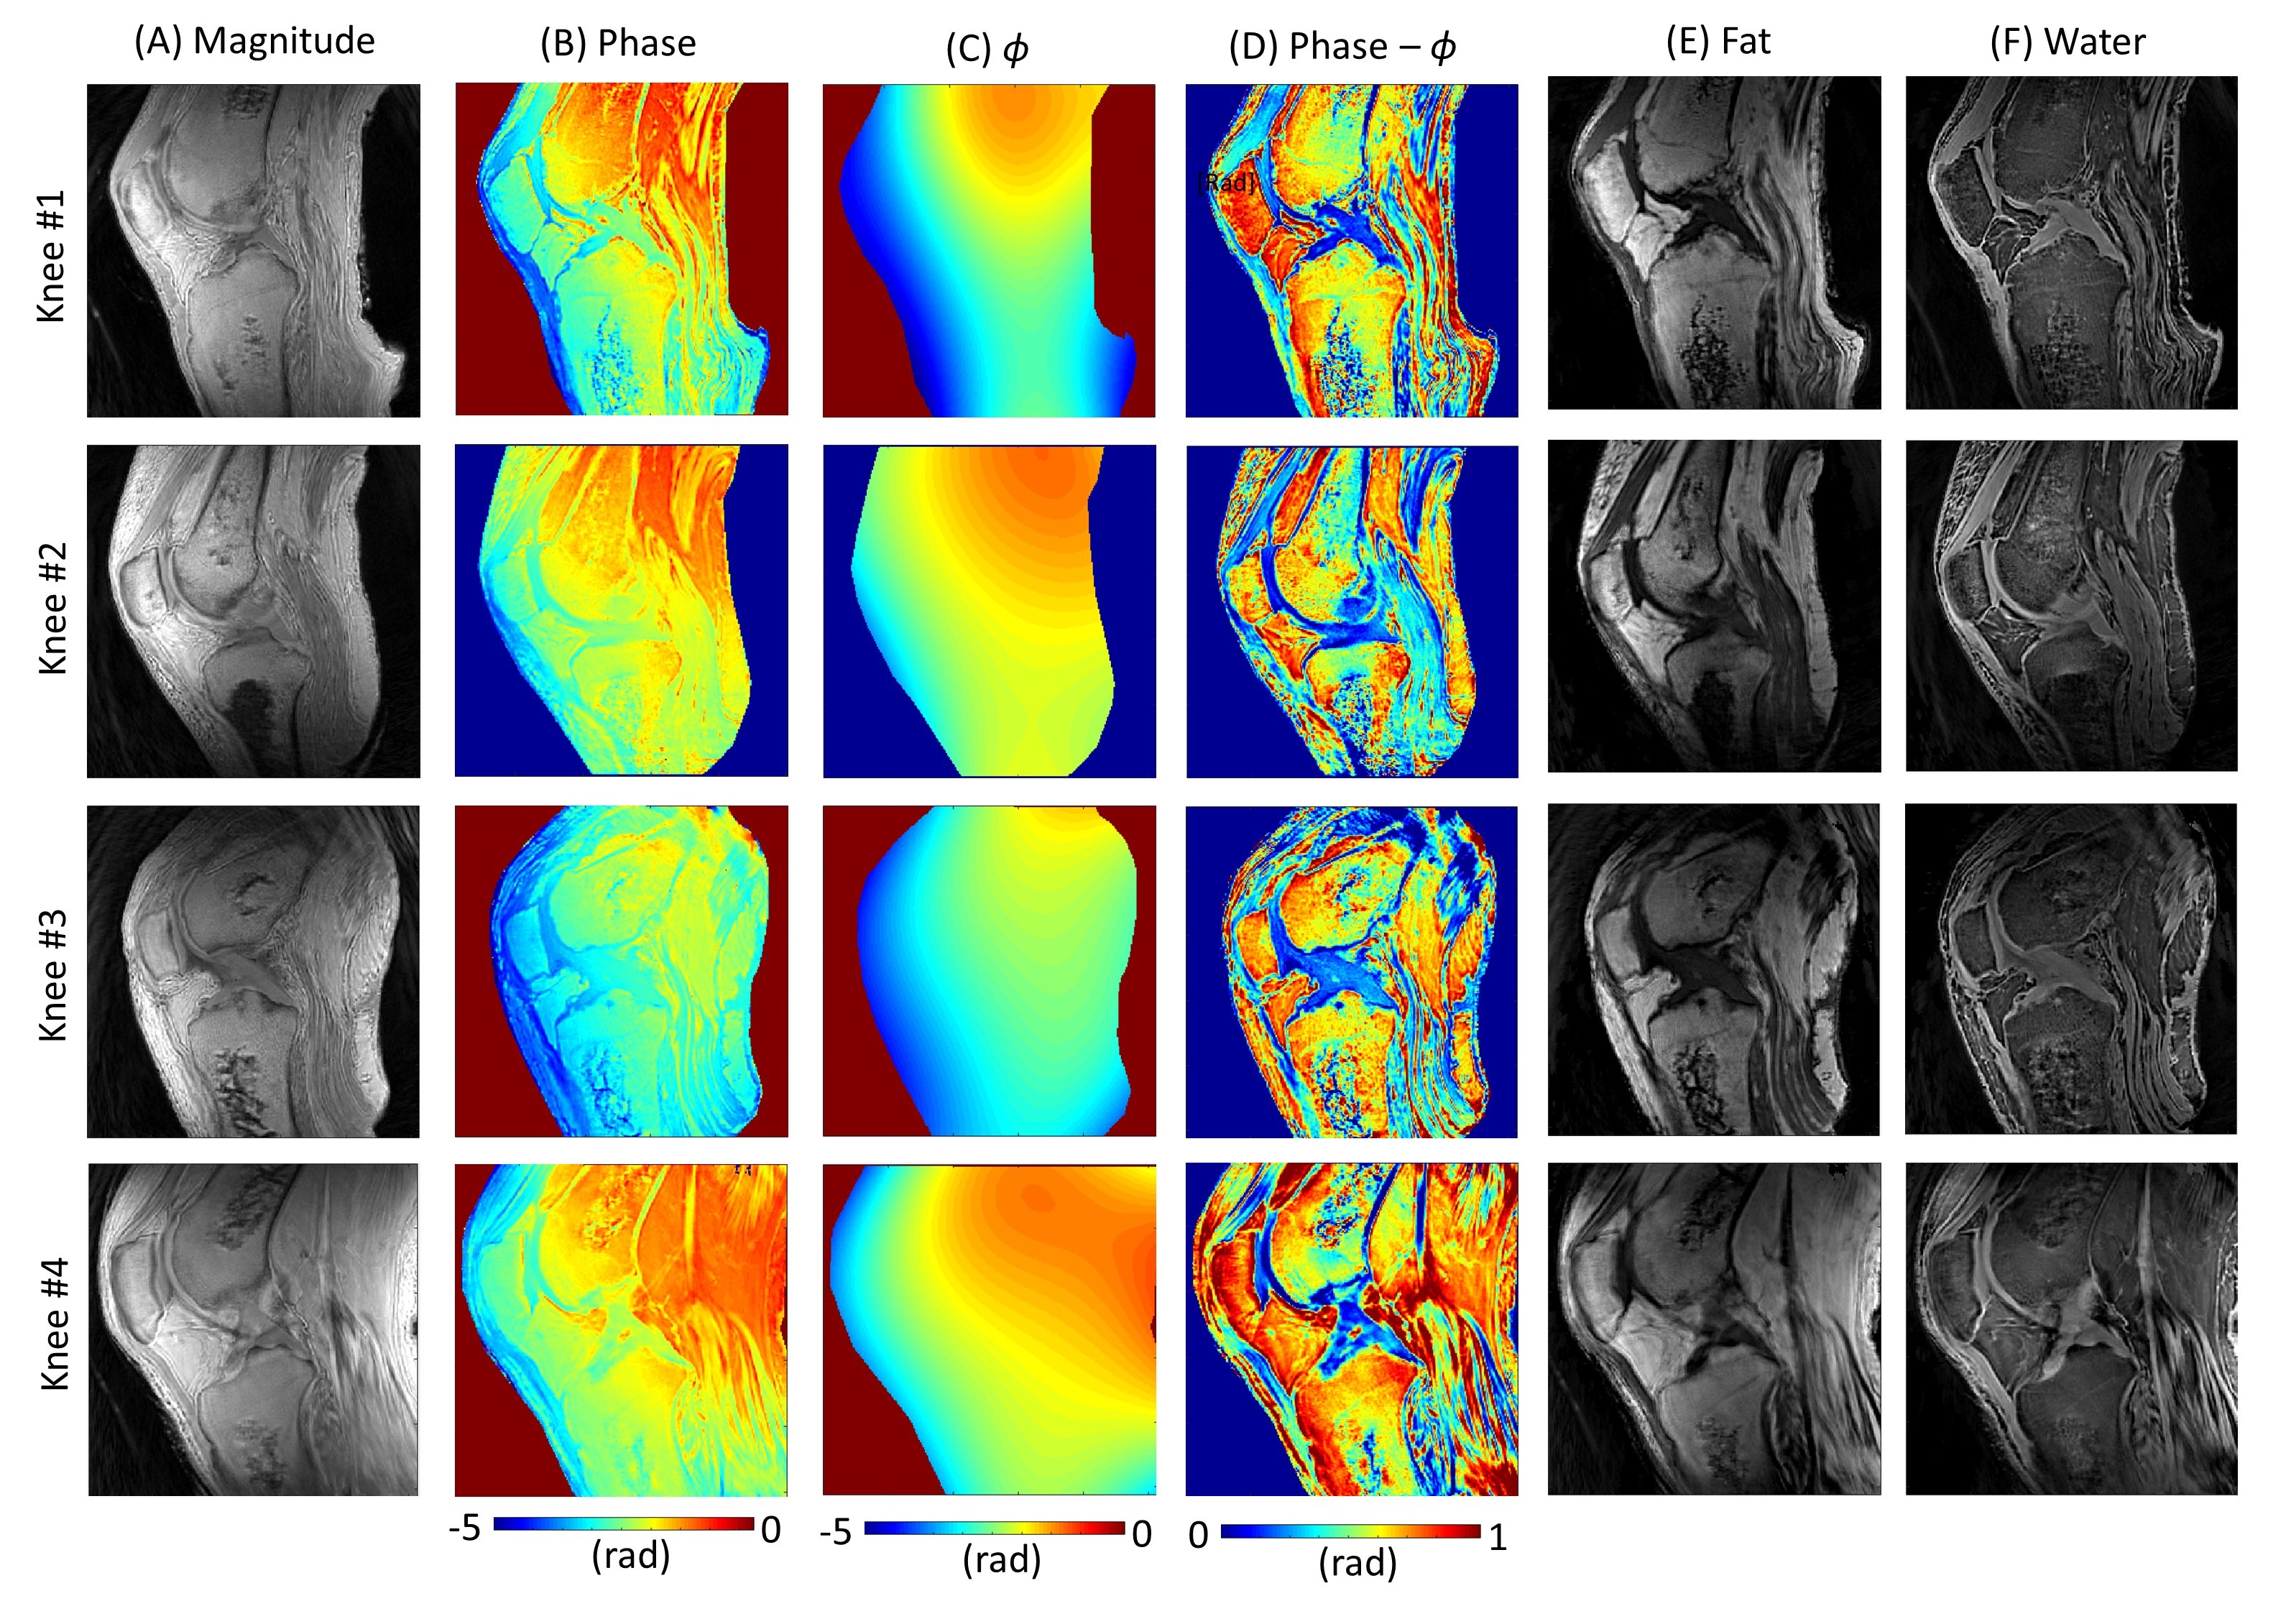
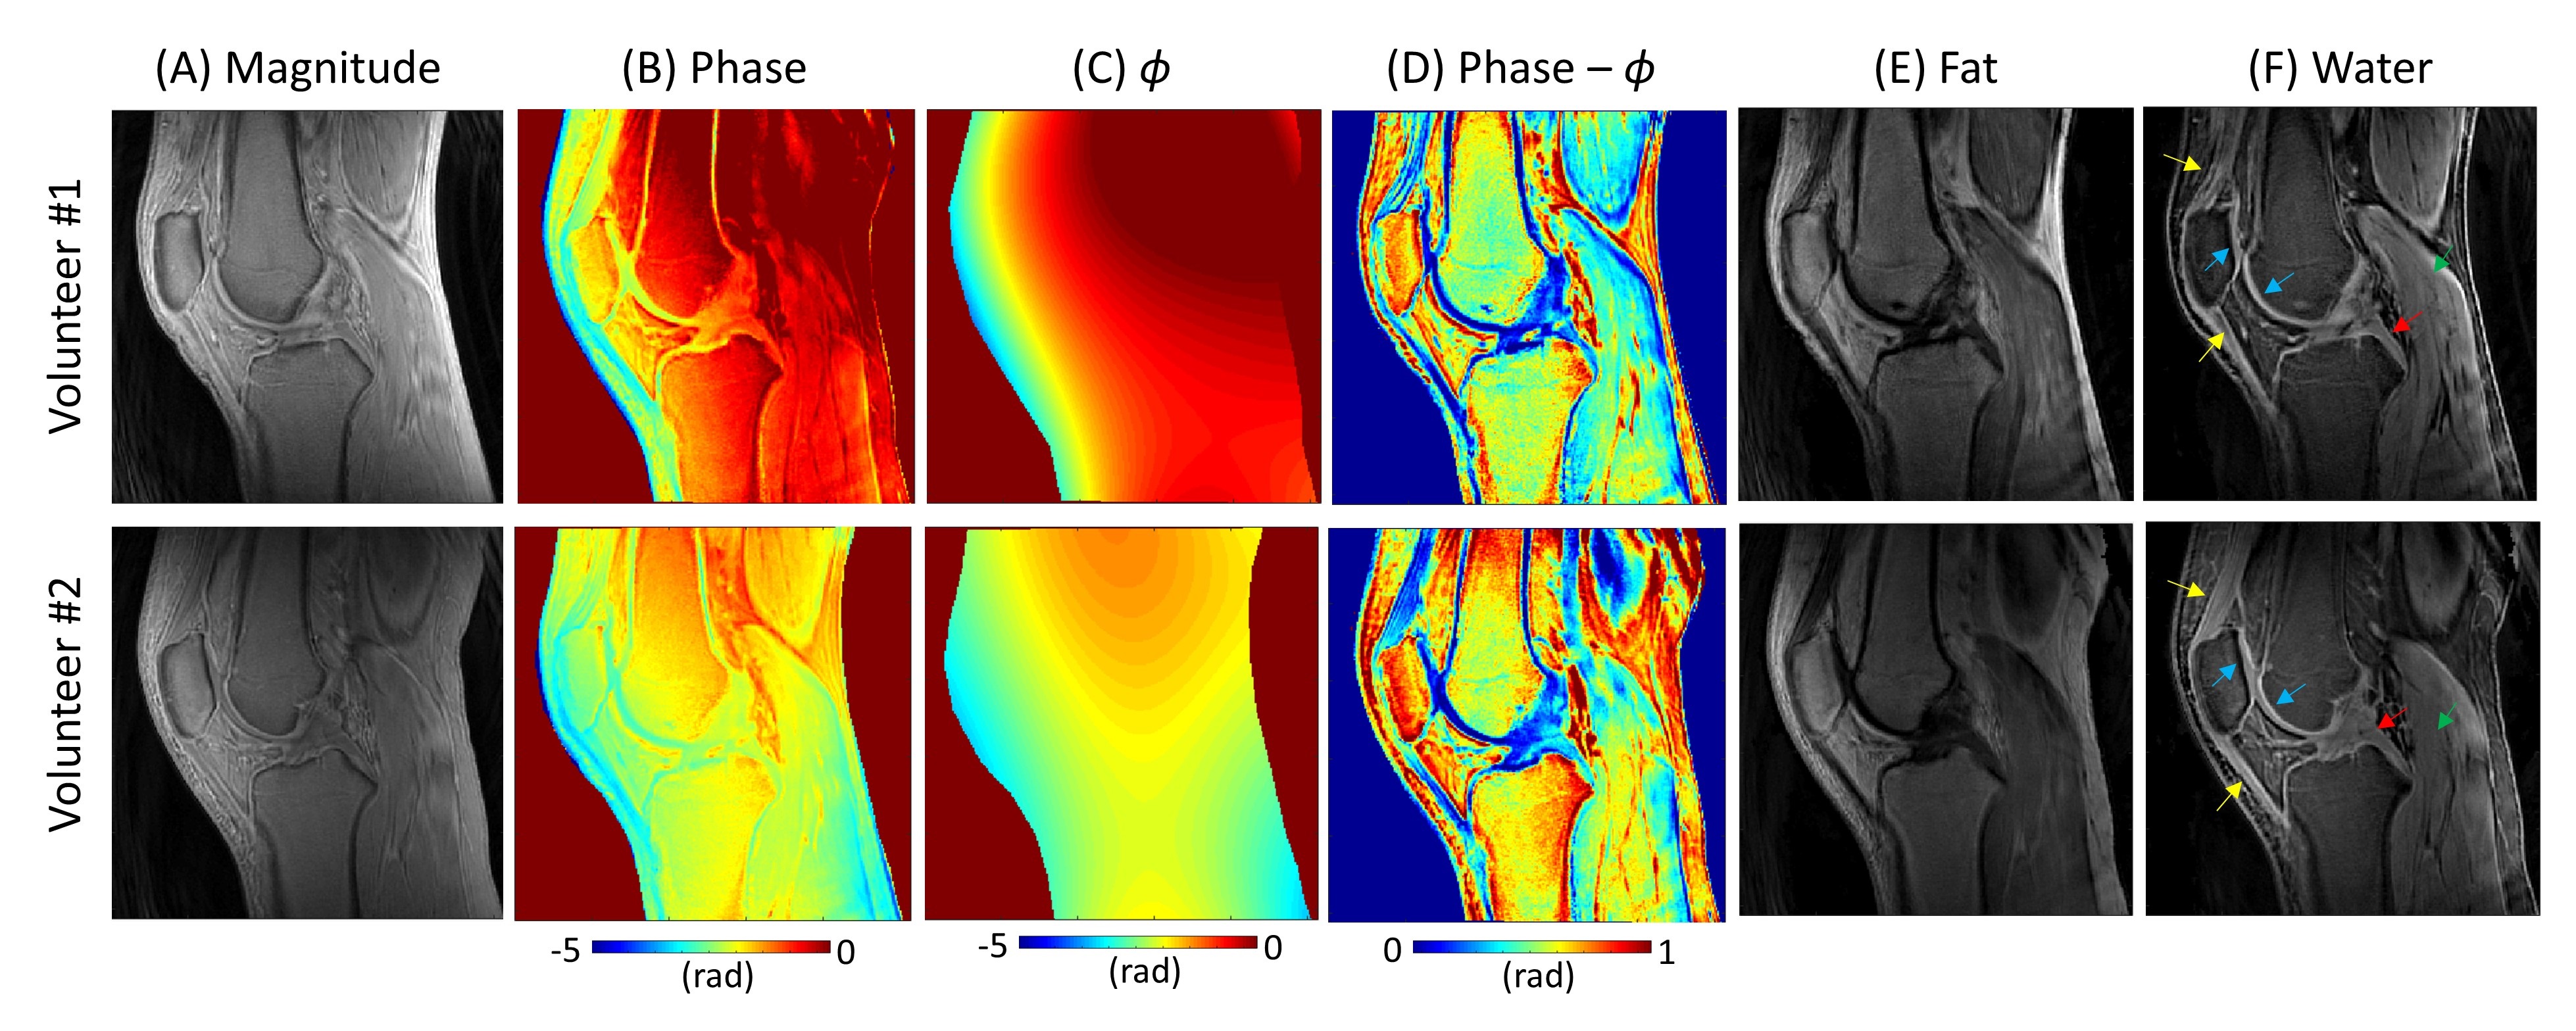
Figure 4 shows representative slices from all four cadaveric knee specimens, where robust fat suppression was achieved without negative impacts on the signal from short T2 tissues. Figure 5 shows the results of two healthy volunteers. In the estimated water images, short and long T2 tissues of interest are clearly delineated, including tendons (yellow arrows), ligaments (red arrows), muscles (green arrows), and cartilages (blue arrows).
Discussion and Conclusion
The proposed 1p-Dixon approach utilizing polynomial fitting of the 3D phase model is likely to provide robust and reproducible fat suppression for UTE imaging without the need for additional data acquisition. The underlying assumption for lower-order polynomial modeling of is highly plausible for UTE imaging where B0 inhomogeneity-induced phase error is negligibly small and thus smooth. The B1 phase, which depends on the electric conductivity of tissues and the receiver phase of the RF coil12, is known to be smooth. We used a data-driven approach based on a histogram of phase values to find the baseline phase (water phase) and determine the best fat phase. Although we demonstrate this approach is effective in morphological UTE-MSK imaging, this may cause a potential error in quantitative UTE imaging. In future studies, we will further improve the proposed method, and apply it to quantitative UTE imaging.Acknowledgements
The authors acknowledge grant support from the NIH (R01AR078877, R01AR062581, R01AR068987, and RF1AG075717), VA Clinical Science Research and Development Services Merit Awards (I01CX002211), the DFG (SE 3272/1-1), and GE Healthcare.References
1. Del Grande F, Santini F, Herzka DA, et al. Fat-Suppression Techniques for 3-T MR Imaging of the Musculoskeletal System. RadioGraphics 2014;34:217–233.
2. Haase A, Frahm J, Hanicke W, Matthaei D. 1H NMR chemical shift selective (CHESS) imaging. Phys. Med. Biol. 1985;30:341–344.
3. Krinsky G, Rofsky NM, Weinreb JC. Nonspecificity of short inversion time inversion recovery (STIR) as a technique of fat suppression: pitfalls in image interpretation. Am. J. Roentgenol. 1996;166:523–526.
4. Reeder SB, Pineda AR, Wen Z, et al. Iterative decomposition of water and fat with echo asymmetry and least-squares estimation (IDEAL): Application with fast spin-echo imaging. Magn. Reson. Med. 2005;54:636–644.
5. Eggers H, Brendel B, Duijndam A, Herigault G. Dual-echo Dixon imaging with flexible choice of echo times. Magn. Reson. Med. 2011;65:96-107.
6. Deligianni X, Bär P, Scheffler K, Trattnig S, Bieri O. Water-selective excitation of short T 2 species with binomial pulses. Magn. Reson. Med. 2014;72:800–805.
7. Carl M, Nazaran A, Bydder GM, Du J. Effects of fat saturation on short T2 quantification. Magn. Reson. Imaging 2017;43:6–9.
8. Jang H, Carl M, Ma Y, et al. Fat suppression for ultrashort echo time imaging using a single-point Dixon method. NMR Biomed. 2019:e4069.
9. Jang H, Ma Y, Carl M, Jerban S, Chang EY, Du J. Ultrashort echo time Cones double echo steady state (UTE‐Cones‐DESS) for rapid morphological imaging of short T 2 tissues. Magn. Reson. Med. 2021;86:881–892.
10. Kronthaler S, Boehm C, Feuerriegel G, et al. Assessment of vertebral fractures and edema of the thoracolumbar spine based on water‐fat and susceptibility‐weighted images derived from a single ultra‐short echo time scan. Magn. Reson. Med. 2021:1–13.
11. Fessler JA. On NUFFT-based gridding for non-Cartesian MRI. J. Magn. Reson. 2007;188:191–195.
12. Lee J, Shin J, Kim DH. MR-based conductivity imaging using multiple receiver coils. Magn. Reson. Med. 2016;76:530–539.
Figures