0120
Ultrashort-echo time magnetization transfer (UTE-MT) for brain iron imaging1School of Health Sciences, Purdue University, West Lafayette, IN, United States, 2Weldon School of Biomedical Engineering, Purdue University, West Lafayette, IN, United States, 3Radiology, University of California San Francisco, San Francisco, CA, United States, 4Department of Radiology, Medical Physics, University of Freiburg, Freiburg, Germany, 5Welcome Centre for Integrative Neuroimaging, University of Oxford, England, United Kingdom, 6Department of Audiology and Speech Sciences, Purdue University, West Lafayette, IN, United States, 7Department of Radiology and Imaging Sciences, Indiana University School of Medicine, Indianapolis, IN, United States
Synopsis
Keywords: Contrast Mechanisms, Brain
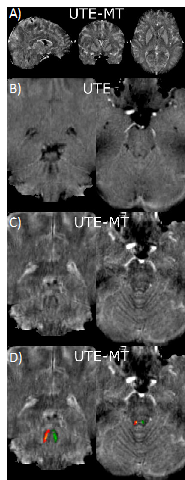
We have established a novel 3D dual-echo UTE-MT imaging method to assess hyperintense T1w signal in iron-rich brain areas by eliminating the ultra-short T2 constituents of the myelin signal via the magnetization transfer (MT) technique. Our preliminary results show improved positive image contrast in deep brain areas such as the substantia nigra (SN) and the LC. Other iron-rich areas in the basal ganglia (globus pallidus and putamen) also show improved contrast.Introduction
Over the past decade, several studies have shown that very short T2 components associated with myelin lipids could be imaged using ultra-short echo time (UTE) MRI sequences1. Recently, UTE sequences have been combined with magnetization transfer (MT) techniques for assessing tissue possessing extremely short T2 relaxation times1-3. In short, an off-resonance saturation pulse is applied to increase the contrast between pools with short and long T2 relaxations resulting in a hyperintense T1w signal (i.e., positive contrast). For example, recent studies have suggested that the hyperintense T1w signals from the locus coeruleus (LC) observed in humans and rodents4 might originate from a large intra-cellular free water proton pool with a short T1 due to a high concentration of metals, such as copper and/or iron. However, conventional MRI imaging suffers a lack of precision and might eventually fail due to the long echo times (order of ms) and the rapidly decaying MR signals5. Advanced ultrashort echo time (UTE) MRI methods, with echo times (TEs) 10-200 times shorter than conventional sequences, prove to be effective in imaging the hyperintense signals originating from metals due to T1w signal intensity6,7. In this study, we aimed to increase the positive contrast from iron-rich brain areas by eliminating the myelin-induced signal with the magnetization transfer (MT) technique. In our previous study, we demonstrated the feasibility of UTE MRI for positive contrast imaging by employing this method in an iron (II) chloride phantom study7, which resulted in an increase in signal hyperintensity with increased iron concentration. We hypothesize that this 3D UTE-MT sequence can surpass the limitations of conventional imaging of deep brain regions.MRI Measurements
The study was approved by the Institutional Review Boards (IRBs) of Purdue University, and informed consent was obtained. Three healthy volunteers (2M, 1F) underwent a brain scan with a whole-body 3T MRI system (Siemens Healthineers, Erlangen, Germany). A vendor-supplied 20-channel receiver head coil was used.Sequences
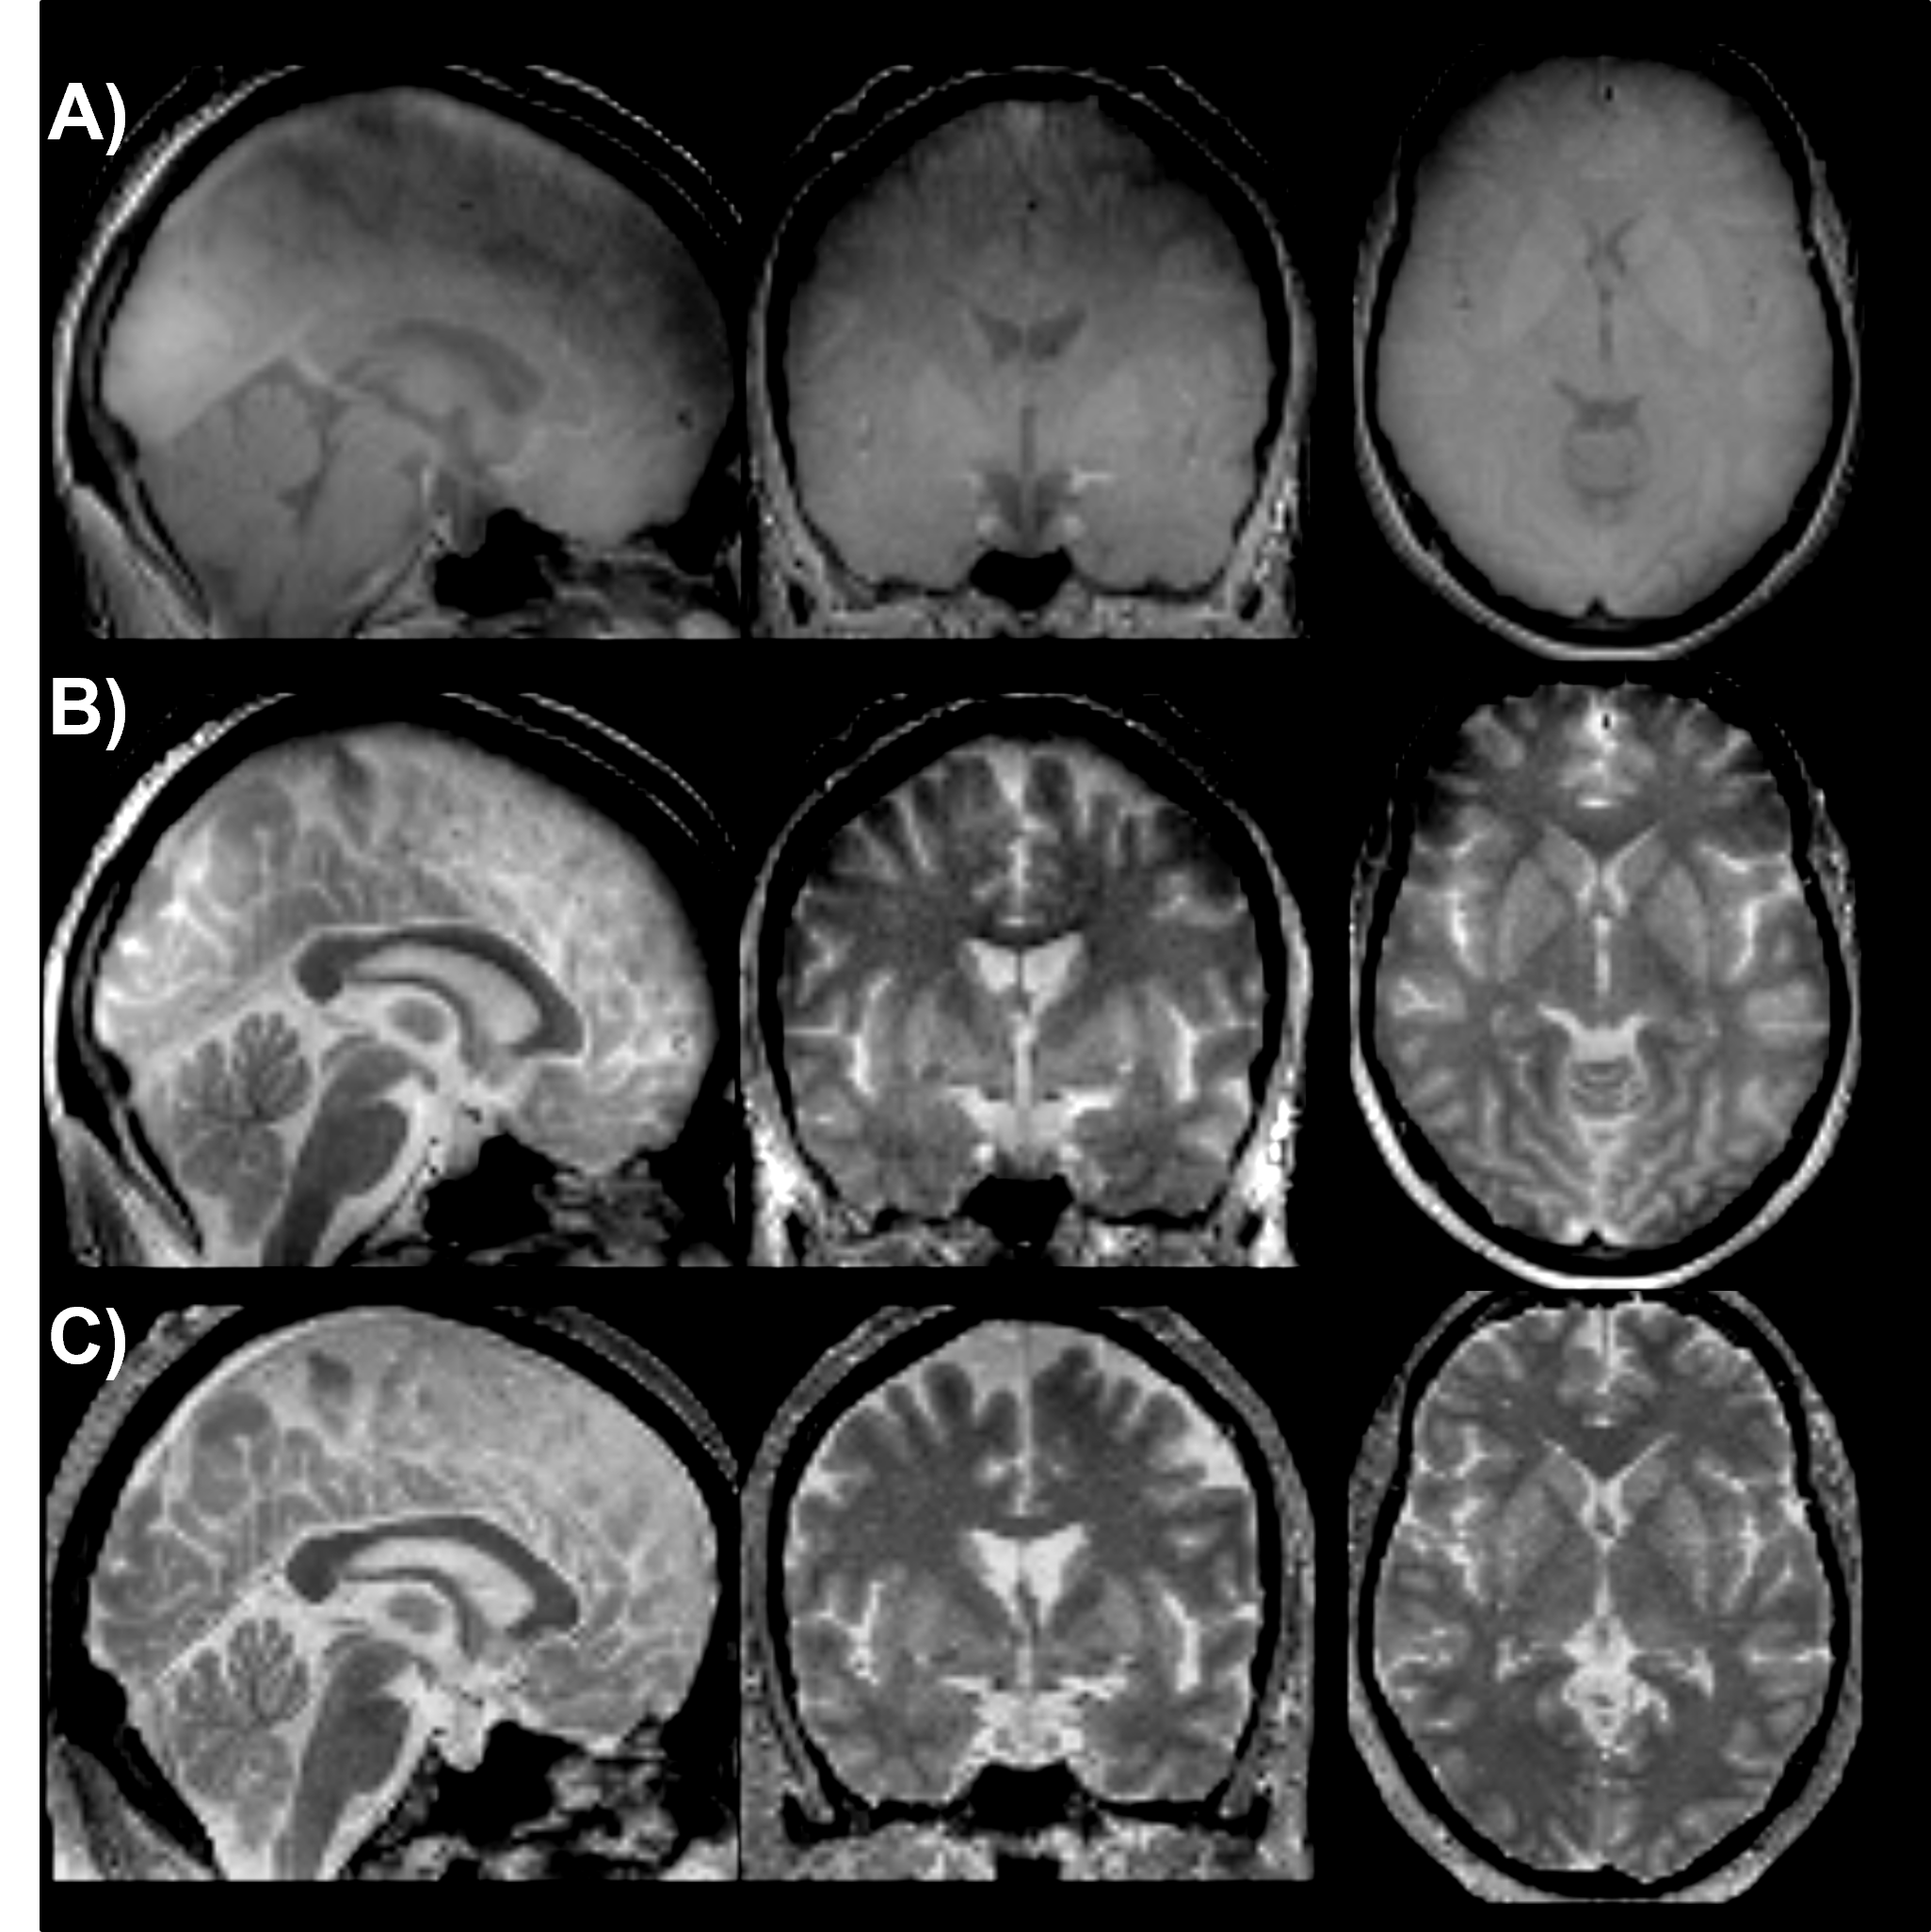
Two of the three volunteers were scanned with three different sequences: UTE, UTE-MT, and conventional multi-echo MTw FLASH. The parameters for the on-resonance 3D dual-echo rosette UTE acquisition were as described in Shen et al., (2022)8 with TE = 20 us, the field of view (FOV)=240x240x240 mm3, matrix size=256x256x256, flip angle=7-degree, TR=7 ms, RF pulse duration=10 ms, readout duration 2.1 ms per echo, acquisition time 8:20 minutes. The MT scheme uses a pair of adiabatic hyperbolic secant (sech) 180° pulses with a total pulse length = 24 ms, pulse bandwidth = 1 kHz with an offset frequency of −1300 Hz from water; each MT pulse was followed by 9 repetitions, total acquisition time of 12:00 minutes. The MTw FLASH parameters followed the MPM protocol from Weiskopf N, et al 20139.Image Analysis
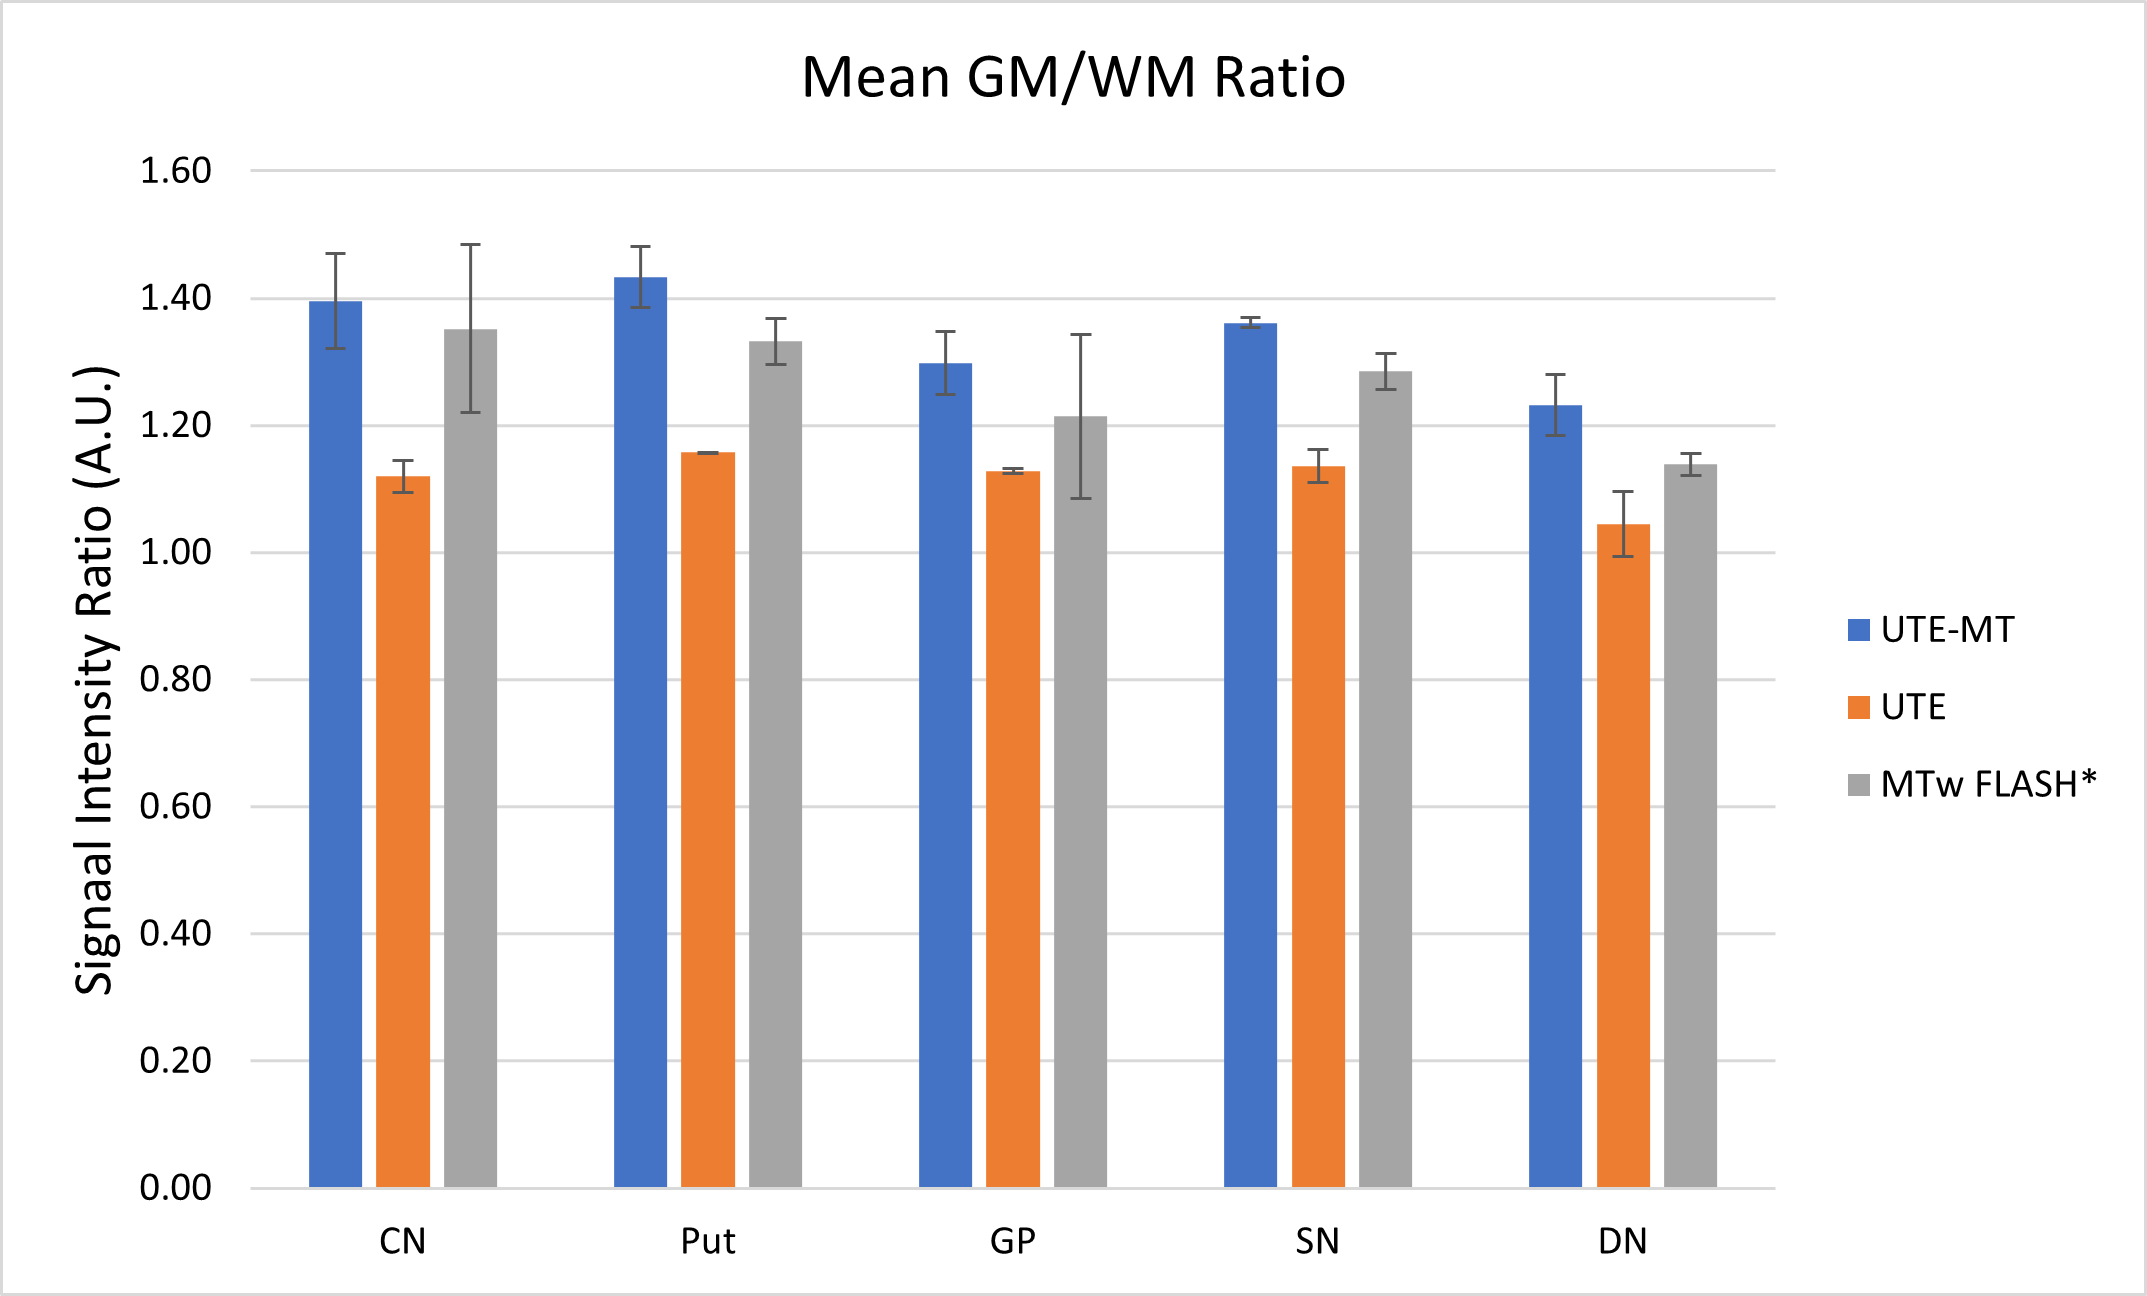
UTE and UTE-MT raw data were reconstructed in MATLAB (MathWorks, USA) as described in Shen et al., (2022)8. The non-uniform fast Fourier transform (NUFFT) and a sparsity constraint on total image variation were used for image reconstruction. The MTw images from the FLASH sequenced were processed through the hMRI Toolbox10. After image reconstruction, all images from the UTE scans were co-registered to the conventional MTw scan using SPM12. Next, the MTw scan was normalized to a standard brain atlas (MNI-152), and the same transformations were applied to the UTE scans. Lastly, all of the normalized images went through 3dunifize (AFNI) for bias-field correction.To assess grey matter to white matter contrast, bilateral circular regions of interest were drawn on 5 iron-rich brain areas, including the globus pallidus (GP), putamen (Put), caudate nucleus (CN), substantia nigra (SN), and dentate nucleus (DN) in the cerebellum. These were then averaged and divided by the average white matter signal from a white matter region near the iron-rich area (the frontal white matter, for example).
Results
We demonstrated that the proposed UTE-MT, with nearly identical measurement parameters as in our preliminary study6, can generate an improved grey matter to white matter ratio in a human study at 3T. Our preliminary data clearly shows an improved hyperintense signal in the PD-relevant deep brain structures, such as the substantia nigra, putamen, and globus pallidus (Fig. 1), which may indicate the hyperintense signals originating from metals (i.e., positive contrast) due to T1w signal intensity.Discussion and Conclusion
In this study, we demonstrated improved positive contrast from the iron-rich brain by eliminating the myelin-induced signal with the magnetization transfer (MT) technique. Future experiments will include iron phantom studies to characterize the quantitative dynamic range of the UTE-MT sequence and a quantitative assessment via the UTE-MT ratio (UTE-MTR) that reflect both direct saturation of ultrashort T2 components as well as MT saturation of longer T2 components. Lastly, we will assess the image contrast of the saturated signal as a function of saturation frequency.Acknowledgements
This study was supported by NIH/NIEHS R01 ES032478. Data acquisition was supported in part by NIH grant S10 OD012336 and the Ralph W. and Grace M. Showalter Research Trust.References
1. Guglielmetti C, Boucneau T, Cao P, Van der Linden A, Larson PEZ, Chaumeil MM. Longitudinal evaluation of demyelinated lesions in a multiple sclerosis model using ultrashort echo time magnetization transfer (UTE-MT) imaging. Neuroimage. 2020 Mar;208:116415. doi: 10.1016/j.neuroimage.2019.116415.
2. Carl M, Ma Y, Du J. Theoretical analysis and optimization of ultrashort echo time (UTE) imaging contrast with off-resonance saturation. Magn Reson Imaging. 2018 Jul;50:12-16. doi:10.1016/j.mri.2018.03.002.
3. Chang EY, Bae WC, Shao H, Biswas R, Li S, Chen J, Patil S, Healey R, D'Lima DD, Chung CB, Du J. Ultrashort echo time magnetization transfer (UTE-MT) imaging of cortical bone. NMR Biomed. 2015 Jul;28(7):873-80. doi: 10.1002/nbm.3316.
4. Tona KD, van Osch MJP, Nieuwenhuis S, Keuken MC. Quantifying the contrast of the human locus coeruleus in vivo at 7 Tesla MRI. PLoS One. 2019 Feb 6;14(2):e0209842. doi: 10.1371/journal.pone.0209842. PMID: 30726221; PMCID: PMC6364884.
5. Krafft AJ, Loeffler RB, Song R, et al. Quantitative ultrashort echo time imaging for assessment of massive iron overload at 1.5 and 3 Tesla. Magn Reson Med. 2017;78(5):1839-1851. doi:10.1002/mrm.26592.
6. Magnitsky S, Zhang J, Idiyatullin D, Mohan G, Garwood M, Lane NE, Majumdar S. Positive contrast from cells labeled with iron oxide nanoparticles: Quantitation of imaging data. Magn Reson Med. 2017 Nov;78(5):1900-1910. doi: 10.1002/mrm.26585.
7. Shen, X, Özen, AC, Monsivais, H., et al. High-Resolution 3D Ultra-Short Echo Time MRI with Rosette k-Space Pattern for Brain Iron Content Mapping. [Preprint]. https://www.biorxiv.org/content/10.1101/2022.08.24.505201v1.
8. Shen, X, Özen, AC, Susnjar, A, et al. Ultra-short T2 components imaging of the whole brain using 3D dual-echo UTE MRI with rosette k-space pattern. Magn Reson Med. 2022; 1- 14. doi:10.1002/mrm.29451.
9. Weiskopf N, Suckling J, Williams G, Correia MM, Inkster B, Tait R, Ooi C, Bullmore ET, Lutti A. Quantitative multi-parameter mapping of R1, PD(*), MT, and R2(*) at 3T: a multi-center validation. Front Neurosci. 2013 Jun 10;7:95. doi: 10.3389/fnins.2013.00095.
10. Tabelow K, Balteau E, Ashburner J, Callaghan MF, Draganski B, Helms G, Kherif F, Leutritz T, Lutti A, Phillips C, Reimer E, Ruthotto L, Seif M, Weiskopf N, Ziegler G, Mohammadi S. hMRI - A toolbox for quantitative MRI in neuroscience and clinical research. Neuroimage. 2019 Jul 1;194:191-210. doi: 10.1016/j.neuroimage.2019.01.029.
Figures