0117
Radial MP2RAGE combined with binomial pulses for multi-parametric (T1 and PDFF) abdominal mapping.
François E Maingault1, William Lefrançois1, Nadège Corbin1, Aurélien J Trotier1, Laurence Dallet1, Eric Thiaudière1, Sylvain Miraux1, and Emeline EJ Ribot1
1Centre de Résonance Magnétique des Systèmes Biologiques, UMR5536, CNRS/Université de Bordeaux, Bordeaux, France
1Centre de Résonance Magnétique des Systèmes Biologiques, UMR5536, CNRS/Université de Bordeaux, Bordeaux, France
Synopsis
Keywords: Pulse Sequence Design, Fat, Water, pdff, Abdomen
A 3D radial-encoding MP2RAGE sequence was developed with binomial pulses within the GRE trains. These give the possibility to obtain water-specific, fat- specific or composite 3D T1-maps of the abdominal cavity during free-breathing in less than 10 minutes. A 3D Proton Density Fat Fraction (PDFF) map can also be determined with the same scan. The T1 values are similar with the standard MP2RAGE and the PDFF correspond to the ones obtained with MR spectroscopy. A test-retest on healthy volunteers shows the good reproducibility of the method.Introduction
Abdominal T1 mapping is usually performed using variants of Look-Locker sequences (MOLLI, SASHA) or a Variable Flip Angle (VFA) sequence. VFA needs to be corrected for B1 imperfection and requires multiple angles to measure a large T1 range, lengthening its duration. T1 measurements are biased in the presence of fat when using LL sequences, although the water-specific T1 seems to be a more valuable information than the composite T1 (including both water and fat T1 in one voxel) for hepatic diseases. Also, these sequences are usually applied in 2D in order to fit their duration within a breath-hold, sacrificing the spatial resolution in at least one direction.Consequently, we developed a MP2RAGE sequence with a 3D radial encoding to limit motion sensitivity, and with frequency-selective pulses in order to independently measure both the water-specific T1 and the fat-specific T1 at 3T. With these data, we also developed a method to accurately measure the Proton-Density Fat-Fraction (PDFF).
Materials and Methods
Two golden angles were implemented in order to obtain a pseudo-random filling of the k-spaces, continuing from one MP2RAGETR (5000ms) to the next, as described by Faller et al [1]. Binomial pulses including 6 sub-pulses (total duration of 3.9ms) were implemented in the GRE train (128 echoes), replacing the standard pulses (named NonSel thereafter). Odd trajectories were acquired with a water-frequency selective pulse and the even ones were acquired with a fat-selective pulse [2]. T1-maps were reconstructed either with the odd (water-specific T1) , the even (fat-specific T1) projections or both (composite), from acquisitions lasting 12min for a total of 18432 projections. To measure the PDFF, the signal of each voxel obtained at equilibrium was first estimated for both water (Sw) and fat (Sf) tissues, from the signals measured at GRE1 and GRE2 and the measured T1. Then, the PDFF was computed as follow : PDFF = Sf/(Sf+Sw).This new sequence was applied on a commercially available phantom (MultiSample120, Gold Standard Phantoms, United Kingdom) containing home-made solutions: either increasing concentrations of Gd-DOTA, or increasing volume of pork fat, both diluted in 1.5% agarose gel. Then, the sequence was applied on 8 healthy volonteers on a Siemens 3T PRISMA scanner, using the 18-channel body and the spine coils.
Regions-of-interest (ROI) were drawn on the parametric maps using Matlab, on the liver (taking care of not including large blood vessels) and on the back muscles (representing 100% water-containing tissues), and on the subcutaneous adipose tissue (containing 100% fat).
Results
On the phantom, the binomial pulses enabled to selectively obtain water-specific T1 in tubes without lard (Figure 1). Similar T1 values were consequently obtained on the NonSel, Composite and Wat T1 maps. Also, the valueswere similar to the gold-standard Inversion-Recovery (IR) sequence (<10% bias) and the vendor cartesian MP2RAGE sequence (<10% bias).In tubes containing lard, these pulses enabled to selectively obtain water-specific T1 or fat-specific T1, without being affected by the T1 of fat or water, respectively.
Fat-specific T1 was measured appropriately in every tube (<10% compared to IR), independently of the volume of fat present in the tube. Also, the PDFF calculated was similar to MR spectroscopy (less thant 5% error).
Applied on the volunteers during free-breathing, the radial encoding enabled to obtain respiration-artefact free images and T1 maps of the whole abdomen (Figure 2). The binomial pulses enabled a high selectivity of the tissues, even though the interface between the liver and the lungs was not appropriately excited by the water-selective pulses (representing <1% of the total liver volume). The T1 values of the liver and the muscle in each healthy volunteer were similar on the NonSel, Composite and Wat T1-maps (Figure 3) and were concordant with literature [3]. Also, the standard deviations were much smaller than the ones obtained with the VFA sequence after B1 correction.
The reproducibility of the measurements was quite high (coefficient of variance of less than 9.8%).
Finally, the sequence was accelerated through retrospective undersampling (Figure 4), and showed high quality and similar liver T1 using 12288 projections (so with acquisitions lasting only 8min).
Discussion
Here we presend a methodology to obtain 3D multi-parametric maps of the whole abdominal cavity, due to 1) radial encoding for free-breathing acquisitions and 2) binomial pulses with large coverage. Composite T1, water-specific T1, fat-specific T1 and PDFF can be obtained with one scan, and with measured values close to gold-standard methods and highly reproducible. The duration of this method can be minimized to 8 minutes.Further investigations are needed to appropriately excite the interface between the liver and the lungs. Nevertheless, the T1 of the liver can still be measured accurately in 3D.
Similar T1 measurements were obtained between the radial NonSel and the newly-developed sequence including binomial pulses, which validates its reliability. Application on pathological tissue is necessary to further demonstrate the potential of this method.
Conclusion
The new method developed here is of great interest for multiple applications, like obesity, grading of nonaloholic fatty liver diseases or cirrhosis.Acknowledgements
This study was achieved within the context of the Laboratory of Excellence TRAIL ANR-10-LABX-57. This work was also supported by the French National Research Agency (ANR-19-CE19-0014).References
1. Faller T. et al. ‘Radial MP2RAGE sequence for rapid 3D-T1-mapping of mouse abdomen: application to hepatic metastases’, European Radiology, 2019.
2.
Levitt M.H. ’Composite pulses’, Prog NMR Spectrosc, 1986.
3.
De Bazelaire C. et al. ‘MR imaging relaxation times of abdominal and pelvic tissues measured in vivo at 3.0T: preliminary results’, 2004.
Figures
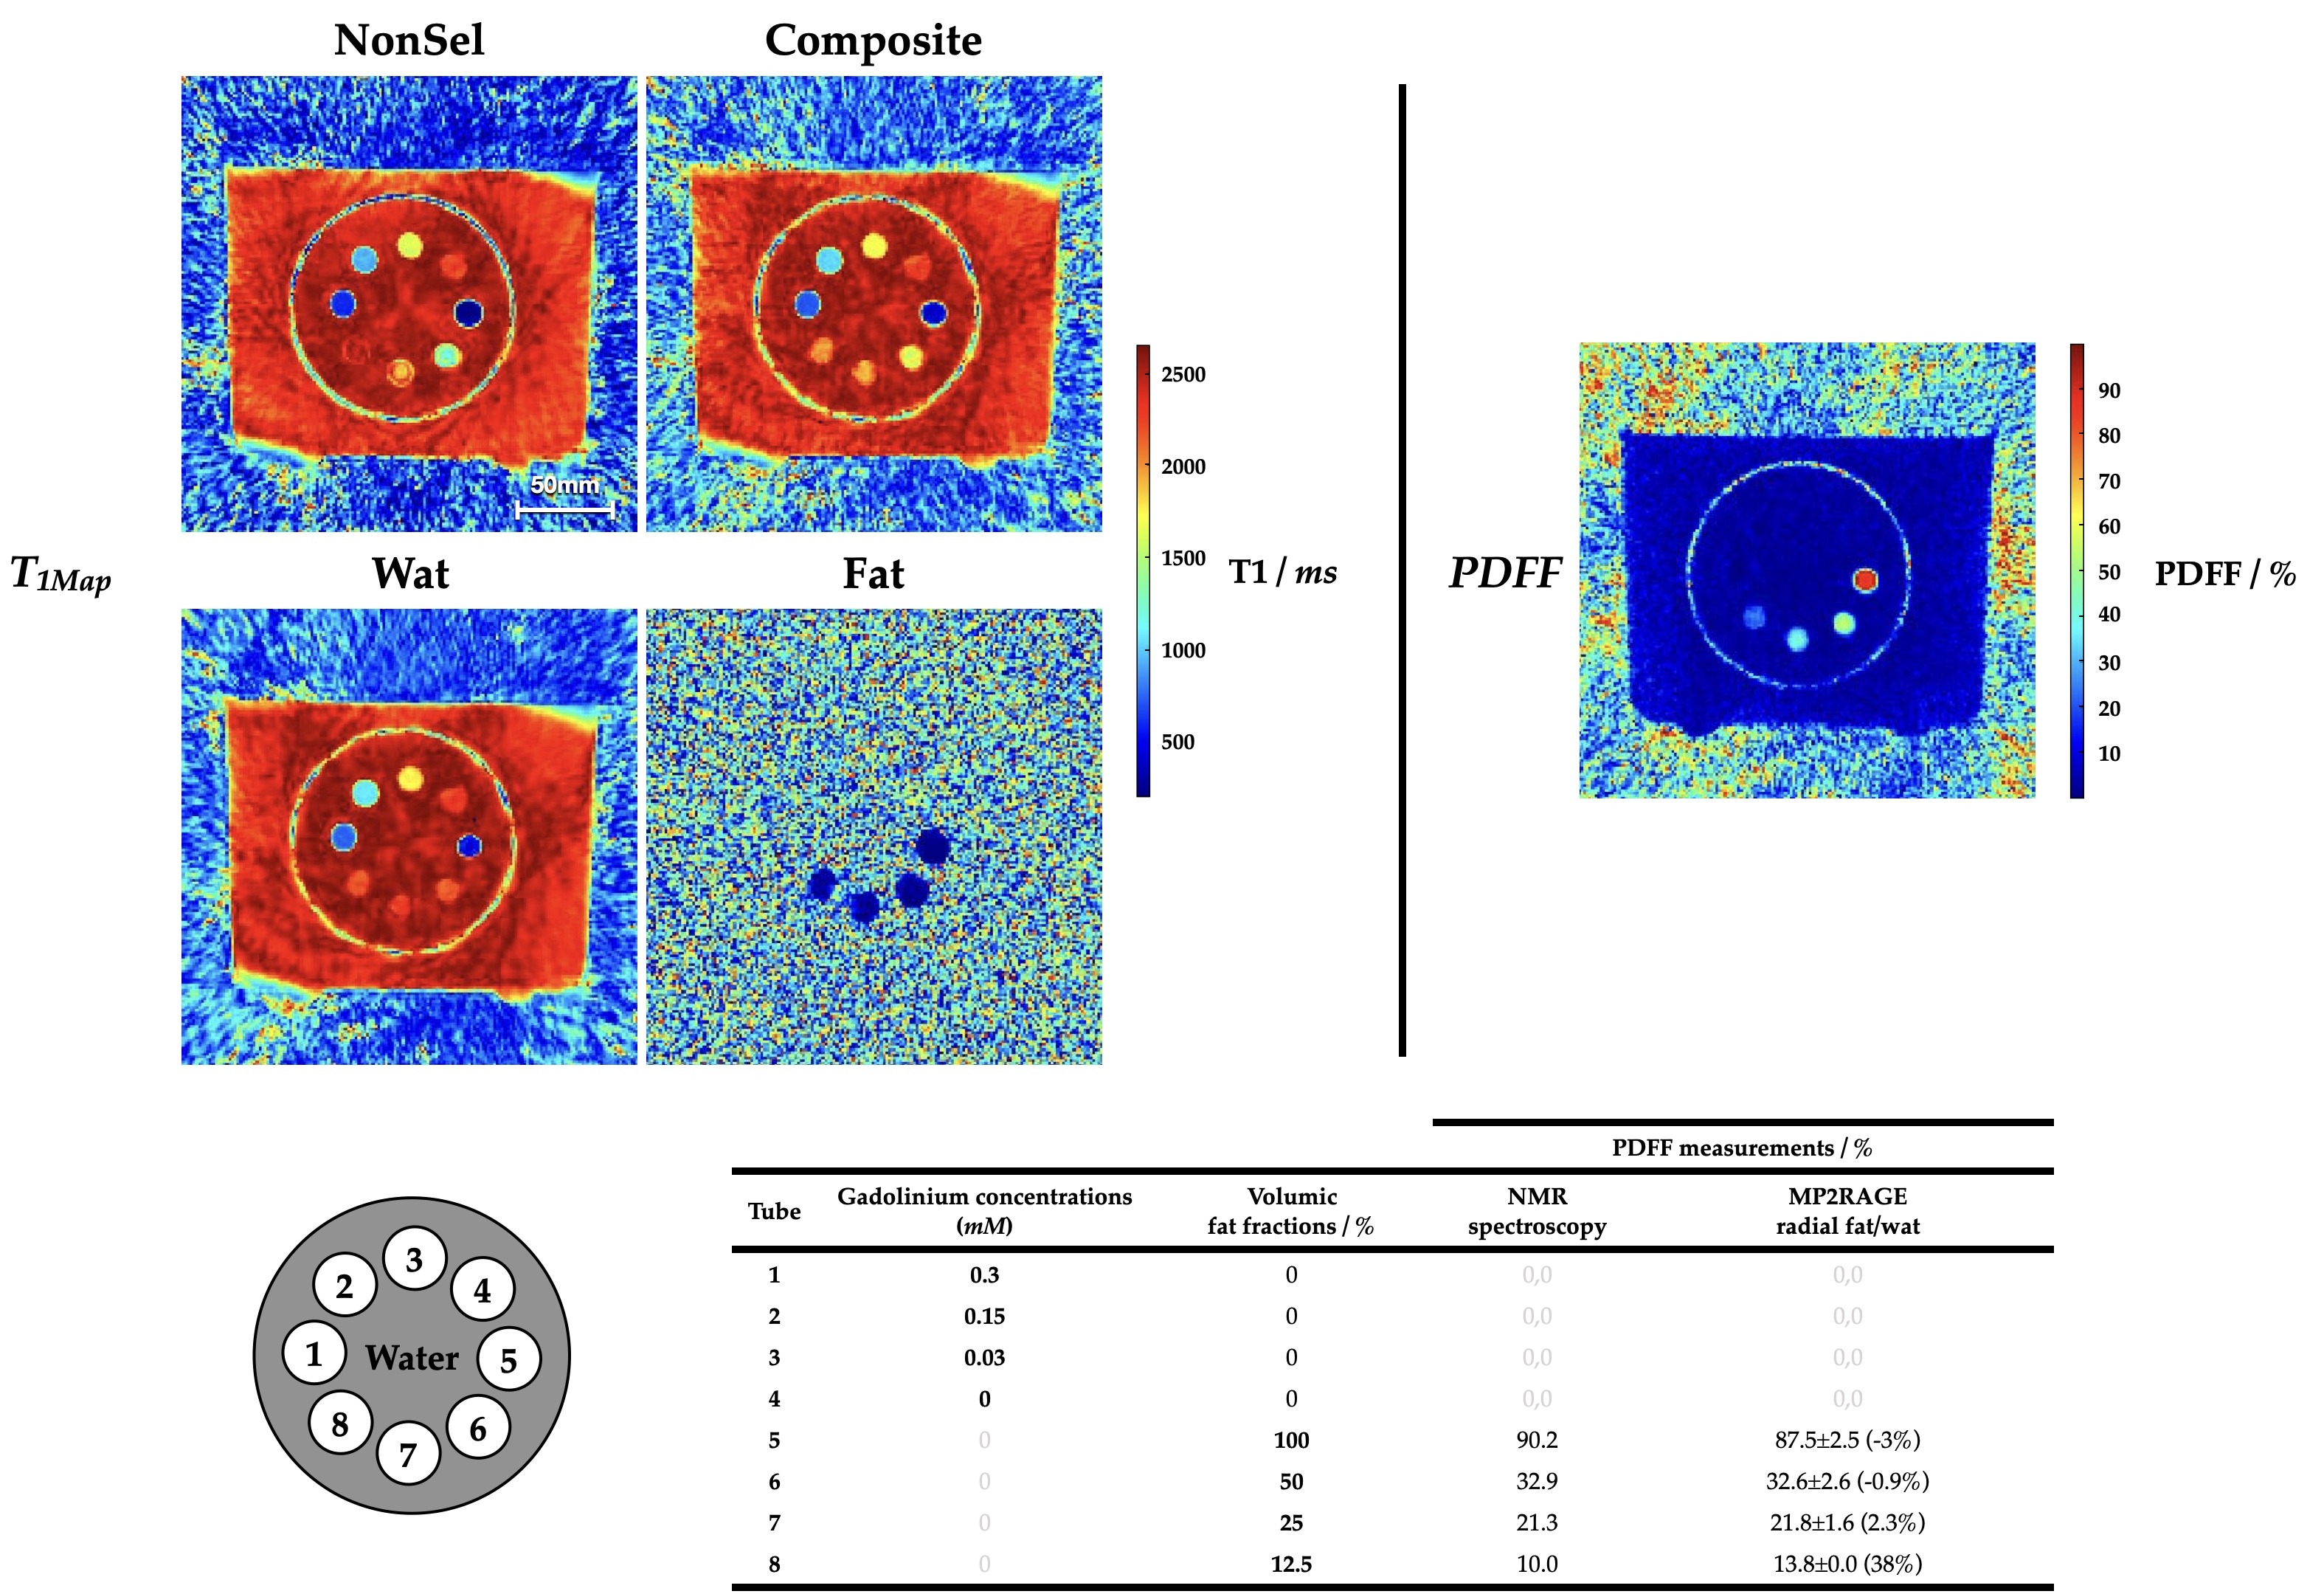
Figure 1: 3D-MP2RAGE T1-maps obtained from non-selective and fat/water selective excitations. Using all projections gives T1-maps (Composite) comparable to non-selective excitation. However, using only odd or even projections gives respectively water or fat T1-maps. From fat and water images, a 3D-PDFF map can be obtained.
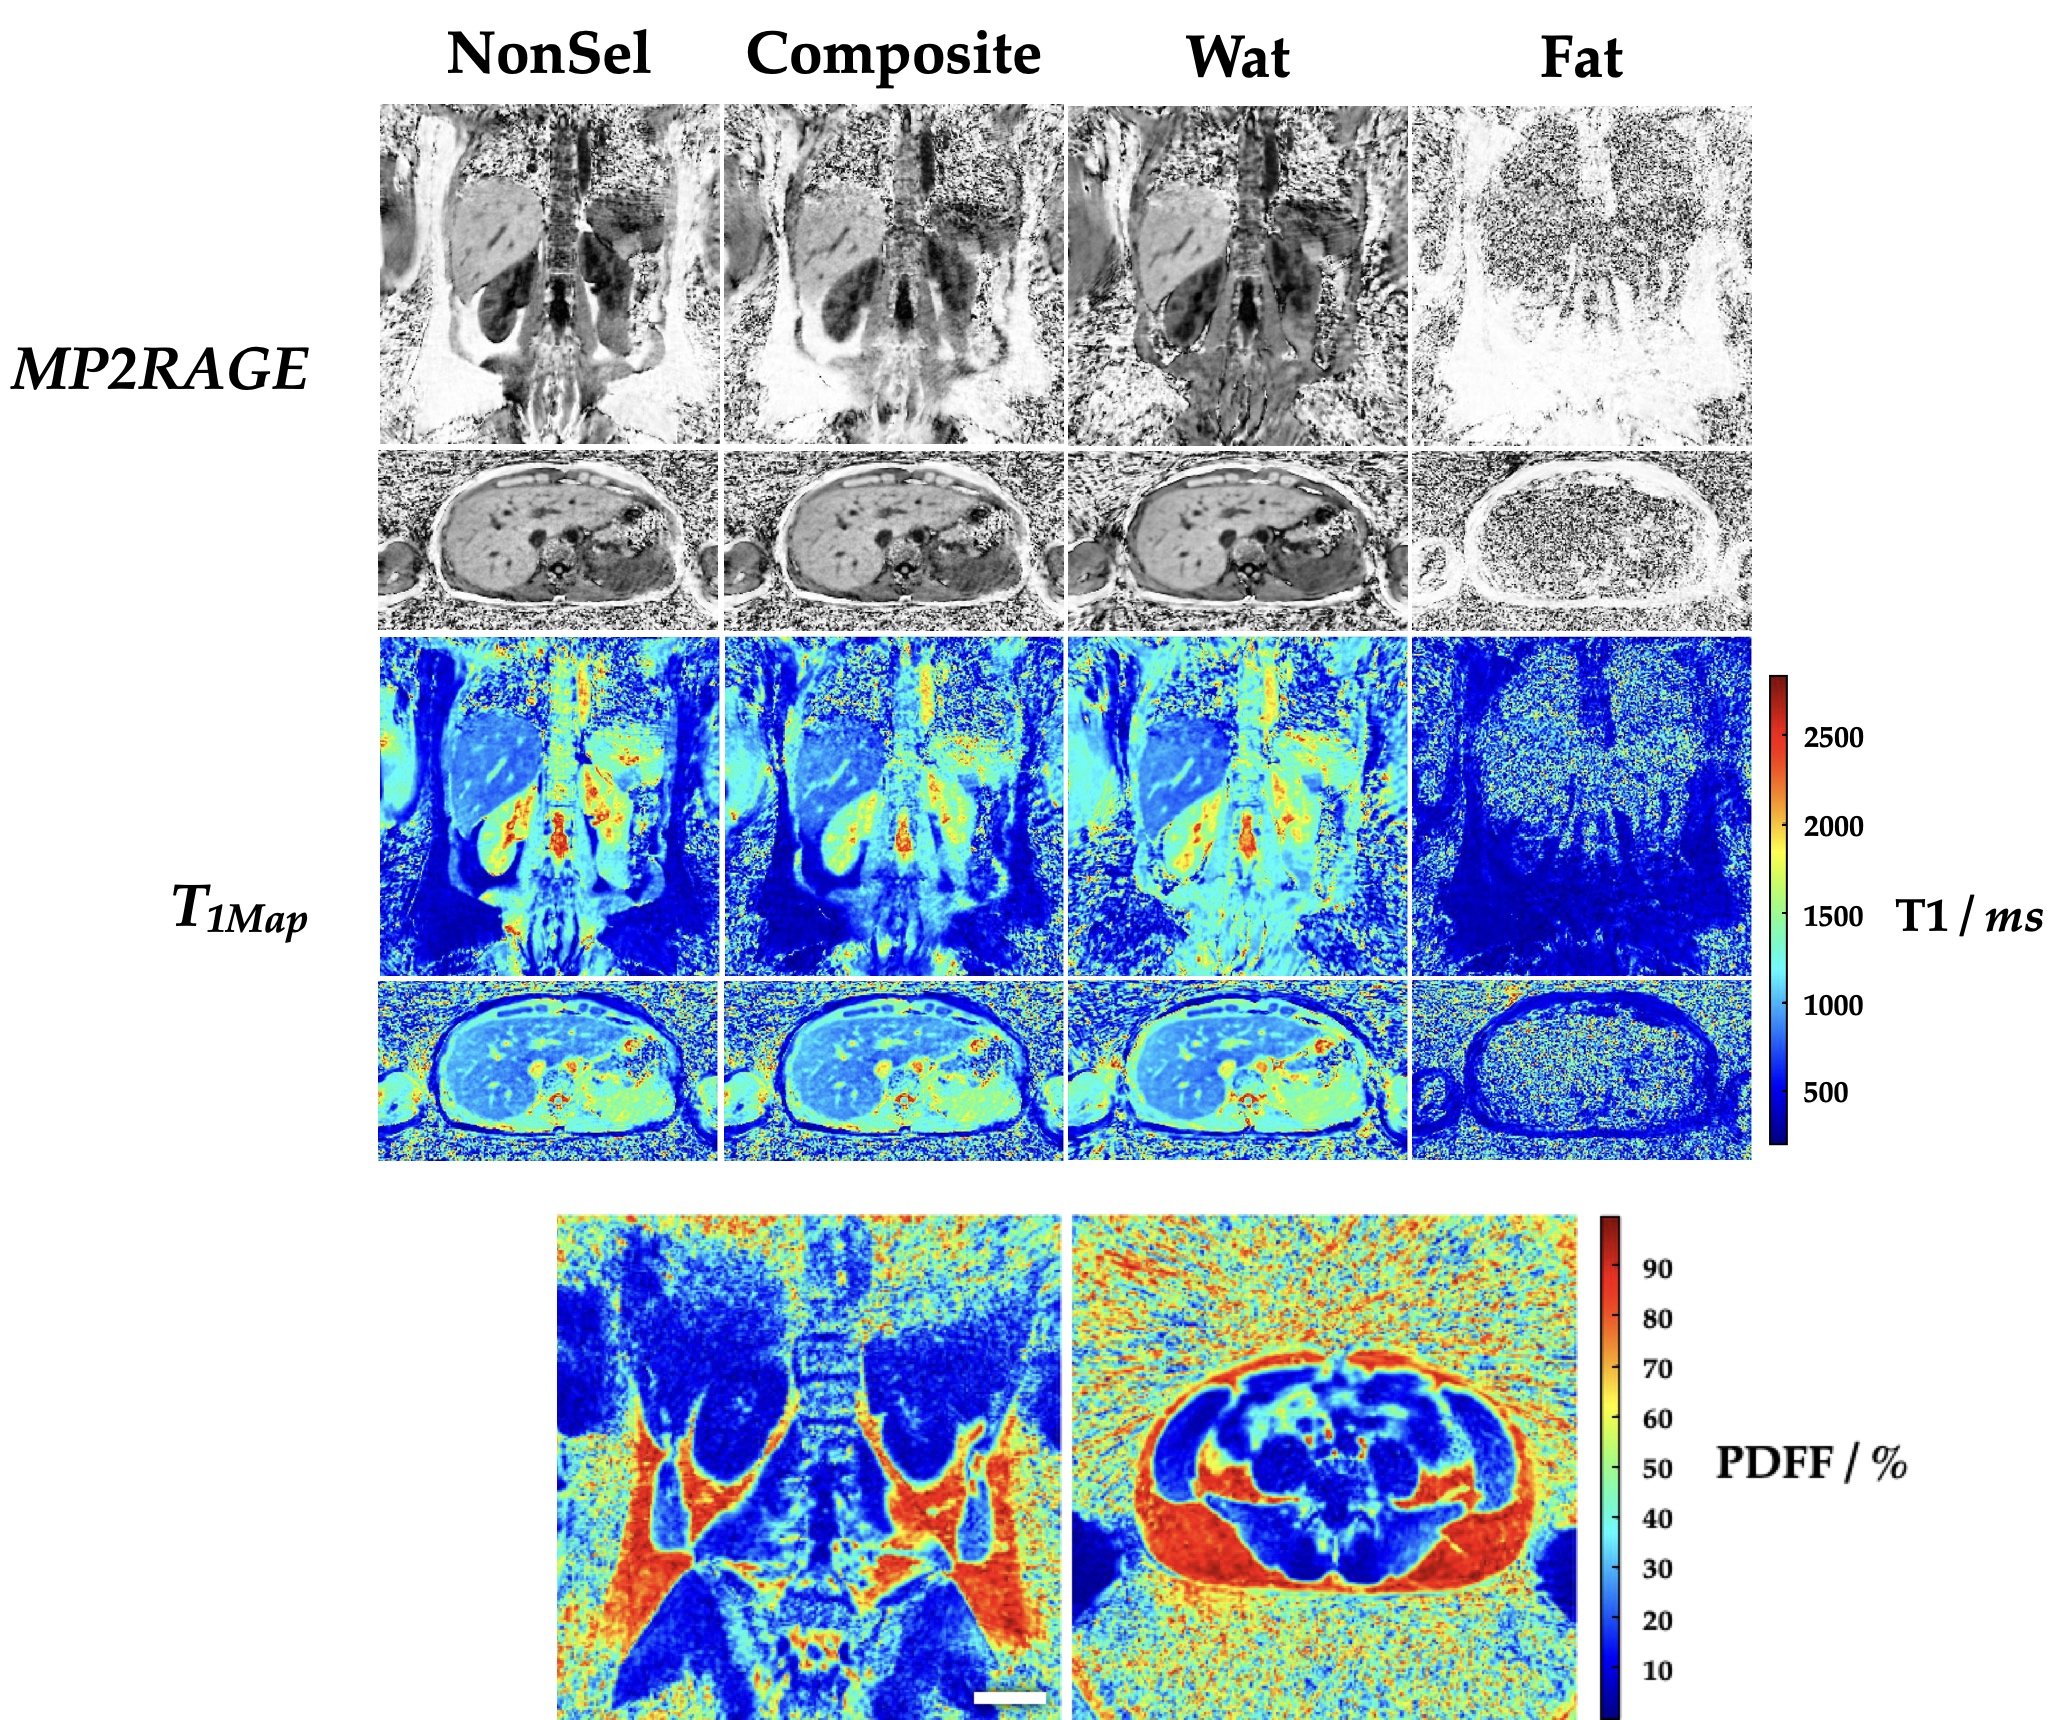
Figure 2: MP2RAGE and 3D-T1-maps obtained on the abdomen in axial and coronal views. The Composite T1-map can be compared to the non selective acquisition. In addition, T1-maps can be obtained, containing exclusively water or fat tissues in order to measure water-specific T1 and fat-specific T1.
PDFF can be determined using images and T1-maps of water and fat. The PDFF shows the fat repartition in the abdomen.
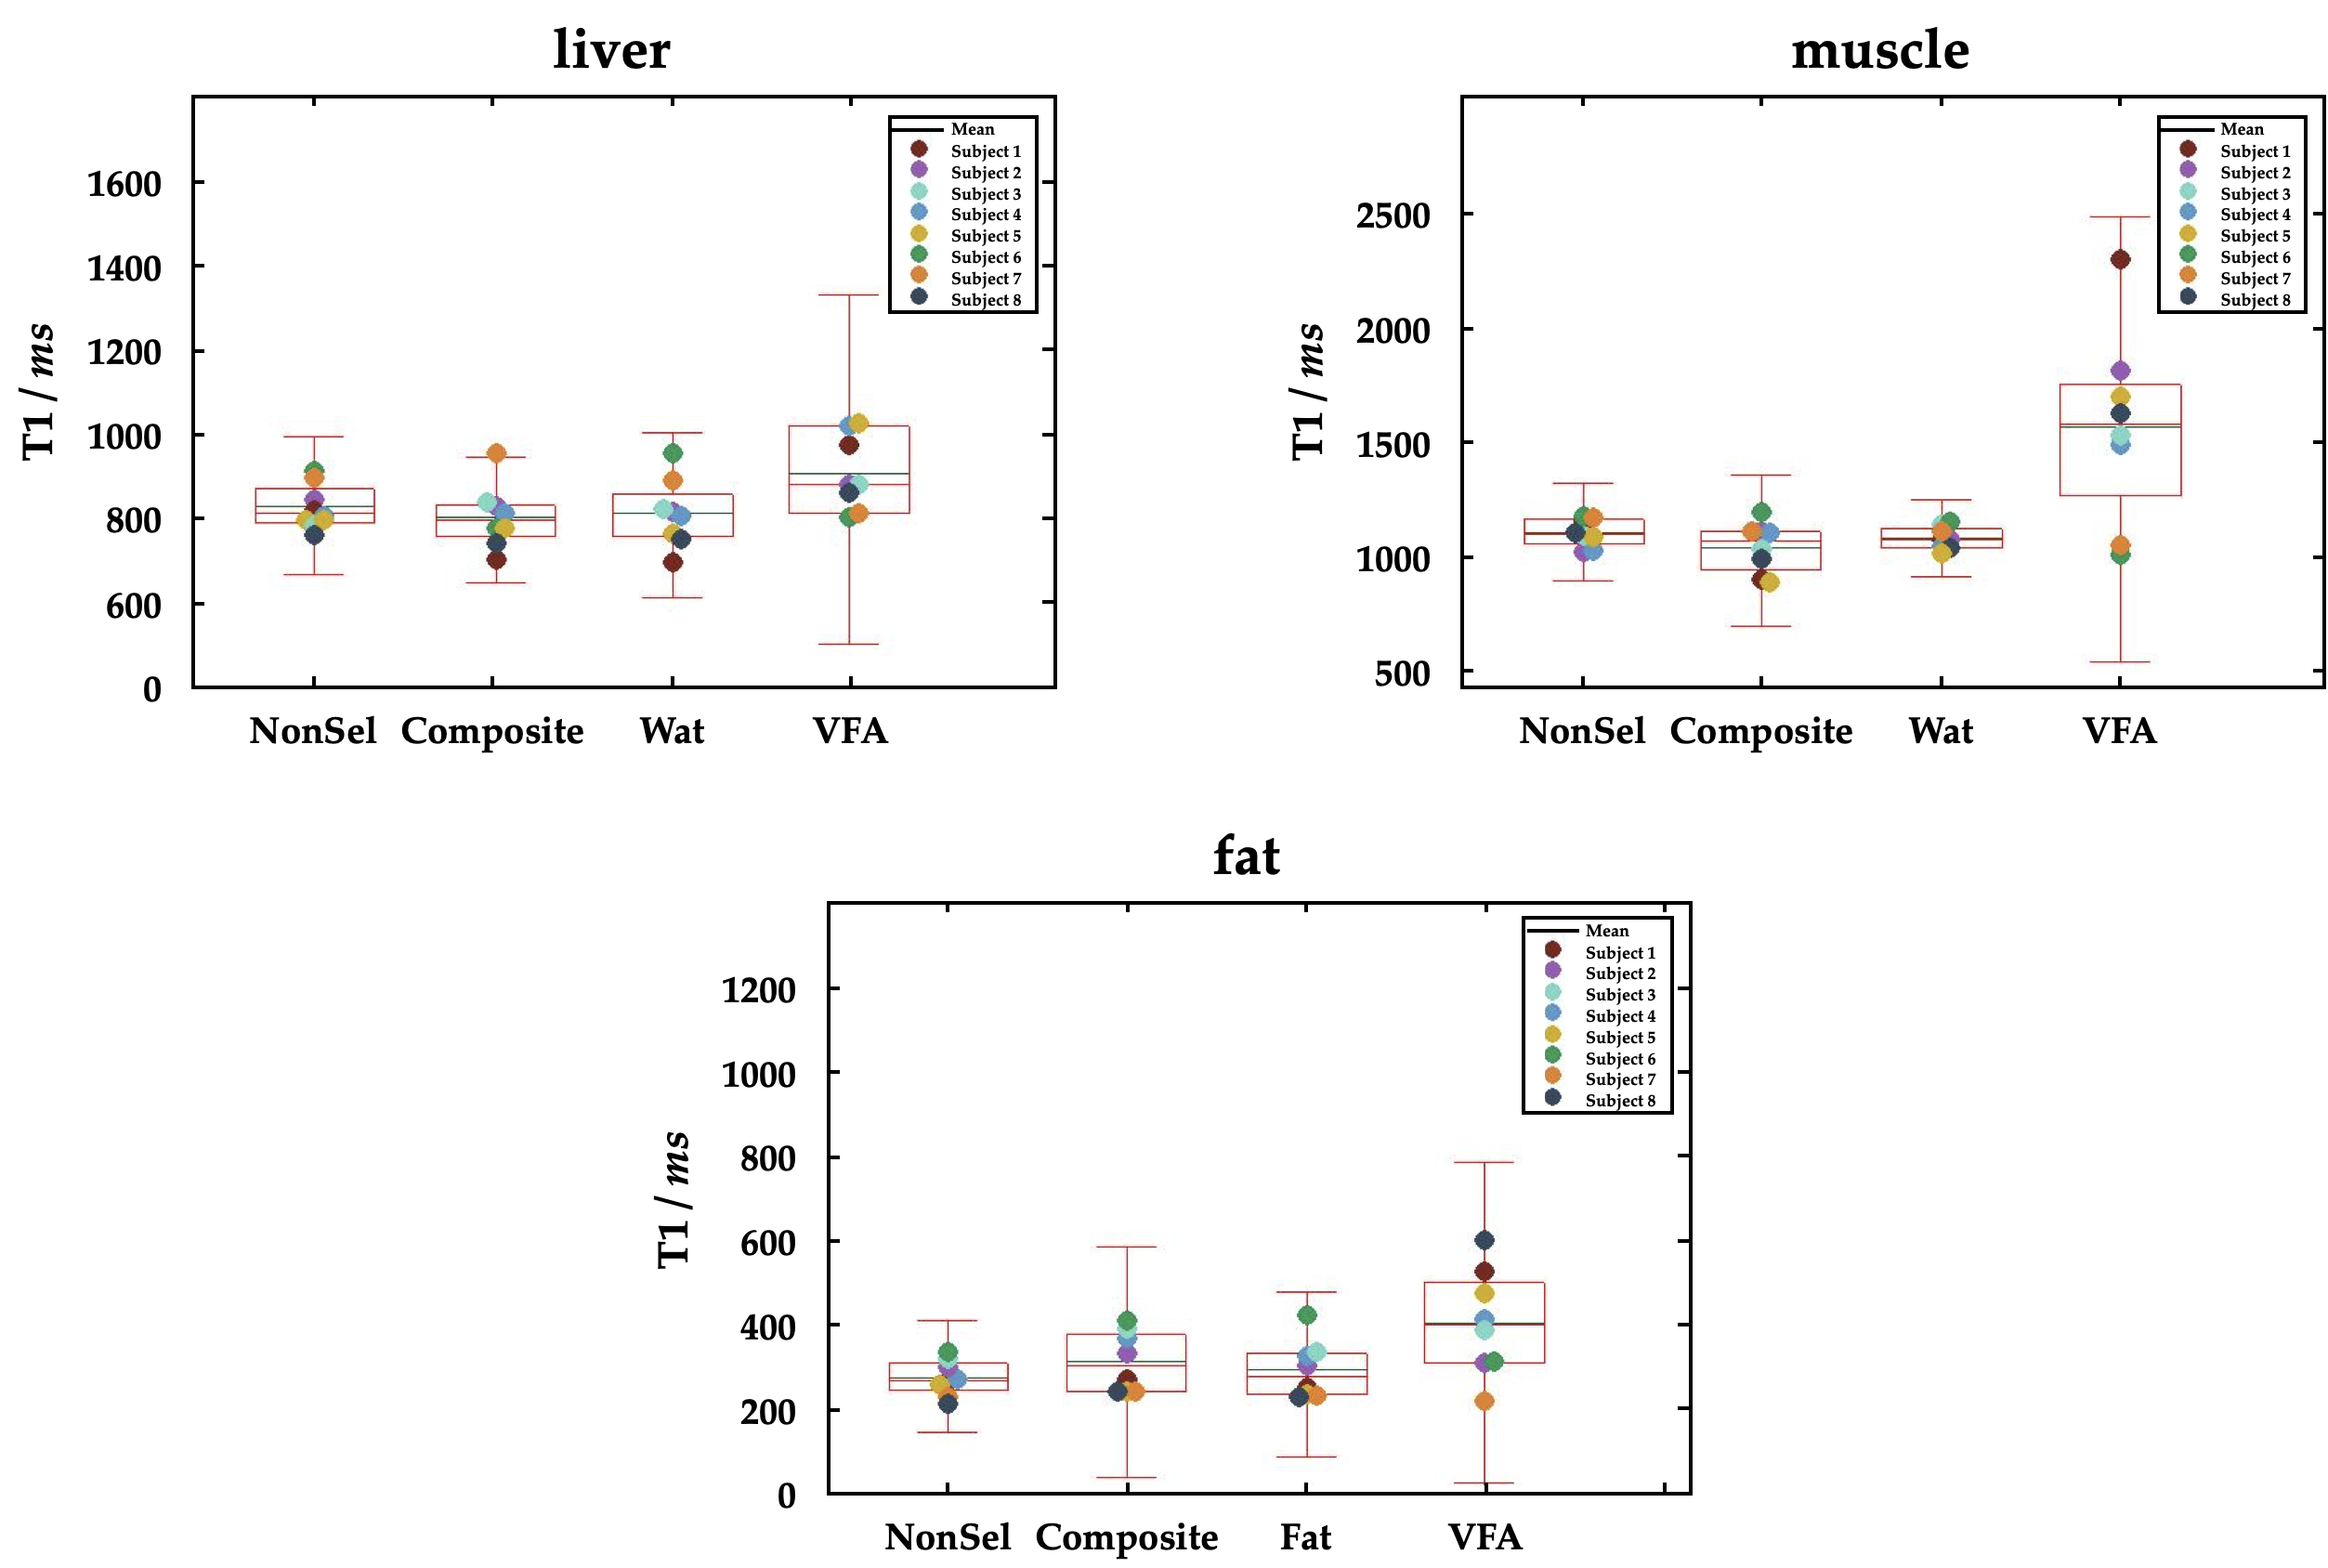
Figure 3: T1 values obtained with non selective and selective excitations of the liver, the back muscles and subcutaneous adipose tissue. These values were compared to those obtained with 2D-VFA sequence (angles = 3°/15°). These graphs reveal the T1 repartition for 8 volonteers and show a good reproducibility.
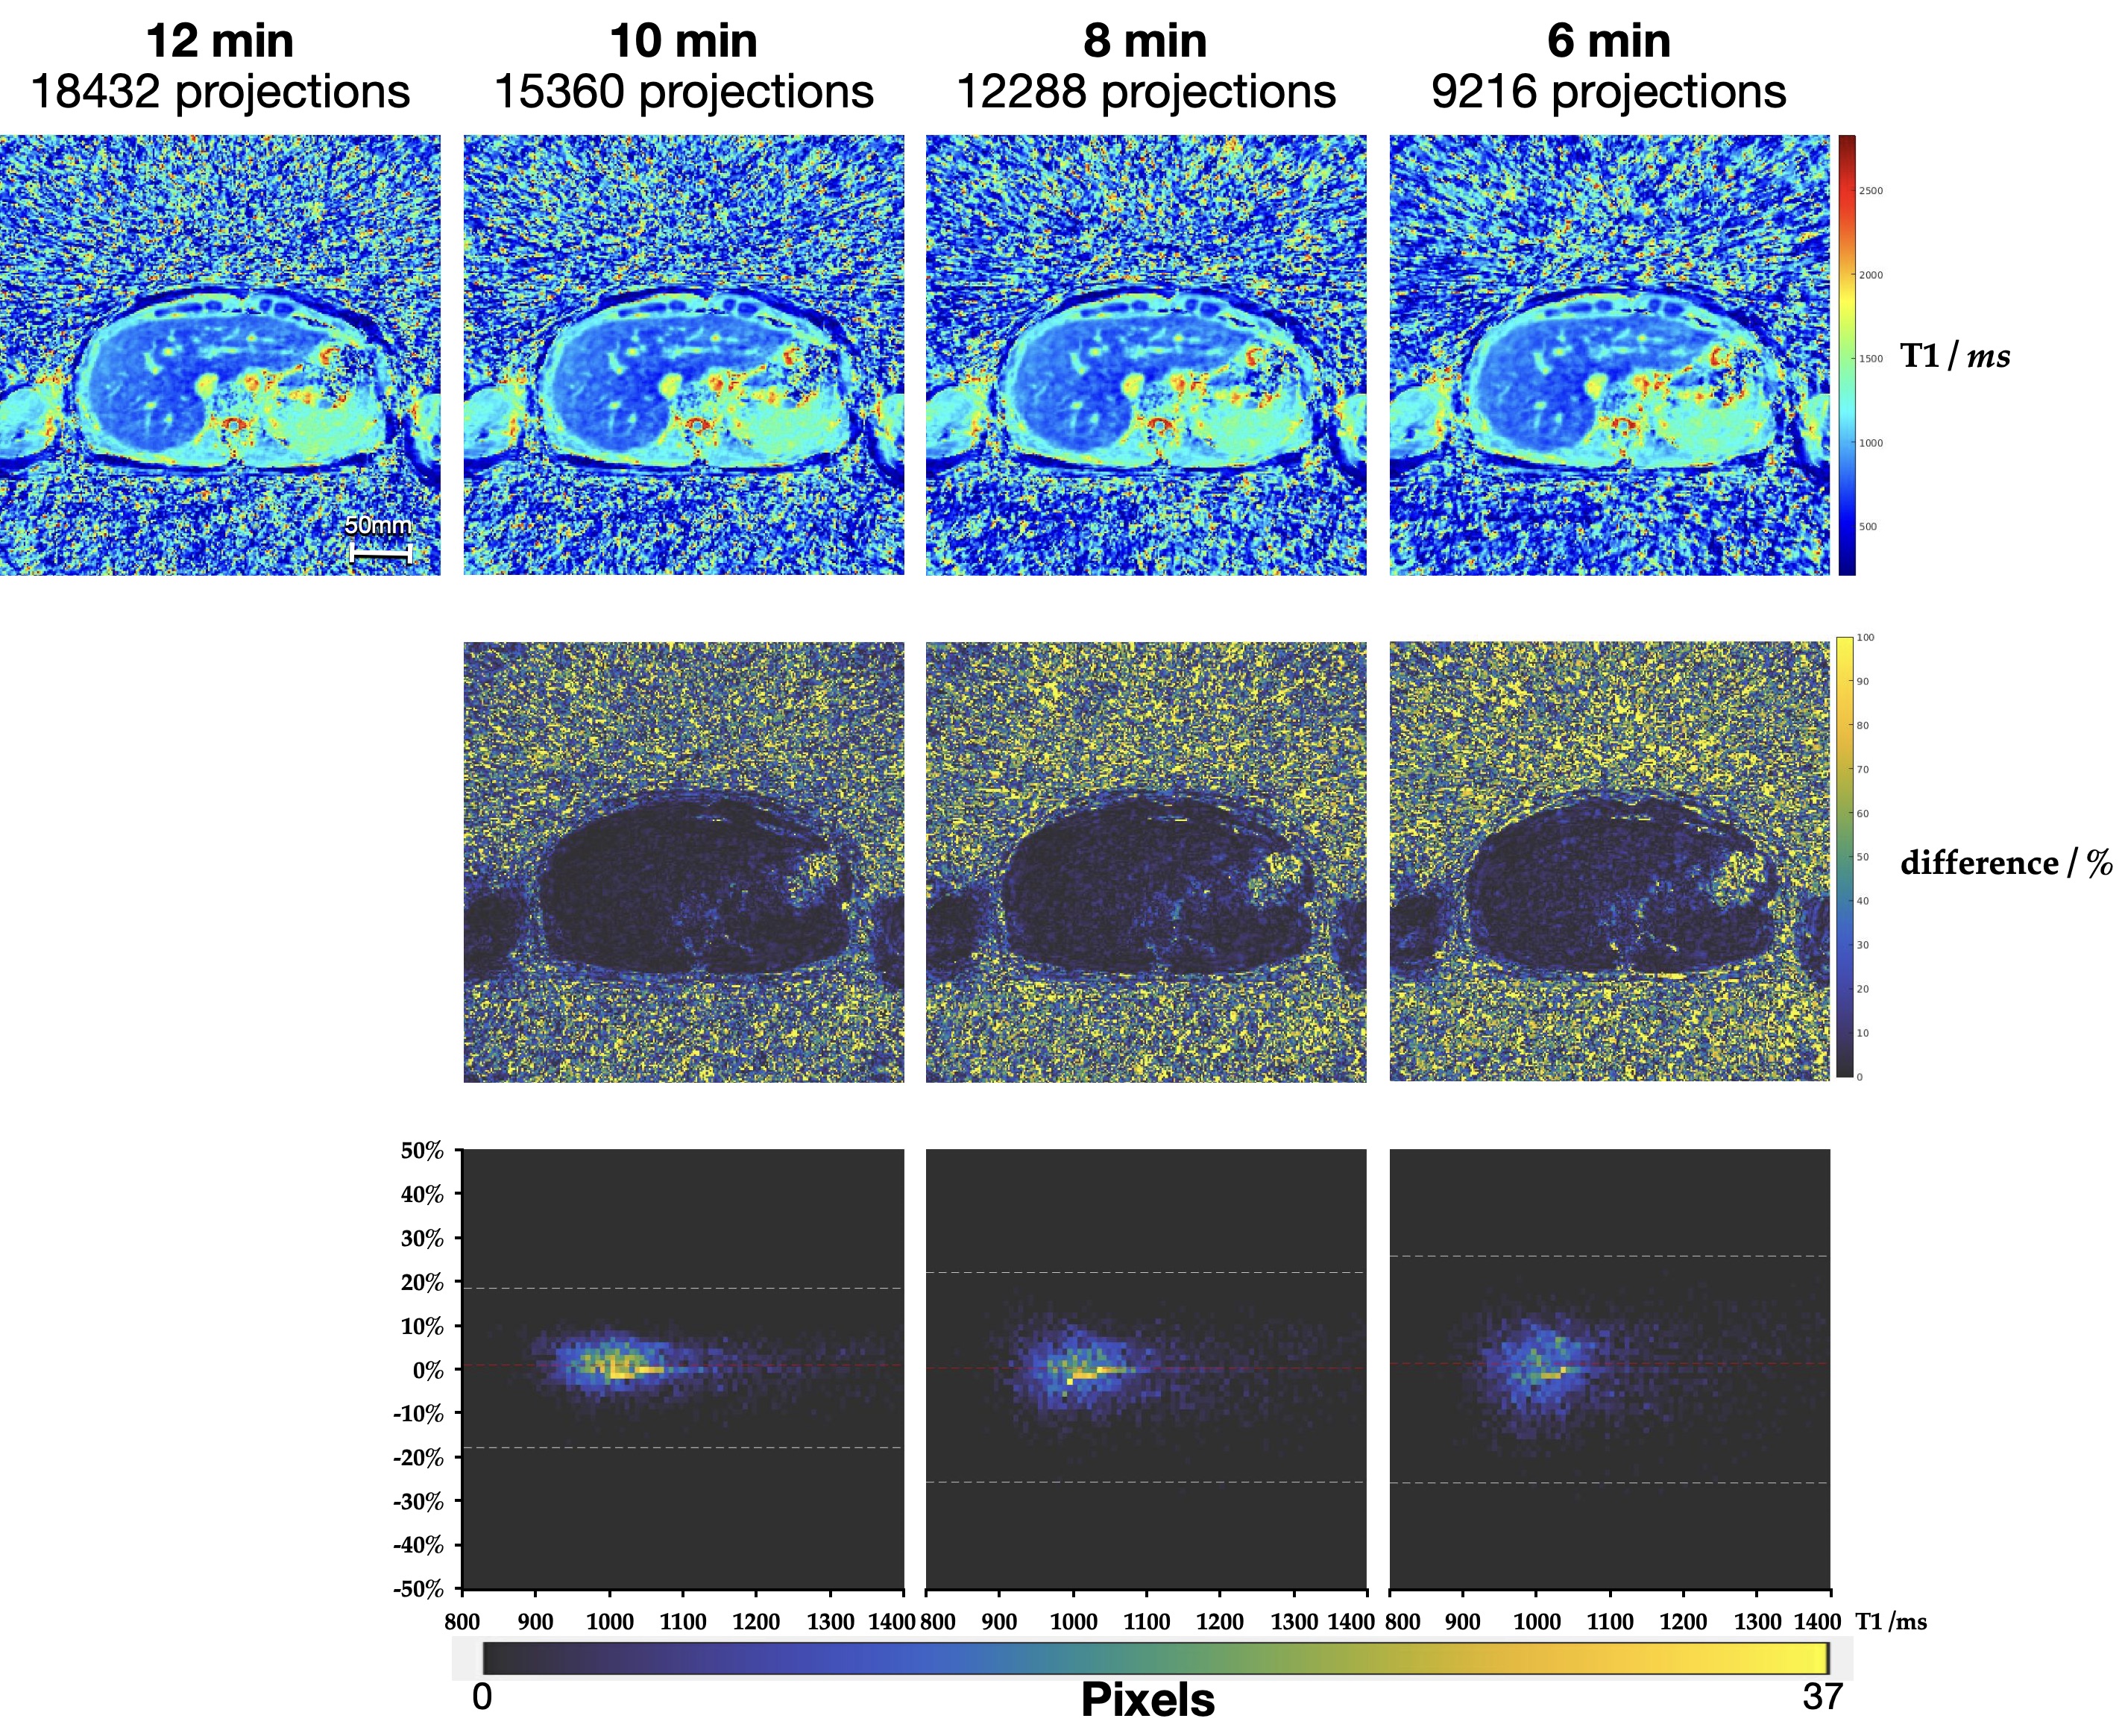
Figure 4: Composite T1-maps were obtained either with all projections, 15360, 12288 and 9216 projections were determined. Differences between these T1-maps reveal that the undersampling does not affect much the quality of the images as shown on the second row. The third row shows the corresponding Bland-Altmann plots. The bias in the T1 values increases from 8 to 18% with 15360 and 9216 projections, respectively.
DOI: https://doi.org/10.58530/2023/0117