0115
Advanced Spatial-Spectral Pulse Design for Metabolite Specific Filtered CEST in the Human Heart1University of California, Berkeley, Berkeley, CA, United States, 2Vanderbilt University, Nashville, TN, United States
Synopsis
Keywords: Pulse Sequence Design, CEST & MT
Chemical Exchange Saturation Transfer (CEST) MRI has been used to probe metabolism via total creatine contrast using conventional contrast generation with Gaussian saturation. We developed a spatial-spectral (SPSP) saturation pulsed CEST protocol to separate the contrast generated by metabolic subcomponents creatine and phosphocreatine (PCr) in phantoms and the human heart (n=10). Phantom studies revealed uniform CEST contrast for creatine and PCr following saturation with Gaussian pulses, and selective PCr contrast following saturation with SPSP pulses. Human studies revealed both enhanced B1-uniformity and selective PCr contrast with SPSP saturation, enabling quantitation of the PCr/total creatine ratio in the myocardium.Introduction
The creatine kinase (CK) system1, and its two primary components of creatine (Cr) and phosphocreatine (PCr), underlie healthy cardiomyocyte function and reflect alterations in mitochondrial generation of ATP. Prior studies in the heart revealed a loss of energetics in diseased myocardium in the form of reduced PCr and ATP. 1H and 31P NMR, the current standards for measuring CK metabolites in vivo, remain limited clinically2. While chemical exchange saturation transfer (CEST) MRI enables CK metabolism mapping3,4, the contrast generated following Gaussian saturation likely originates from amine protons in PCr and Cr and thus is not specific. CEST contrast is dependent on the saturation pulse shape and properties of the targeted molecules including exchange rate5. Spatial-spectral (SPSP) pulses may enable selective targeting of PCr with slow exchanging spins while filtering out the intermediate exchange rate spins in Cr. Here we demonstrate in phantoms and human subjects the ability to obtain CEST contrast maps of either total creatine or only PCr using Gaussian and SPSP saturation methods, respectively.Methods
SPSP pulse design and image analysis methods were performed in MATLAB version 2021b. The SPSP subpulse was designed following previously described methods6 and had the following design constraints: 250 µs maximum duration, 3.8 G/cm maximum gradient amplitude, 10 µs dwell time, and maximum slew rate of 17006 G/cm/s. The subpulse was duplicated to span 36 ms, fit to a Gaussian envelope, and scaled to a peak B1 power of 1.2 µT to create one SPSP pulse.All MRI studies were performed on a Siemens 3 Tesla scanner. Custom phantoms with 50 mM Cr and 50 mM PCr solutions were imaged with a 12-channel receive-only head coil. The solutions were prepared in phosphate buffered saline (PBS) with a measured pH of ~7.5. One phantom was scanned at room temperature and the other was maintained between 35 and 37 ˚C with PureTemp37. Ten healthy subjects were imaged using a body matrix coil and a spine matrix coil (5 female and 5 male, mean age = 29 ± 7 years). Maps of B0 and B1 were acquired in one midventricular slice and used to create individually tailored SPSP pulses as described previously. CEST contrast was generated using 23 saturation pulses (36 ms each, 1.2 µT peak B1 power) followed by a GRE readout. Other scanning parameters included a FOV of 24.3 cm × 30 cm, TR of 1.45 s, and TE of 2.59 ms. A reference scan was taken at 10000 Hz. Frequency offsets ranged between -10 ppm and 10 ppm with denser sampling between 1.8 and 3.0 ppm. Complete spectra were acquired using Gaussian saturation pulses and SPSP saturation pulses. The myocardium was segmented into 6 regions according to the AHA standard7. Each segment was normalized using the reference scan. The resulting z-spectrum was corrected for B0 inhomogeneity using a WASSR correction8. CEST contrast was quantified by performing a 5-pool Lorentzian fitting of Cr, NOE, amide, water, and MT. The corresponding MT, amide, and total creatine maps were created to compare contrast distribution across the myocardium.
Results
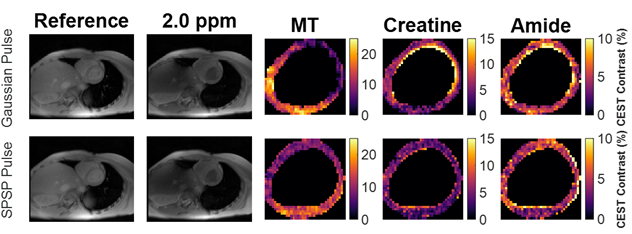
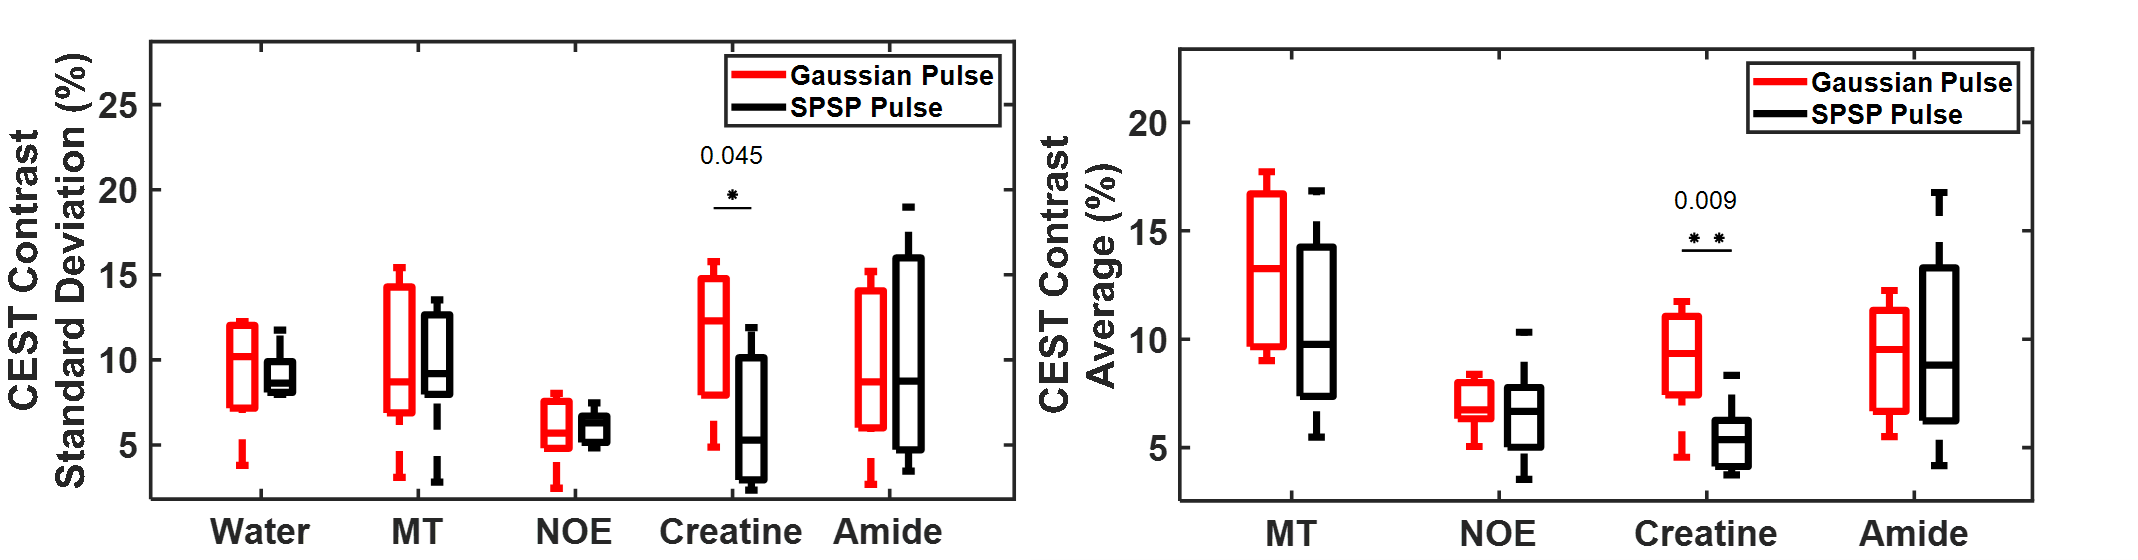
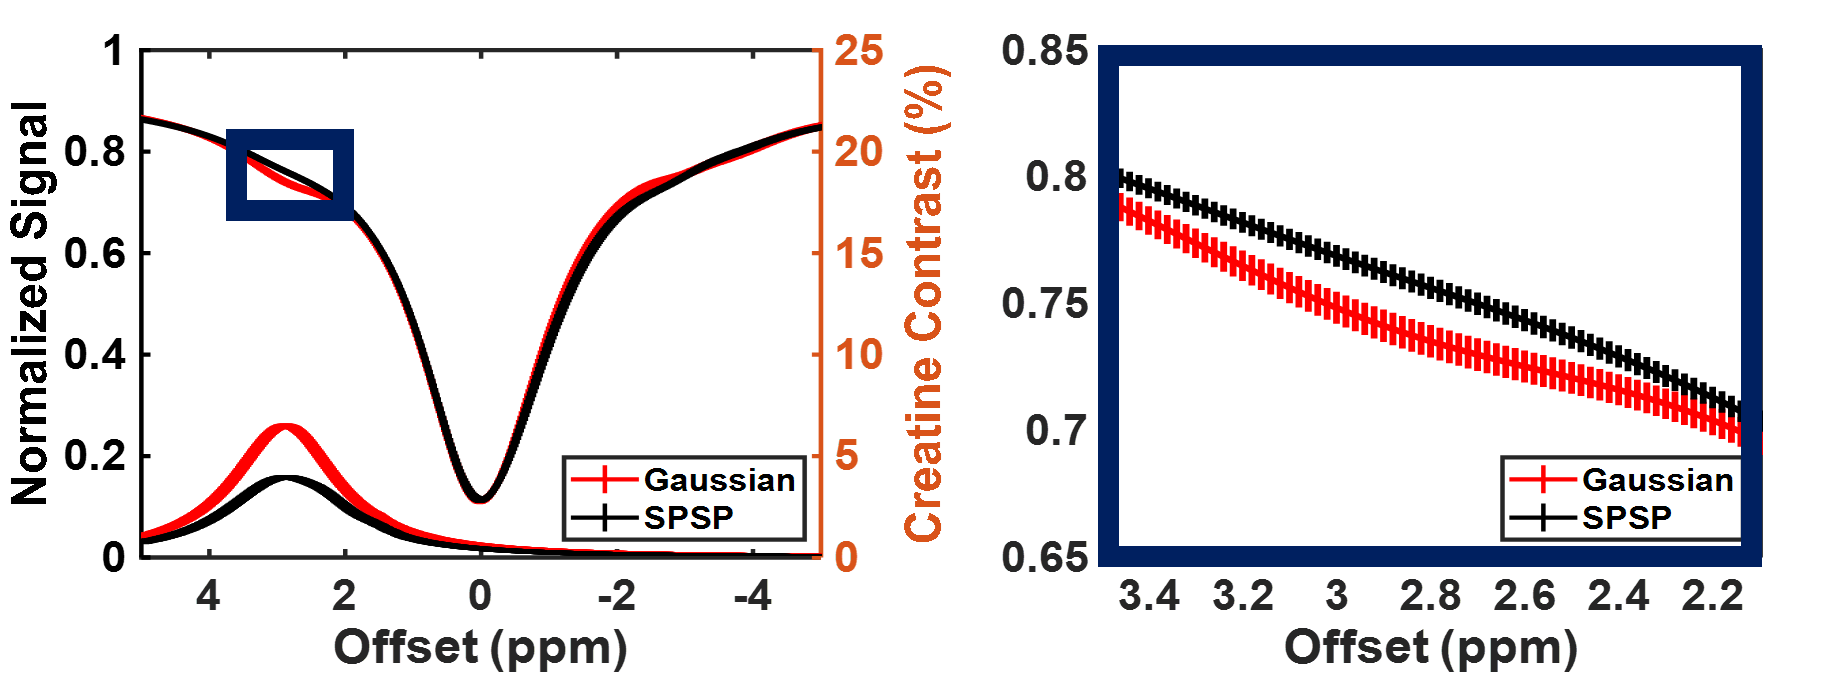
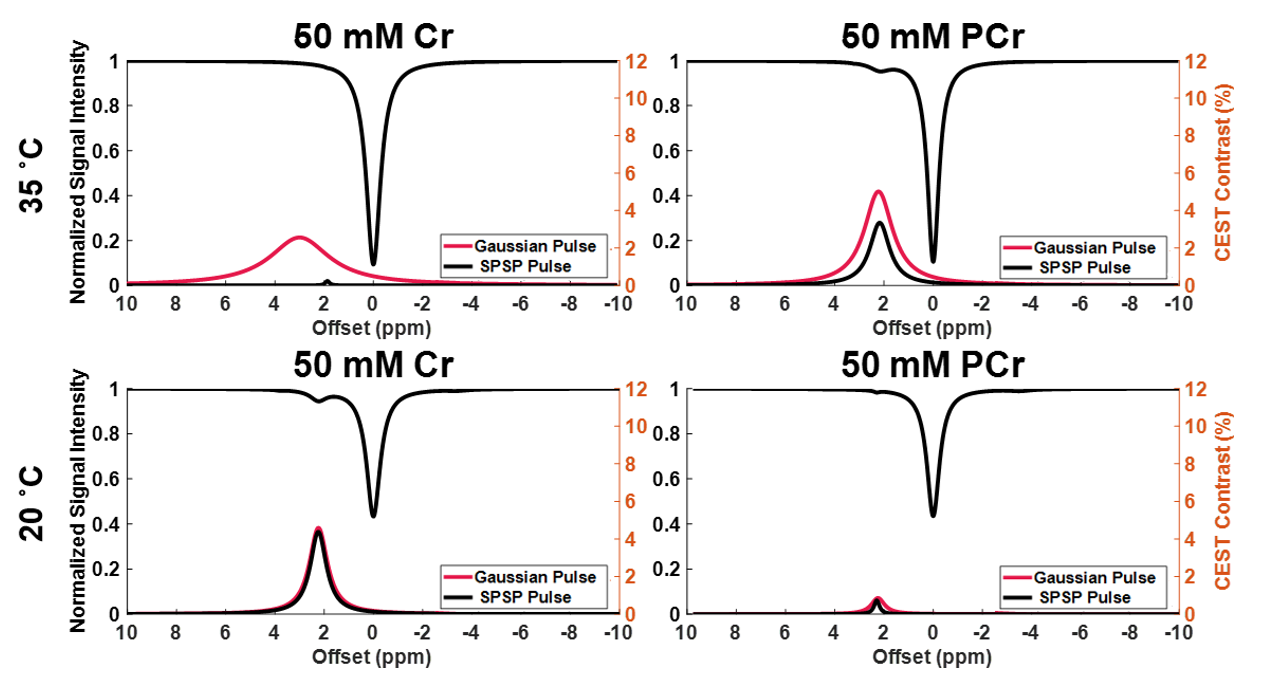
Sample CEST contrast maps are displayed in Figure 1. While most contrasts were similar between saturation pulse shapes, creatine spatial variation was significantly lower using SPSP saturation as shown in Figure 2. To further compare the z-spectra, Figure 3 illustrates all the z-spectra within the 95th percent confidence interval for one individual and highlights the similarity between the two pulse shapes. Between 2 and 3 ppm, a significant reduction of contrast with the SPSP pulse is observed relative to the Gaussian pulse. Finally, the phantom study results are shown in Figure 4, which compares the Z-spectra for Cr and PCr with either pulse type at 20 °C and 35 °C. Although there is no significant difference at room temperature, at 35 °C the detected Cr contrast was reduced from 2.5% to 0.2% whereas the PCr contrast declined from 5% to 3.3% when using the SPSP saturation only.Discussion
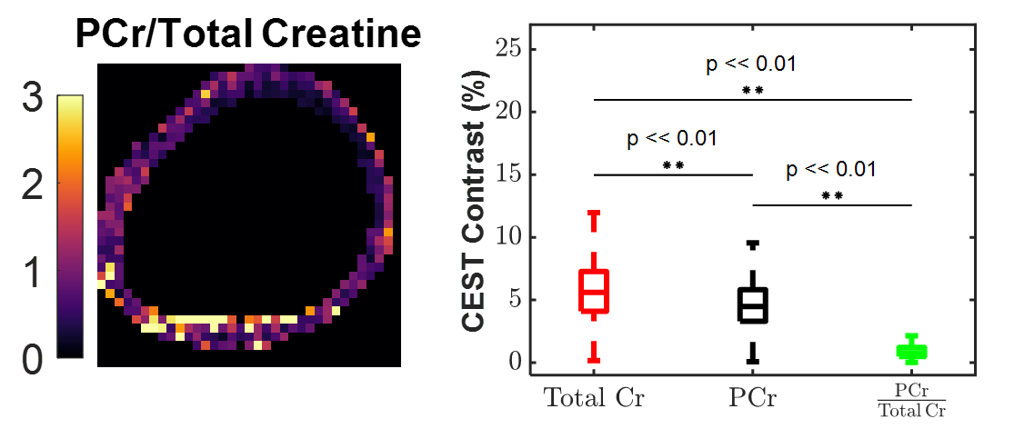
The human cardiac CEST study revealed that SPSP pulses generated significantly lower Cr contrast compared to a conventional Gaussian saturation. When evaluated alongside thermostated phantom studies, these results reveal intrinsic PCr selective contrast generation by the SPSP pulse at body temperature. With the convention that SPSP saturation targets only PCr and Gaussian saturation targets total Cr, ratiometric maps (Figure 5) provide an example of the potential to quantify the ratio of PCr to total Cr using exchange rate filtered CEST. Overall, these results point to a novel method of detecting PCr in vivo and, consequently, quantifying changes in the CK system.Conclusion
This work explored the potential of tracking CK substrate changes via SPSP pulses in phantom and human cardiac CEST studies. At physiological temperature the use of the SPSP saturation pulse targets exclusively the slow exchanging spins of PCr. In contrast, conventional pulsed CEST-MRI that uses Gaussian saturation generates contrast from PCr and Cr. Importantly, non-invasive quantification of PCr would provide direct information about the energy metabolism and function of tissues. Future work will include verifying the exchange rates of PCr and Cr to support that the SPSP pulse is saturating protons of specific exchange rates.Acknowledgements
This study was supported by NIH 1R01HL28592-01, Silvian Foundation Award, AHA19TPA34850040, NIH UH2EB028908-02, DGE 1752814.References
1. Ingwall JS, Kramer MF, Fifer MA, et al. The creatine kinase system in normal and diseased human myocardium. N Engl J Med. 1985;313:1050–1054.
2. Bottomley PA, Hardy CJ. Mapping creatine kinase reaction rates in human brain and heart with 4 tesla saturation transfer 31P NMR. Journal of Magnetic Resonance (1969). 1992;99:443–448.
3. Wu B, Warnock G, Zaiss M, et al. An overview of CEST MRI for non-MR physicists. EJNMMI Phys. 2016;3:19.
4. Haris M, Singh A, Cai K, et al. A technique for in vivo mapping of myocardial creatine kinase metabolism. Nat Med. 2014;20:209–214.
5. Liu G, Song X, Chan KWY, McMahon MT. Nuts and Bolts of CEST MR imaging. NMR Biomed. 2013;26:810–828.
6. Luo H, AlGhuraibawi W, Godines K, et al. Tailored spectral-spatial saturation pulses for spatially uniform saturation in CEST imaging [Internet]. ISMRM 2020.
7. Cerqueira MD, Weissman NJ, Dilsizian V, et al. Standardized Myocardial Segmentation and Nomenclature for Tomographic Imaging of the Heart. Circulation. 2002;105:539–542.
8. Kim M, Gillen J, Landman BA, et al. Water saturation shift referencing (WASSR) for chemical exchange saturation transfer (CEST) experiments: Water Shift Referencing for CEST Imaging. Magn. Reson. Med. 2009;61:1441–1450.
Figures