0114
Development of a Pulse Sequence with Alternating Excitation for Respiratory-Sorted B1+ and B0 Field Mapping in 23Na Human Torso MRI1Medical Physics in Radiology, German Cancer Research Center, Heidelberg, Germany, 2Faculty of Physics and Astronomy, Heidelberg University, Heidelberg, Germany, 3Institute of Radiology, University Hospital Erlangen, Erlangen, Germany, 4Faculty of Medicine, Heidelberg University, Heidelberg, Germany
Synopsis
Keywords: Pulse Sequence Design, Non-Proton, High-Field MRI, Body, 23Na MRI, Field Mapping
23Na MRI is a promising imaging method, but suffers from lower SNR, hence from longer acquisition times and lower image resolution than 1H MRI. Especially in the torso, motion and magnetic field inhomogeneities impede quantitative analysis of 23Na concentrations. To tackle this, a new pulse sequence is presented that yields self-gated respiratory-sorted B1+ and B0 maps from a single measurement. B1+ mapping with the new sequence is less prone to motion artefacts, since k-space projections of two flip angles are acquired in an interleaved manner. This reduces the influence of varying respiration, which can lead to artefacts in conventional mapping.Introduction
Sodium plays an important role in many physiological processes, motivating its quantitative measurement in vivo1. However, 23Na MRI in the torso can be especially challenging due to respiration and B0 or B1 inhomogeneities, for which quantitative 23Na images should be corrected.This study presents a pulse sequence that enables self-gated respiratory-sorted B0 and B1+ mapping from a single measurement based on the phase difference2 and double angle methods (DAM)3. To reduce the influence of varying respiratory motion, the k-space projections of two flip angles are acquired in an interleaved manner. The obtained maps can be applied to correct for B0 and B1+ field inhomogeneities in quantitative 23Na MRI. A comparison between B0 and B1+ maps acquired with the new sequence and conventional mapping is performed in a respiratory phantom and the human torso.
Methods
Alternating excitation with 45° and 90° pulses was implemented in a 3D density-adapted radial sequence4 with a double-echo readout and a golden angle distribution of projections5 (schematic sequence diagram in Fig. 1A). Further, each projection acquires two samples in the k-space center to extract the respiratory motion6 via an ADC shift of two dwell times.All measurements were performed on a 7T whole-body MR scanner7 with a 4-channel oval-shaped birdcage 23Na coil6.
To evaluate the general applicability of the new sequence, B0 and B1+ maps were obtained using the phase difference method and the DAM3 in a stationary respiratory phantom and compared to a reference (three measurements with: 1. 45°, TE1; 2. 90°, TE1; 3. 90°, TE2). The phantom (25mM NaCl) has a hole through its length, in which a smaller phantom (58mM NaCl)8 was inserted. The smaller phantom was placed in two different positions to simulate two discrete positions within a breathing cycle. In a second step, the small phantom was moved by hand in the rhythm of the mover’s own respiratory frequency to simulate respiratory motion to test the sequence under moving conditions. Additionally, an in vivo measurement was performed in a healthy volunteer (female, 32 years).
Parameters (phantom): TE1/TE2=1.65ms/7.6ms, TR=300ms, tpulse=3ms, nominal resolution: (17mm)³, number of projections N=1150, acquisition time=11.5min, dwell time=13µs.
Parameters (in vivo): TE1/TE2=1.65ms/7.6ms, TR=300ms, tpulse=3ms, nominal resolution: (17mm)³, number of projections N=1550, acquisition time=15.5min, dwell time=13µs.
Relative B1+ maps were determined with the DAM3 from the data of the first echo after the 45° and the 90° excitation, respectively. With the data from both echos (TE1, TE2) after the 90° excitation, a B0 map was calculated (Fig. 1B). For each measurement the respiratory signal was calculated by using the two datapoints at the k-space center of each projection6 (Fig. 2). All projections were sorted into two respiratory-sorted subsets depending on whether the respiratory signal of each projection was ≤0 or >0. These data subsets were reconstructed with a NUFFT9 and subsequently used to calculate the B0 and B1+ maps.
Results
23Na MR images, B0 maps and relative B1+ maps of the stationary phantom are shown for the new mapping sequence in Fig. 3A+B with their corresponding reference. Maps for the new sequence and the reference are in good agreement in the stationary case (Fig. 3C).In Fig. 4 B0 and B1+ maps are shown that were generated from the 23Na images of the moving phantom measured with both the new sequence and reference. The unsorted maps of the new sequence and the reference show similar field distributions, while the sorted B1+ maps of the reference show (contrary to the new sequence) a slight deviation from the classical birdcage B1+ distribution (compare Fig. 3B). B0 and B1+ maps in breathing state 1 measured with the new sequence show better agreement with the stationary maps in state 1 (Fig. 3B/4) than the reference.
Comparing the relative B1+ maps of the new mapping sequence and the reference in vivo (Fig. 5), all maps (sorted/unsorted) show similar distributions for the new sequence, whereas in the reference the sorted maps differ from the unsorted.
Discussion and Conclusion
Self-gated respiratory-sorted B0 and B1+ mapping from a single measurement was shown to be feasible. Respiratory-sorted relative B1+ maps of the reference show a greater deviation from the classical birdcage pattern than those measured with the new sequence. Additionally, the respiratory-sorted B0 and B1+ maps of the new sequence in the moving respiratory phantom have a higher correspondence with the stationary images of the phantom, and the sorted in vivo B1+ maps with the unsorted map. This is due to the advantageous timing of the new sequence: With the new sequence the same k-space projection needed for the B0 and B1+ maps is acquired for each projection in ≤300ms, whereas in the reference this time difference (≥5min 45s) is much higher (Fig. 1B). While the breathing state (exhaling/inhaling) is likely to be the same or at least similar within 300ms, it is presumable that the depth of inhalation and exhalation will change over 5min 45s. Therefore, the MR images of the different breathing states used to determine the field maps have a higher correspondence with each other when measured with the new sequence. Thus, the new mapping sequence reduces the influence of varying respiration that could lead to artefacts in conventional mapping.Acknowledgements
No acknowledgement found.References
1. G. Madelin and R.R. Regatte. Biomedical applications of sodium MRI in vivo. Journal of Magnetic
Resonance Imaging, 38(3), 511-529
(2013)
2. M. A. Bernstein, K. F. King and X. Joe Zhou. Handbook of MRI Pulse Sequences (2004)
3. E.K. Insko and L. Bolinger. Mapping of the Radiofrequency Field. Journal of Magnetic Resonance. Series A 103, 82-85 (1993)
4. A. M. Nagel et al. Sodium MRI Using a Density-Adapted 3D Radial Acquisition Technique. Magnetic Resonance in Medicine 62:1565–1573 (2009)
5. R.W. Chan, E.A. Ramsay, C.H. Cunningham and D.B. Plewes. Temporal stability of adaptive 3D radial MRI using multidimensional golden means. Magnetic Resonance in Medicine 61: 354-363. https://doi.org/10.1002/mrm.21837 (2009)
6. T. Platt et al. In vivo self-gated 23Na MRI at 7T using an oval-shaped body resonator. Magnetic Resonance in Medicine 2018; 80:1005–1019 (2018)
7. MAGNETOM 7T, Siemens Healthcare, Erlangen, Germany
8. L. Leiner. Bachelor’s thesis - Planung und Umsetzung eines Phantoms für die MR-geführte Therapie. Heidelberg University (2017)
9. J. A. Fessler and B. P. Sutton. Nonuniform fast Fourier transforms using min-max interpolation. IEEE Transactions on Signal Processing. Vol. 51, no. 2, pp. 560-574. doi: 10.1109/TSP.2002.807005 (2003)
10. G. Yuan, N. A. Drost and A. McIvor. Respiratory rate and breathing pattern. McMaster Univ. Med. J. Vol. 10, no. 1, pp. 23–28 (2013)
Figures
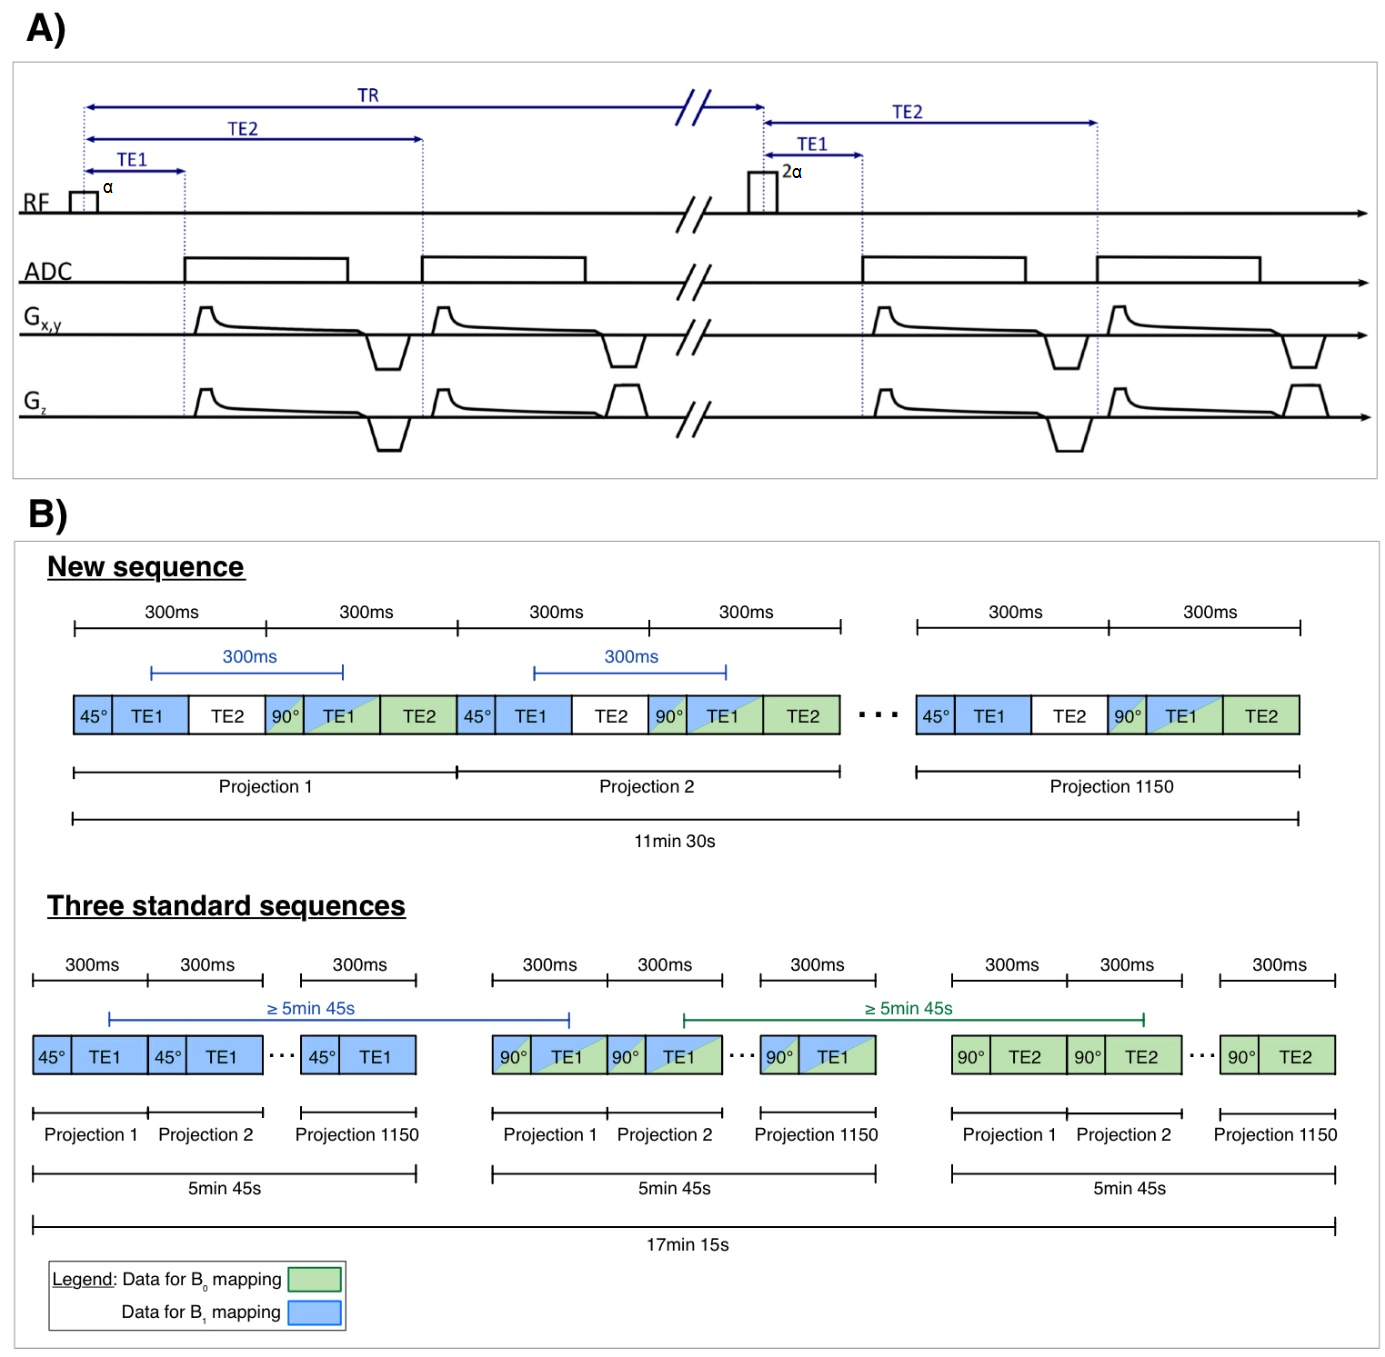
Figure 1:
A) Density-adapted radial pulse sequence with alternating excitation by pulses with flip angle α and 2α, a double-echo readout and an ADC shift for all echos.
B) Schematic illustration of the new sequence (here: α =45°, 2α=90°) and three standard sequences used as reference. In the new sequence the same radial projection needed for determining B0 and B1+ maps is acquired within 300ms (thus likely to still be in the same or at least similar breathing state, as on average one ex- or inhalation each takes 2s10), whereas in the reference this time difference is much larger with 5min 45s.
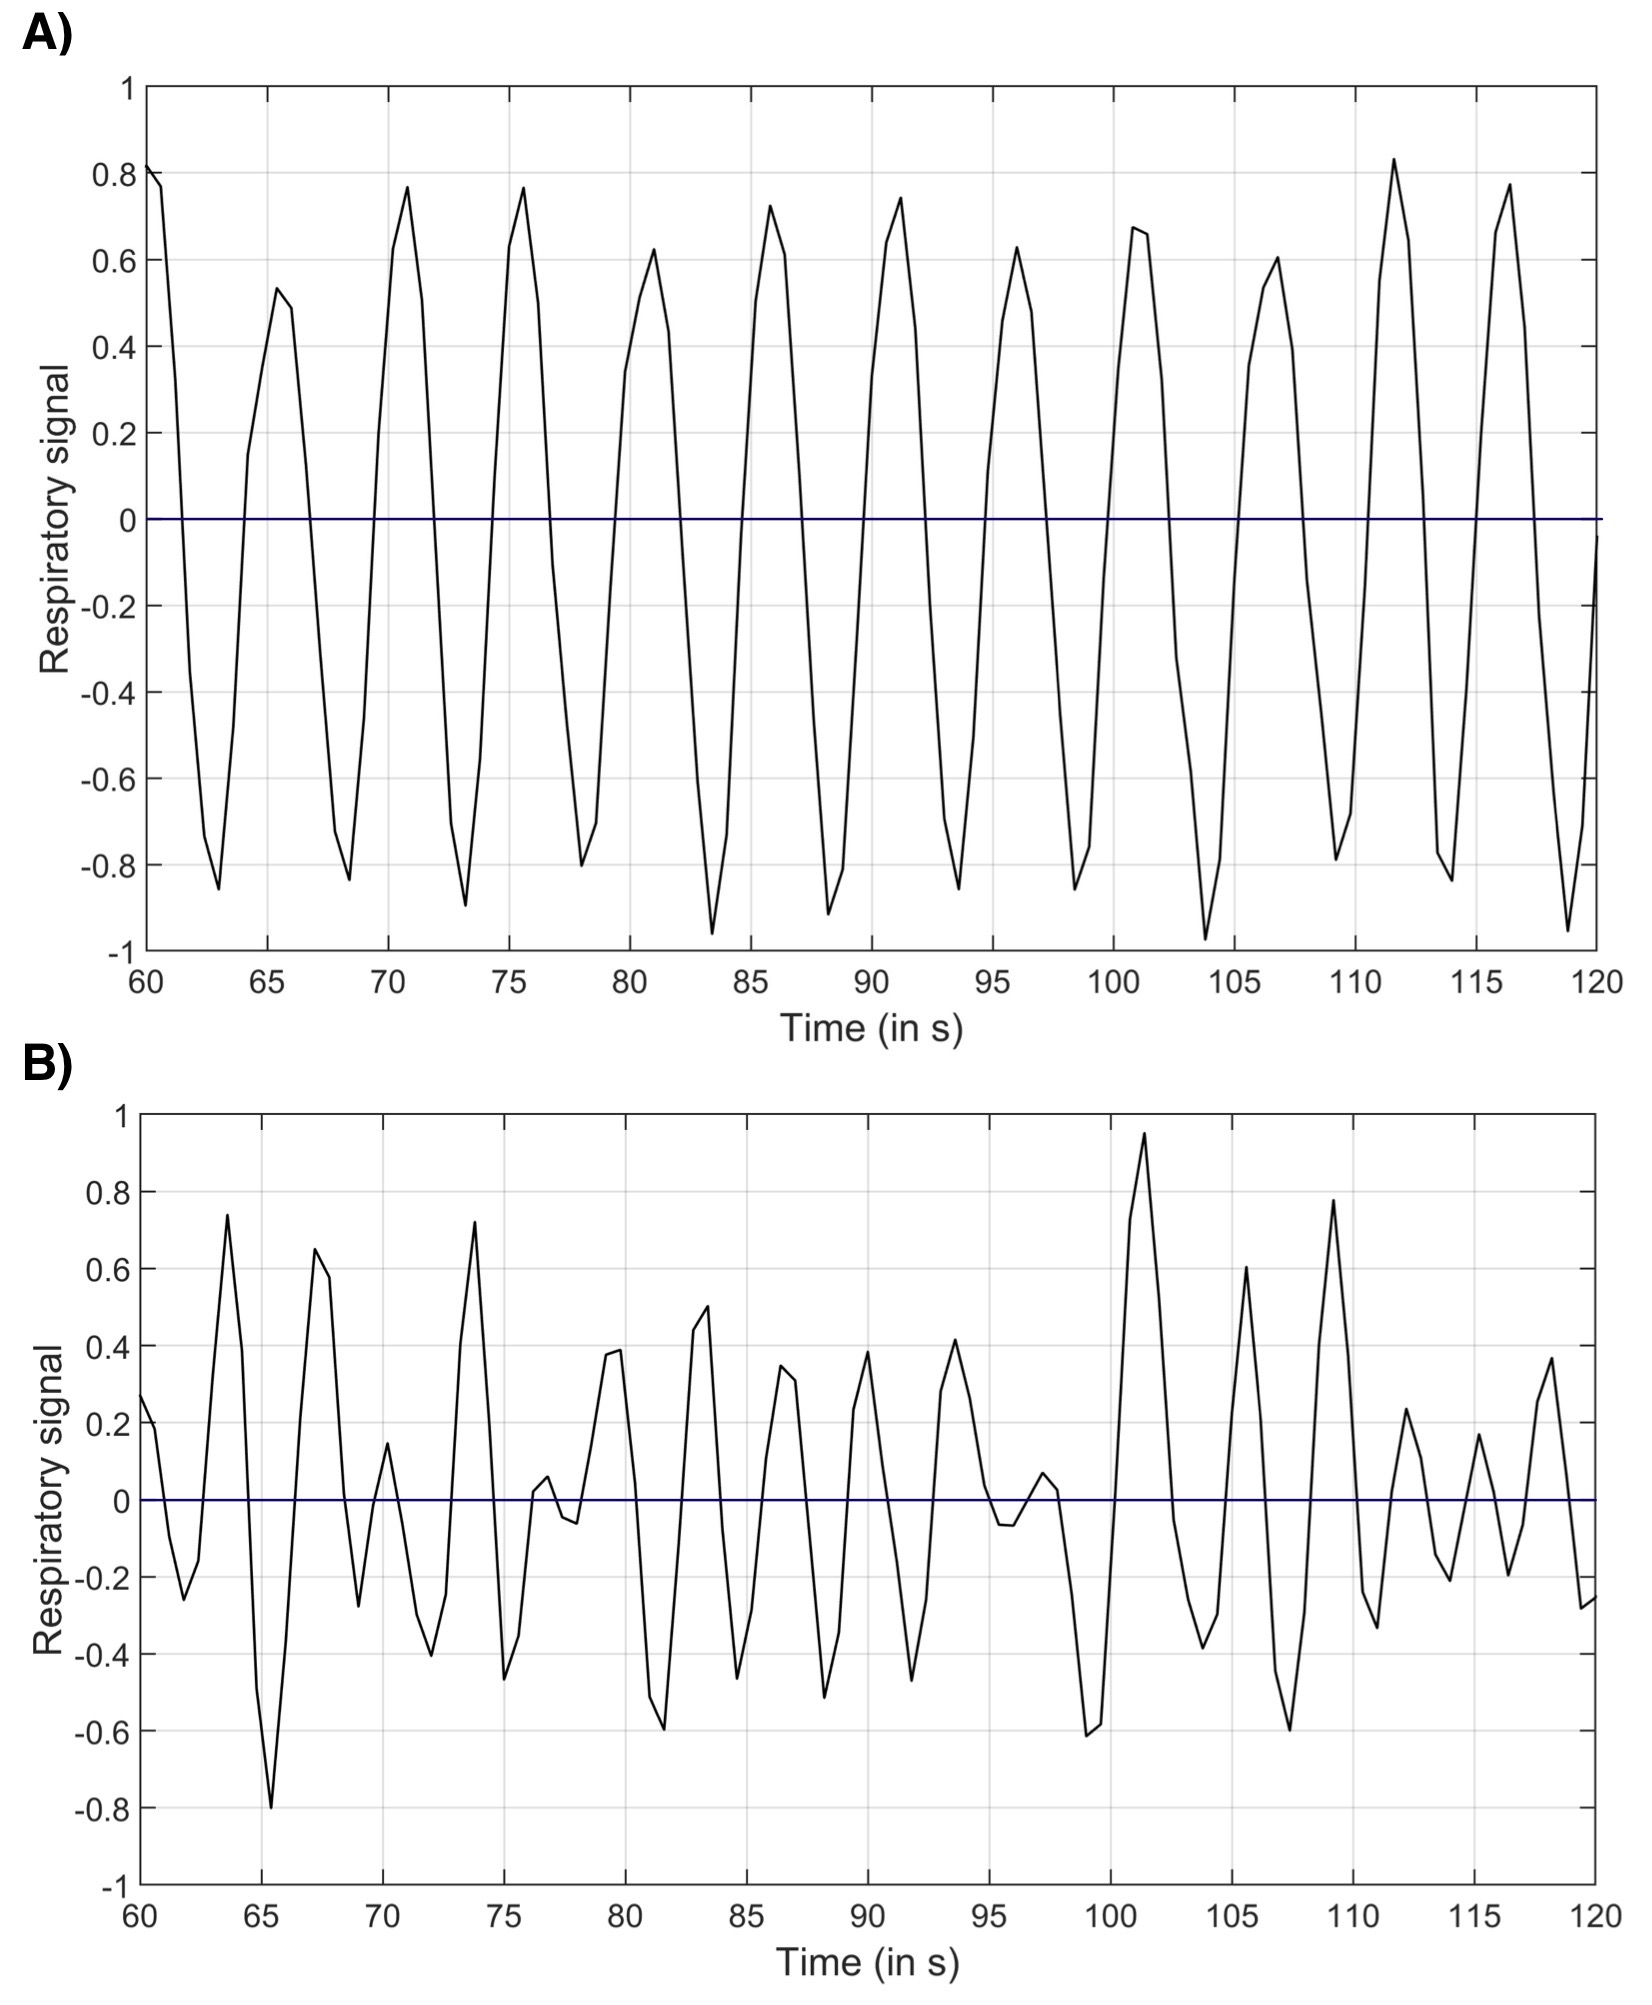
Figure 2:
A) Excerpt from the graph of the phantom’s respiratory signal, which was simulated by motion of the small phantom by hand in the rhythm of the mover’s own respiratory frequency. The time of one breathing cycle (inhaling + exhaling) was on average 5s.
B) Excerpt from the graph of the in vivo respiratory signal. The time of one breathing cycle is in a range of 3s to 4.8s (on average 3.6s). The duration of the breathing cycles is in the range known from literature10.
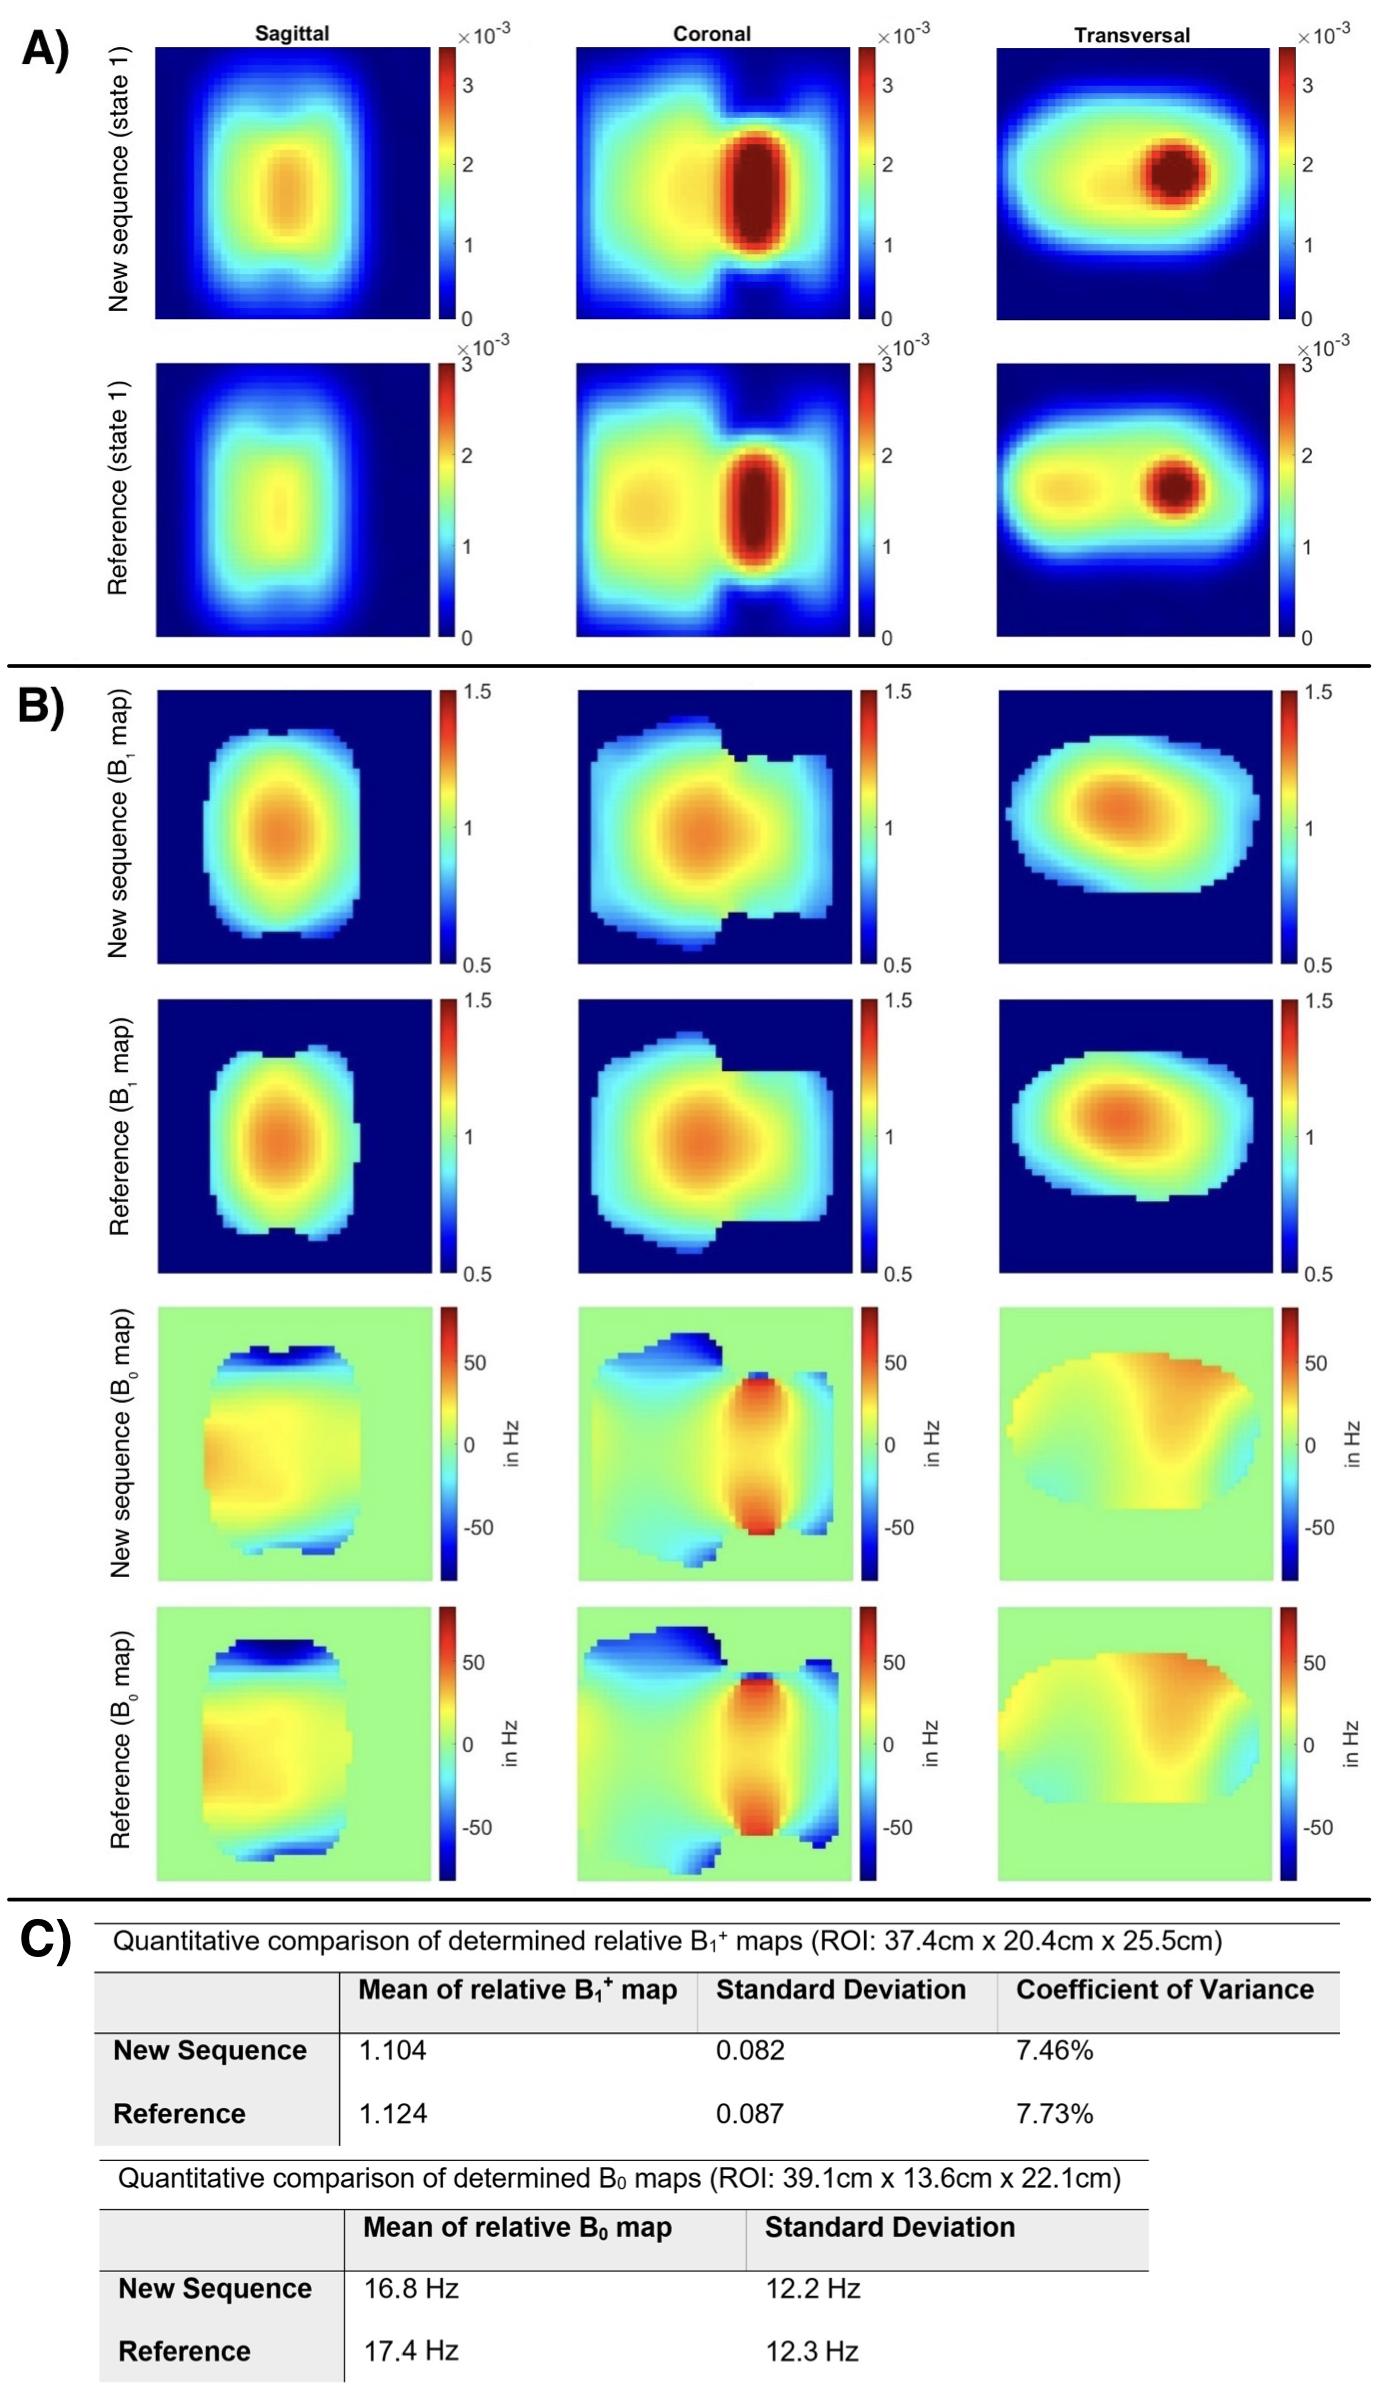
Figure 3:
A) 23Na images (90°, TE1) of the stationary
respiratory phantom (reconstructed FOV=(360mm)3, zero filling
factor=2). The smaller movable phantom (high signal) was placed in breathing state 1. No motion was present during the acquisitions.
B) B0 and relative B1+ maps of the new sequence and its reference determined from the stationary MR images of breathing state 1 from A).
C) Quantitative comparison of determined maps (B0 distribution between -83Hz to 83Hz). Results for reference and the new sequence are in good agreement in the stationary case.
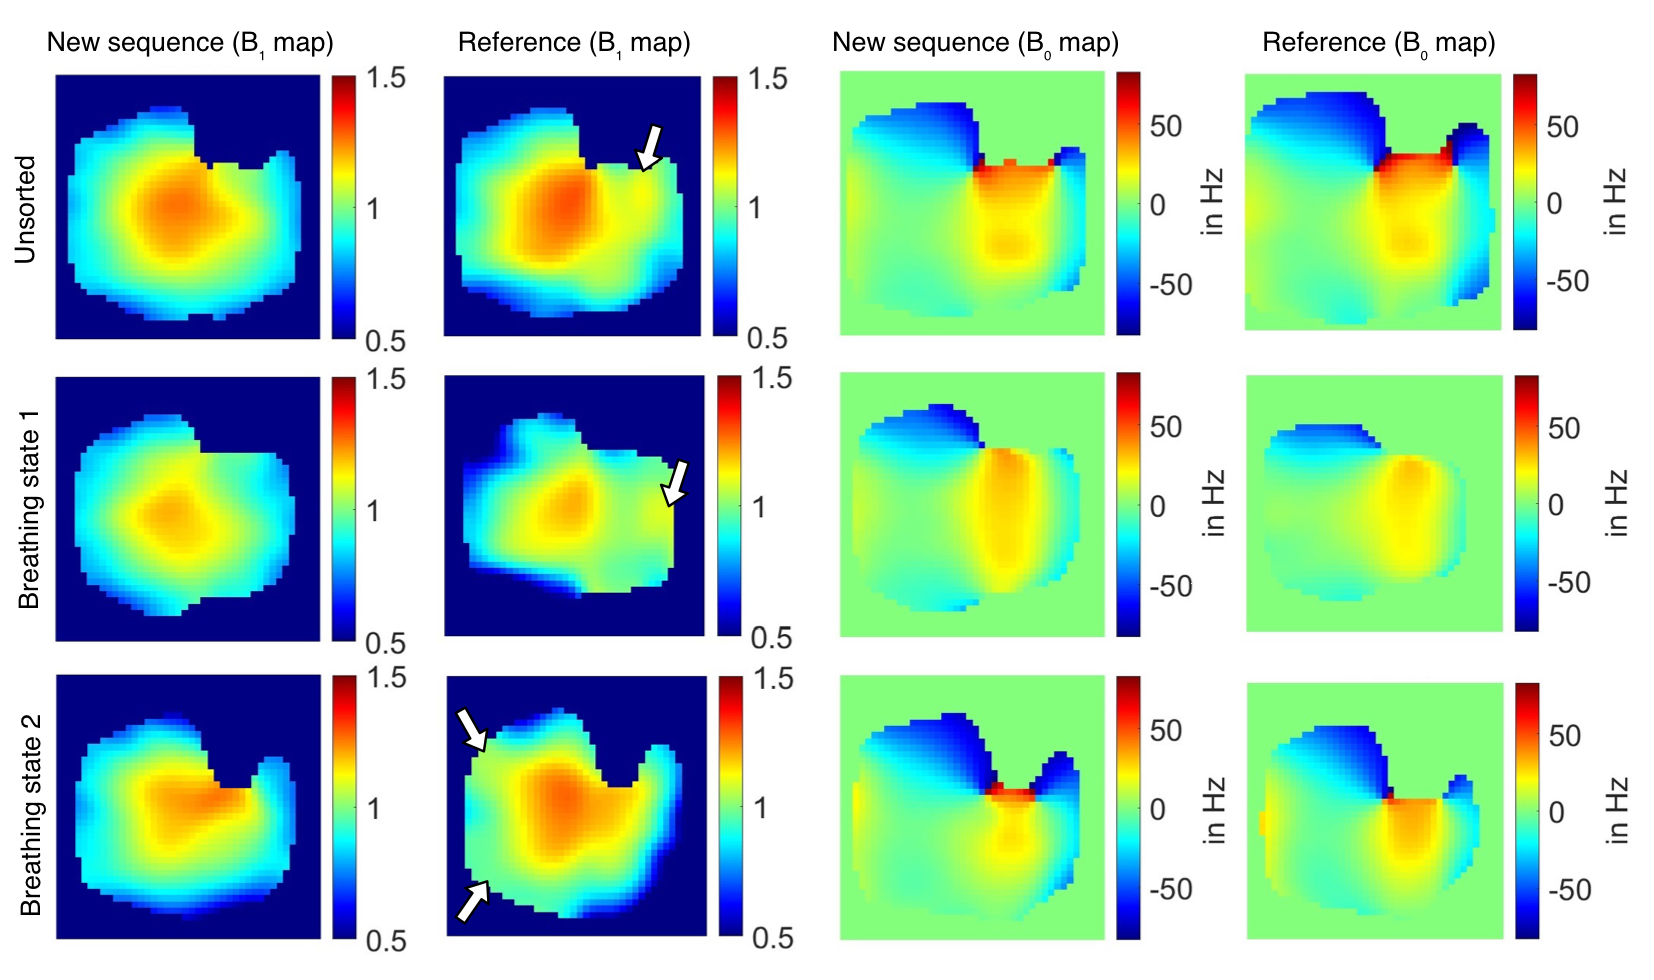
Respiratory-sorted and unsorted B0 and relative B1+ maps (coronal plane) generated from the 23Na images of the moving respiratory phantom measured with the new sequence and the reference (reconstructed FOV=(360mm)3, zero filling factor=2). Relative B1+ maps of the reference show slight deviation from the classical birdcage B1+ distribution (white arrows). A classical birdcage B1+ distribution is characterized by high values in the centre and lower values closer to the margins of the FOV, as it can be seen in Fig. 3B.
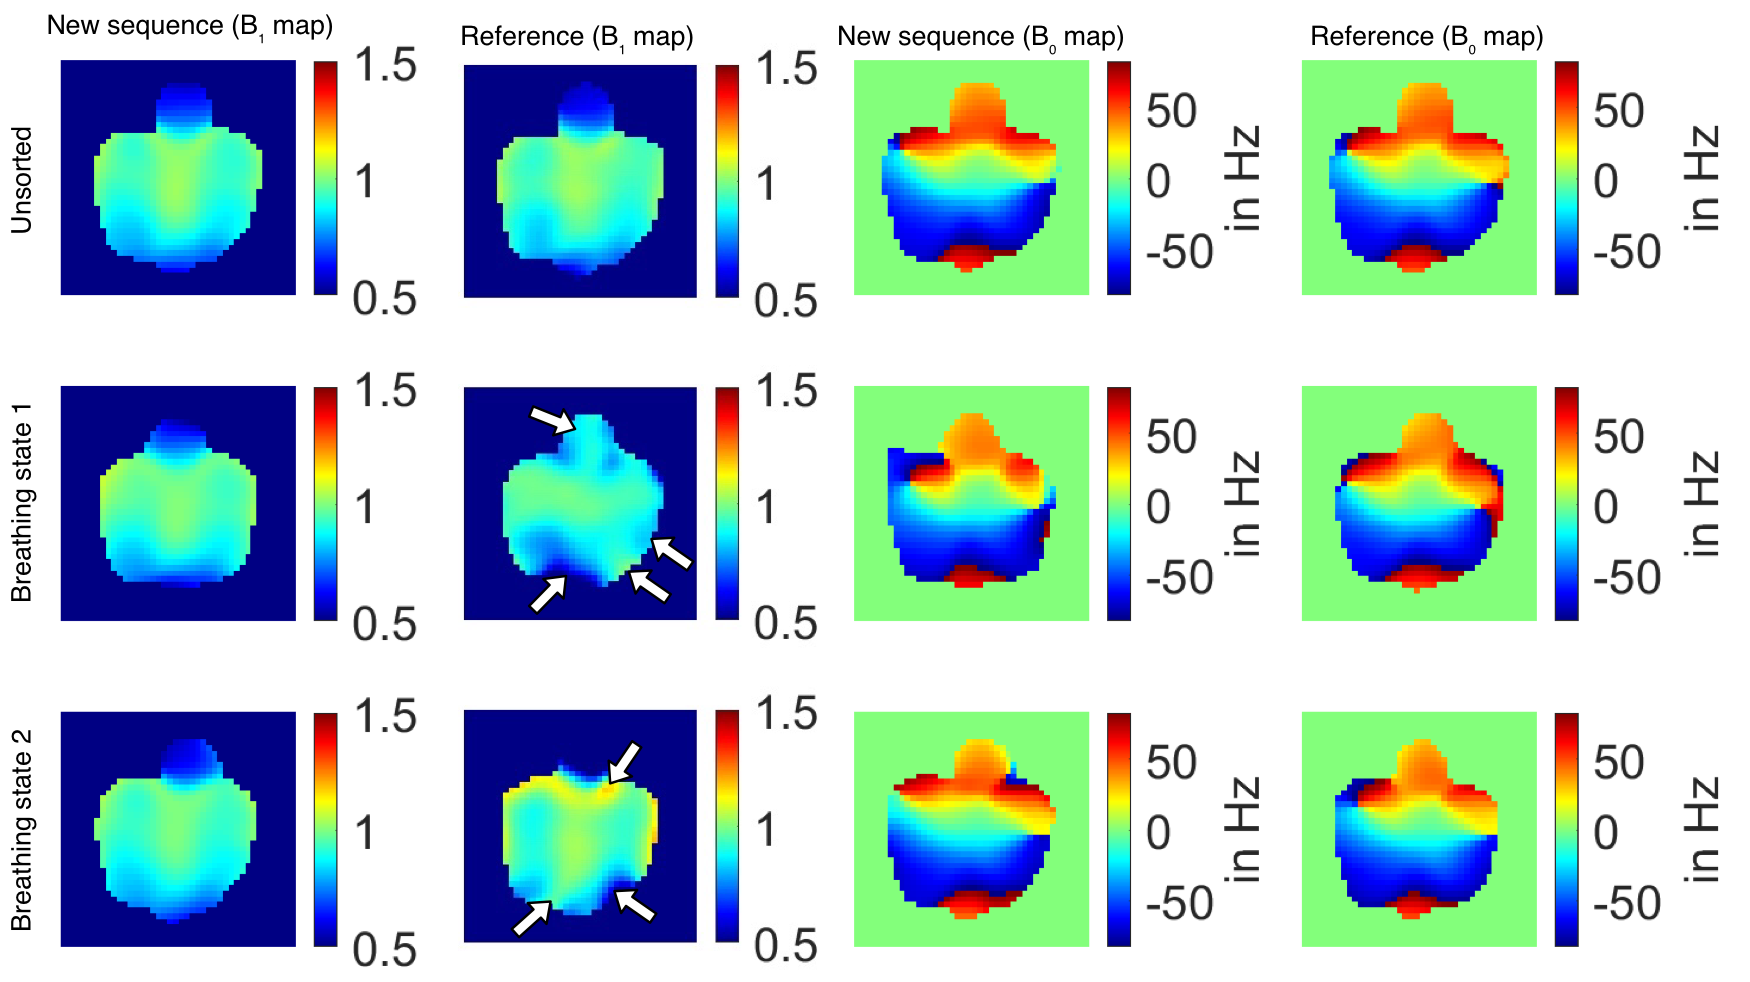
Figure 5:
Respiratory-sorted and unsorted B0 and relative B1+ maps (coronal plane) measured in a healthy volunteer (female, 32 years) using the new sequence and the reference (reconstructed FOV=(360mm)3, zero filling factor=2). For the new sequence the unsorted and sorted B1+ maps are similar, whereas the sorted B1+ maps of the reference slightly differ from the unsorted maps (white arrows).