0113
Fast localized calibration for spatial-spectral excitation without fly-back gradients1Department of Radiology, Johns Hopkins University School of Medicine, Baltimore, MD, United States, 2Department of Cardiology, Johns Hopkins University School of Medicine, Baltimore, MD, United States
Synopsis
Keywords: Pulse Sequence Design, RF Pulse Design & Fields, calibration, localized calibration, spectral-spatial, fat suppression
Spiral MRI requires fat suppression because fat and other off-resonant spins are blurred. For fast cardiac spiral MRI at 3T, spectral-spatial water-only excitation is often used. Standard spectral-spatial pulses apply a fly-back gradient, limiting how thin the slices can be (>4mm). Without fly-back gradients slices can be as thin as ~1.7mm, but require a phase calibration for the radiofrequency sub-pulses with inverted gradients due to system imperfections. Here we propose and test a fast (<1s), localized pre scan enabling thin-slice water only excitation. As a potential application we show spiral multi-slice coronary angiography images acquired in a single breath-hold.INTRODUCTION
Spiral MRI benefits from fat suppression because fat and other off-resonant spins are blurred.1 Fat suppression in MRI can be achieved with a wide variety of methods2 including “FAT-SAT” pre-pulses (CHESS)3, short inversion time inversion recovery (STIR)4, DIXON-type water-fat separation5, and spatial-spectral (SS) water-only excitation6. For fast cardiac spiral MRI at 3T, the SS water-only excitation is the preferred method7, and could be used for single breath-hold coronary artery MR angiography (cMRA) using a multi-slice approach with one 90° excitation every heartbeat combined with long spiral readouts8. However, SS pulses are rarely used to excite thin slices (<4mm) because in those cases fly-back gradients cannot be used (Figure 1) and a slice-location dependent calibration is required to determine the phase offset between sub-pulses played during positive vs. negative gradient lobes9. The goal of this work is to develop a fast (single heartbeat) localized calibration, performed immediately prior to the data acquisition, to enable thin-slice SS water only excitation.METHODS
Zur proposed a calibration method that determines the phase difference of two non-localized spin-echo acquisitions with either a positive or negative gradient lobe in combination with the demodulation frequency function during echo acquisition.9 Instead, here we propose to determine the phase difference of two acquisitions using either only the 2nd or 3rd radiofrequency (RF) sub-pulse of the 1-2-1 binomial SS pulse which enables us to have a more similar gradient waveform history as that of the actual acquisition. We implemented three versions:- Non-localized calibration: A short, 5-μs readout 2.3ms after either the 2nd or 3rd sub-pulse (to keep water and fat signal in phase) is acquired (Figure 2) and takes 11.8ms per slice, allowing over 80 slices in under 1s. The phase difference between the two signals of all receiver coils is averaged and used as a calibration phase for the 2nd RF sub-pulse.
- Region-optimized virtual (ROVir) coils10, ROVir calibration: Same as non-localized but the data from receiver coils are combined using ROVir weights to optimize the calibration to a selected area of the body.
- Image-based calibration: To validate whether ROVir calibration is correctly localized, the non-localized calibration acquisition is extended with an imaging readout. A low-resolution spiral acquisition (6 spiral arms, FOV=500mm, voxel size=3mm, TE=2.3ms) is used to keep the scan duration below 20s. The average of the phase difference between these two images within a user-defined region of interest is the localized calibration value.
RESULTS
The calibration was tested in two spherical phantoms, each half filled with gadolinium doped agar gel (“water”, T1=117ms) and baby oil (Well beginnings by Walgreens, “fat”, T1=213ms). Without phase calibration, the saturation oscillates from fat to water (Figure 3A) leading to a low average water-to-fat ratio (WFR) of ~2. Using non-localized, ROVir, and image-based calibration offer consistent fat suppression with a WFR of 12.9, 8.6, and 8.4 (Figures 3B, C, and D), respectively. The WFR was improved in the left phantom when using either ROVir or image-based localization. The image-based calibration map (Figure 3E) shows a calibration offset of ~30° between the left and right phantom. Figure 3F shows the calibration phase for the different methods, and Figure 3G validates ROVir-based localization compared to the image-based calibration values.The slice profiles for a multi-slice acquisition with 62 1.7-mm thick slices were validated in a gadolinium-doped agar-gel filled serving tray (T1=180ms, Figure 4). Figure 4A shows one slice of a multi-slice acquisition. The readout gradient was rotated to be along the slice axis to image the slice profile (Figures 4B, C, and D). The mean FWHM was 1.85mm. A y-gradient was applied and shows consistent suppression to below 20% at the fat frequency for all slices (Figure 4D).
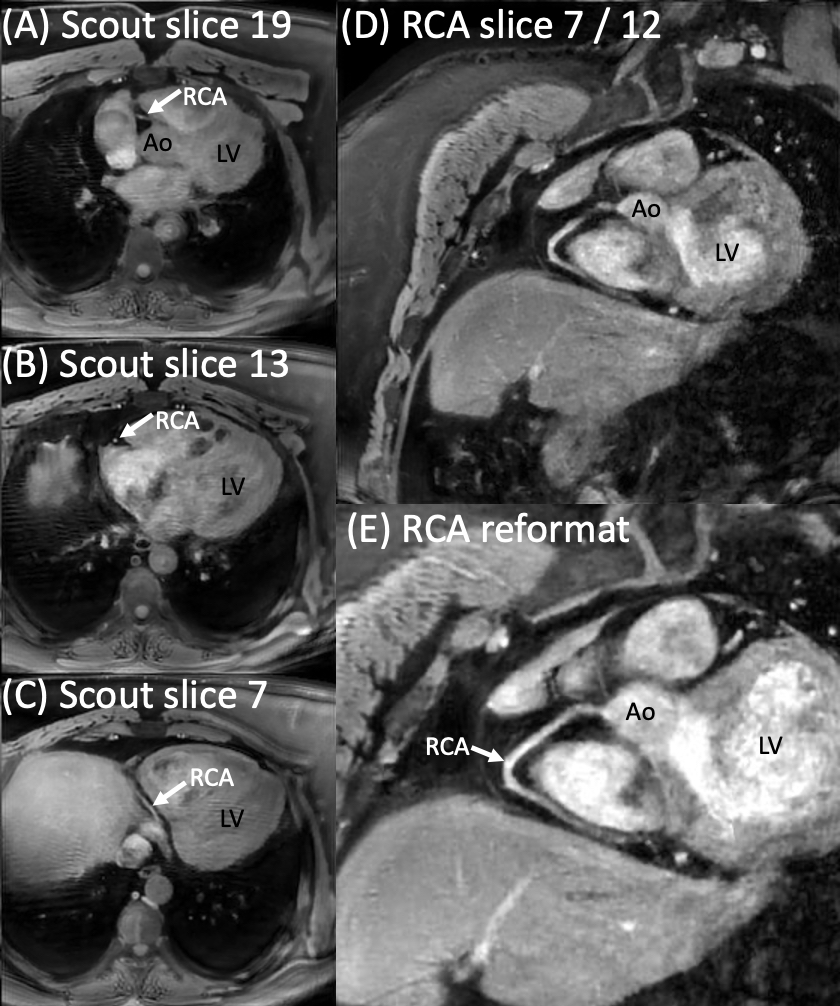
One possible application for these pulses is to acquire a cMRA scout (Figure 5A) in one breath-hold to plan a targeted cMRA scan, and to acquire such a cMRA scan in another breath-hold (Figure 5B, voxel size 0.9x0.9x1.7mm3).
DISCUSSION
Spectral-spatial excitation pulses without fly-back gradients enable slices as thin as 1.7mm, compared to ~4mm when using fly-back gradients. However, those pulses need a slice orientation-dependent calibration phase. Image-based calibration maps presented here show that these calibration phases have some variation inplane as well, and may benefit from a localized optimization. Such localization can be achieved with the recently presented ROVir coil combination, requiring a sensitivity map11,12 that is likely already available for other scans in the protocol. Such ROVir-localized calibration can be performed in 12ms per slice just prior to the data acquisition.CONCLUSION
Thin spectral-spatial pulses without fly-back gradients can be calibrated in less than 1s (or one heartbeat) and optimized locally, if desired, using a ROVir-based coil combination. Combined with efficient spiral readouts, these pulses enable fast fat-suppressed multi-slice acquisitions with proton-density weighting.Acknowledgements
Funding: NIH NIBIB R21EB030626References
- Bernstein, M. A., King, K. F. & Zhou, Z. J. Handbook of MRI pulse sequences. (Academic Press, 2004).
- Bley, T. A., Wieben, O., François, C. J., Brittain, J. H. & Reeder, S. B. Fat and water magnetic resonance imaging: Fat and Water MRI. J. Magn. Reson. Imaging 31, 4–18 (2010).
- Haase, A., Frahm, J., Hänicke, W. & Matthaei, D. 1H NMR chemical shift selective (CHESS) imaging. Phys. Med. Biol. 30, 341–344 (1985).
- Bydder, G. M. et al. The short TI inversion recovery sequence—An approach to MR imaging of the abdomen. Magn. Reson. Imaging 3, 251–254 (1985).
- Dixon, W. T. Simple proton spectroscopic imaging. Radiology 153, 189–194 (1984).
- Meyer, C. H., Pauly, J. M., Macovskiand, A. & Nishimura, D. G. Simultaneous spatial and spectral selective excitation. Magn. Reson. Med. 15, 287–304 (1990).
- Nayak, K. S., Cunningham, C. H., Santos, J. M. & Pauly, J. M. Real-time cardiac MRI at 3 Tesla. Magn. Reson. Med. 51, 655–660 (2004).
- Santos, J. M. et al. Single breath-hold whole-heart MRA using variable-density spirals at 3t. Magn. Reson. Med. 55, 371–379 (2006).
- Zur, Y. Design of improved spectral-spatial pulses for routine clinical use. Magn. Reson. Med. 43, 410–420 (2000).
- Kim, D., Cauley, S. F., Nayak, K. S., Leahy, R. M. & Haldar, J. P. Region‐optimized virtual (ROVir) coils: Localization and/or suppression of spatial regions using sensor‐domain beamforming. Magn. Reson. Med. 86, 197–212 (2021)
- Roemer, P. B., Edelstein, W. A., Hayes, C. E., Souza, S. P. & Mueller, O. M. The NMR phased array. Magn. Reson. Med. 16, 192–225 (1990).
- Pruessmann, K. P., Weiger, M., Scheidegger, M. B. & Boesiger, P. SENSE: sensitivity encoding for fast MRI. Magn. Reson. Med. 42, 952–962 (1999).
Figures
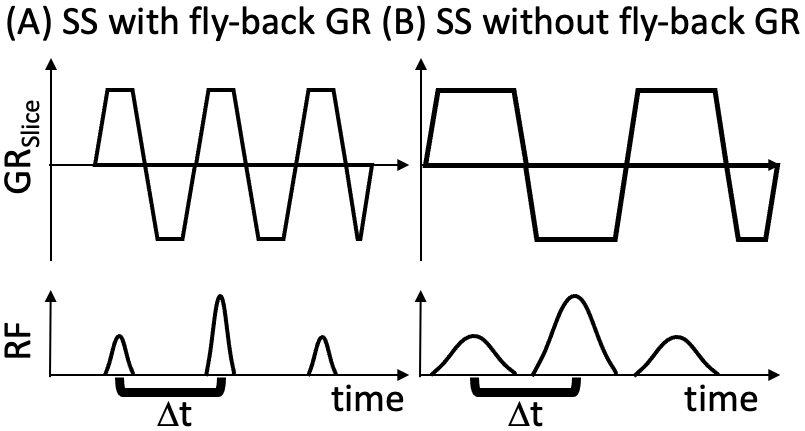
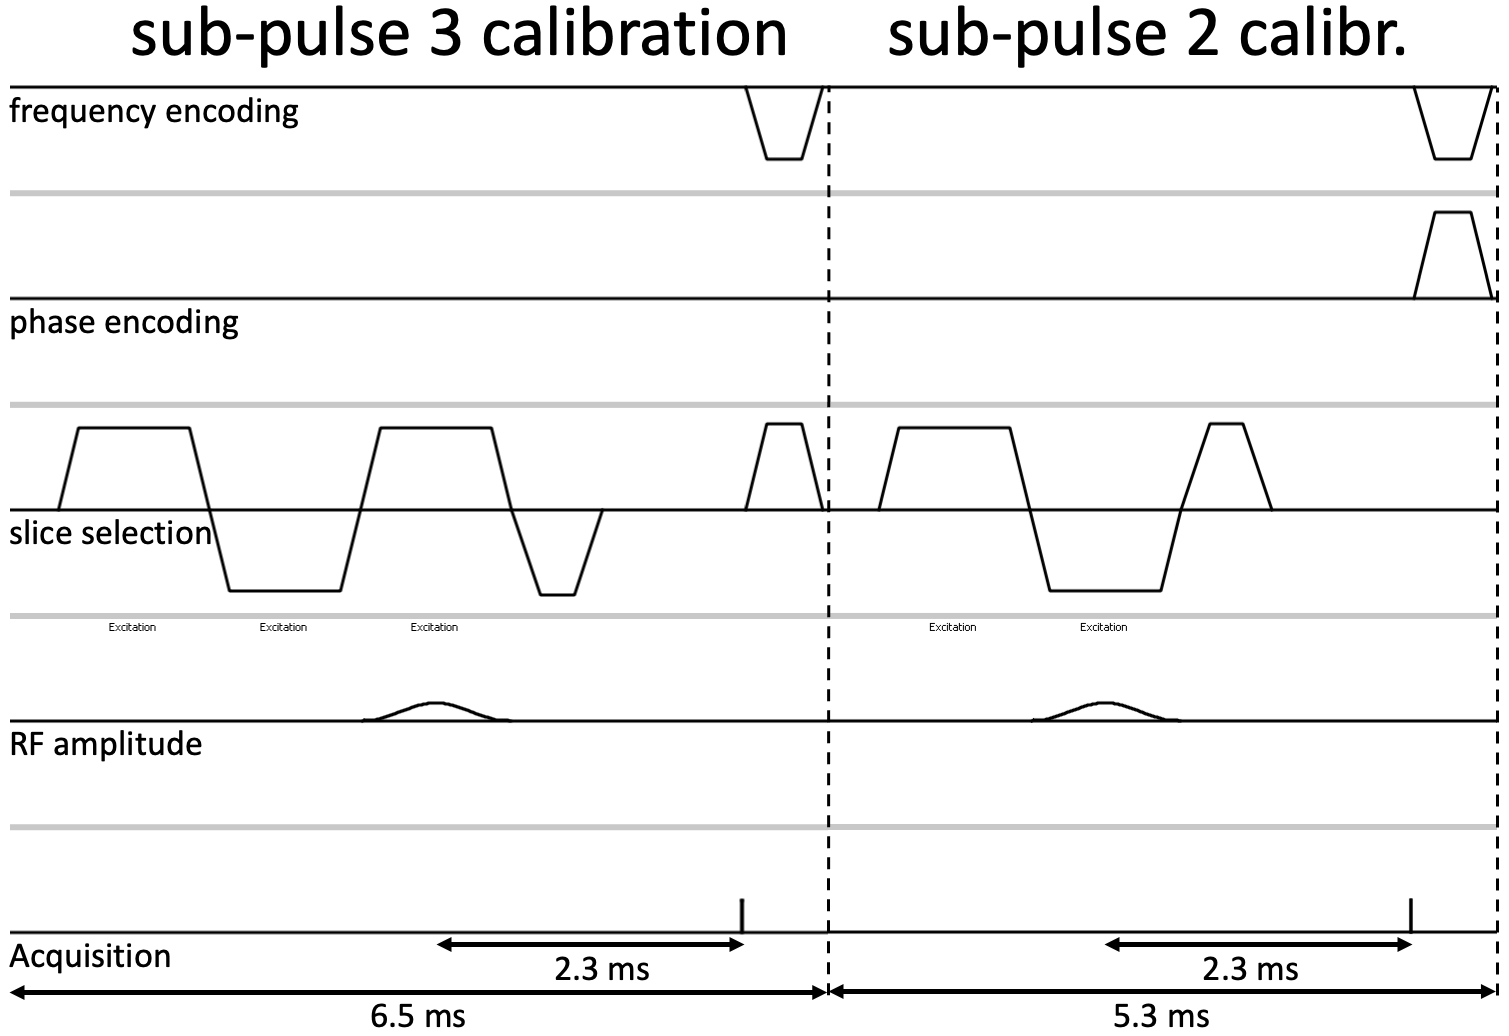
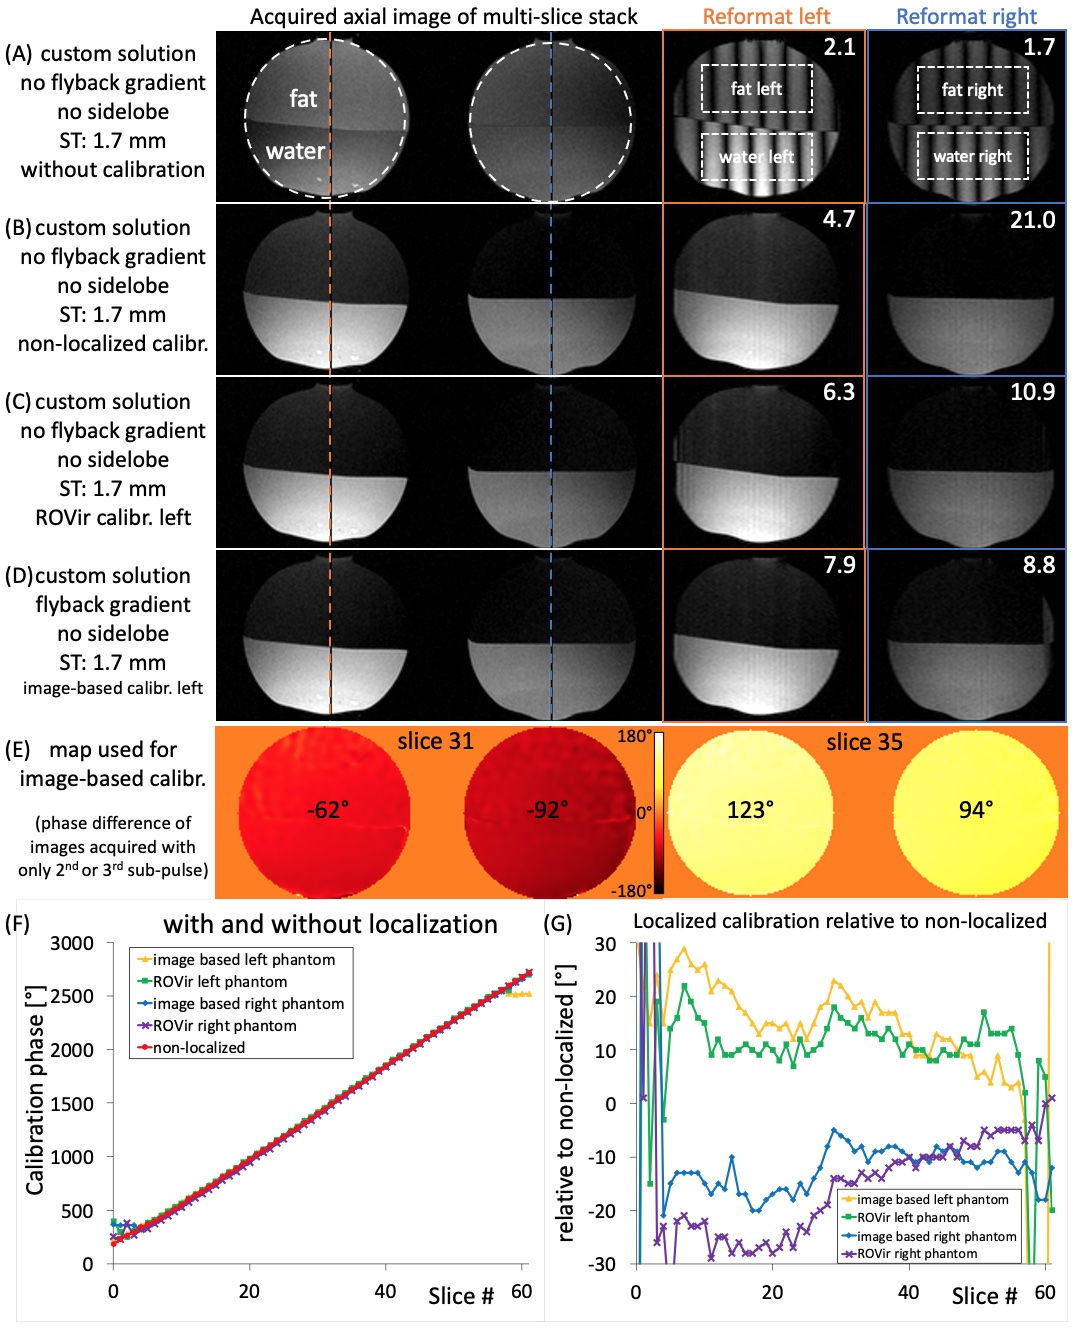
Figure 3: Images of two spherical phantoms with agar gel, "water", in the bottom and baby oil, "fat", on top. (A-D) show slice 31/62 on the left, and reformats along the 62 slices for the left (orange) and right (blue) phantom, (A) without-, (B) localized-, (C) ROVir-, and (D) image-based calibration (C and D optimized for the left phantom). Water-to-fat ratio (measured in dotted boxes) is shown in the top right of each reformat. (E) shows the image-based calibration map. (F) shows the calibration phase. (G) shows the localized calibration phases relative to the non-localized calibration.
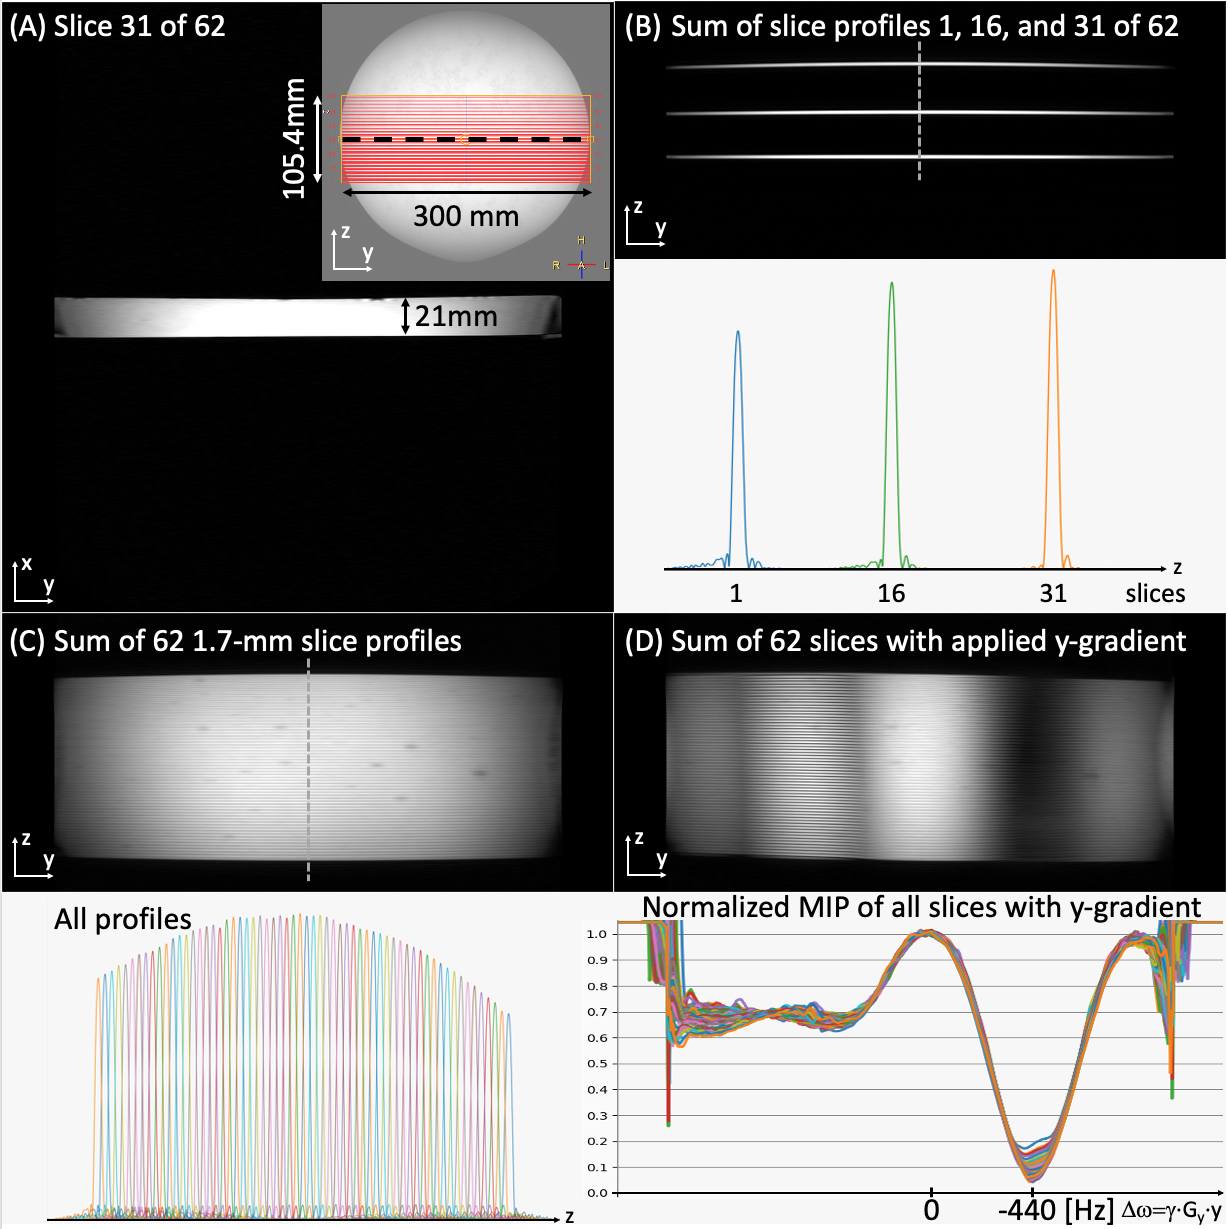
Figure 4: (A) shows slice 31/62 of a multi-slice acquisition using 1.7-mm thick slices in an agar-gel filled tray (inset). The readout gradient was rotated to be along the slice axis to image the slice profile (B, C, and D). (B) shows 3 and (C) shows all 62 slice profiles. (D) A y-gradient was applied to simulate a frequency range and shows consistent suppression to below 20% at the fat frequency for all slices.