0104
Tensors and Tracts at 64 mT1Cardiff University, Cardiff, United Kingdom, 2Hyperfine Inc., Guilford, CT, United States, 3University of Valladolid, Valladolid, Spain, 4University College London, London, United Kingdom
Synopsis
Keywords: Data Analysis, Low-Field MRI, Diffusion Tensor Imaging
We present the first ever demonstration of Diffusion Tensor Magnetic Resonance Imaging (DT-MRI) including quantitative measures of mean diffusivity, fractional anisotropy, and successful tractographic reconstruction of projection and commissural pathways on a portable system operating at 64 mT.Background
The use of low field systems is motivated by their affordability and availability in locations without higher field systems. Diffusion weighted imaging (DWI) was recently demonstrated on a portable 0.064T system (Swoop, Hyperfine Inc, Guildford, CT) for single-direction diffusion encoding1. Changes in brain microstructure have been implicated in a range of clinical and developmental disorders2,3, and can be measured using diffusion tensor Magnetic Resonance Imaging (DTI-MRI). It is therefore desirable to make DT-MRI available on low field systems.Here, we provide a proof-of-concept DT-MRI on a 64 mT system, including quantitative estimates of mean diffusivity and fractional anisotropy, and demonstrate smooth transitions in principal eigenvector in major pathways which support 3D tractographic reconstruction of the cortico-spinal tract (CST) and corpus callosum (CC).
Methods
MRI acquisitionAn SNR-efficient 6-gradient direction encoding scheme based on an icosahedron4 was implemented. This rotates the vertices of the icosahedron so that one component touches the unit cube and the other has a component equal to Fibonacci’s Golden Ratio, yielding an 18% boost in effective gradient and 39% boost in b-value per unit time compared to sampling on the unit sphere. DW images (b=600 s/mm2) were collected for the six directions, along with a b=0 s/mm2 image. Due to the simultaneous use of multiple gradients in this icosahedral scheme, the maximum gradient amplitude was limited to avoid exceeding the current draw limits of the gradient power amplifier.
Images were collected on a healthy volunteer (female, 29 years) using a Hyperfine Swoop (hardware version 1.7, software version 8.5). Two averages were acquired for each direction using a 3D fast spin echo sequence with navigator echo, hysteresis correction and eddy current pre-compensation as described in ref 1. Parameters were: TE= approximately 80 ms; TR= 1s; resolution= 92 x 76 x 16; voxel size= 2.4 x 2.4 x 5.9 mm. Each DWI acquisition took approximately 4 min 10 sec, with total scan time of just over 1 hour.
DWI processing
For the purposes of de-noising, the data were resampled to 2mm isotropic resolution and de-noised using a non-local means approach (kernel size= 3 x 3 x 3)5. Each of the twelve DWIs were registered to the b=0 s/mm2 image with FLIRT6 (FMRIB’s linear image registration tool) using an affine transformation with 12 degrees of freedom, and the normalised mutual information as the cost function. The diffusion tensor was fit using least-squares estimation, and whole-brain tractography was performed in ExploreDTI7 based on the principal eigenvector, with seedpoints regularly spaced on a 1.5 x 1.5 x 1.5 mm grid and a 0.5 mm step size. For proof of principle, CST and splenium of the CC were isolated using way-point regions of interest (ROIs).
Results and Discussion
DWIs are shown along with the non diffusion-weighted image before and after de-noising in figure 1. The method effectively removed the high-frequency noise, as shown by difference images in figure 1.Tractography results for the isolated CST and splenium of the CC are shown in figure 2.
Mean diffusivity (MD) maps are shown in figure 3. We observed MD of around .0012 mm2/s, which is higher than that typically observed at higher b-values (~.0007 mm2/s). Partial volume effects due to the large voxel size may have contributed to this, since the higher MD values in cerebrospinal fluid (CSF) may have contaminated non-CSF voxels. The MD in a water phantom was also measured on the system as .0022 mm2/s, which is well in line with literature9. Therefore, the range of expected diffusivity values of healthy tissue may need to be defined on the system since they may differ from those acquired using higher-field systems.
Pre-processing (denoising and registration) yielded smoother FA maps, shown in figure 4. Pre-processing also appeared to improve the orientational coherence of the principal diffusion direction (PDD). Figure 5 shows vector overlays indicating the PDD in an axial region surrounding the splenium with and without pre-processing.
We observed an area of artefactual signal dropout in the right posterior part of the brain for one diffusion encoding direction, leading to higher estimates of anisotropy in this region. The cause of this dropout is under further investigation. Moreover, the fidelity of the FA maps in periventricular regions seems to be compromised, which may be due to physiological motion or pulsatile effects in the CSF.
Regarding the short-term clinical applications of this work, the isolation of the CC and CST already holds promise for understanding the impact of environmental exposures on the developing brain. For example, maternal anaemia has already been associated with a lower CC volume10, while prenatal alcohol exposure is associated with atypical development trajectories of mean diffusivity in the CST11,12.
Future work includes optimizing the b-value and the required number of averages, since the tradeoff between scan duration and SNR is especially poignant at low field. Further, we will explore whether robust DT-MRI can be performed by estimating an axially-symmetric tensor, which will reduce the total data acquisition requirements.
In summary, we have demonstrated an effective proof-of-principle of the ability to isolate distinct anatomical pathways, paving the way for quantitative tractography in the white matter that has otherwise appeared homogenous on DWIs from low field systems.
Acknowledgements
This work was made possible by generous support from the Bill and Melinda Gates Foundation through the award of the UNITY project, and through the Wellcome LEAP 1kD programme. ÁP-G was supported by the European Union (NextGenerationEU).References
[1] O’Halloran, R. et al. Proc. ISMRM 2022, London: 0043.
[2] Qiu, A. et al. Annu. Re. Psychol., 66: 853-876, 2016.
[3] Tae, W-S. et al. J. Clin. Neurol., 14(2): 129-140, 2018.
[4] Muthupallai, R. et al. Proc. ISMRM 1999, Philadelphia: 1825.
[5] Manjon, J. et al. Med. Image. Anal., 12(4): 514-523, 2008.
[6] Jenkinson, M et al. NeuroImage, 17(2): 825-841, 2002.
[7] Leemans A. and Jones D.K. Magn. Reson. Med., 61(6):1336-1349, 2009.
[8] Santos, J.M.G. et al. Magn. Reson. Imaging, 26(1): 35-44.
[9] Holz, M. et al. Phys. Chem. Chem. Phys., 2: 4740-4742, 2000.
[10] Wedderburn, C. et al. SSRN Preprint: doi: 10.2139/ssrn.3920258, 2021.
[11] Roos, A. et al. Drug Alcohol Depend.: doi: 10.1016/j.drugalcdep.2021.108826, 2021.
[12] Kar, P. et al. Human Brain Mapping: doi: 10.1002/hbm.25944, 2022.
Figures
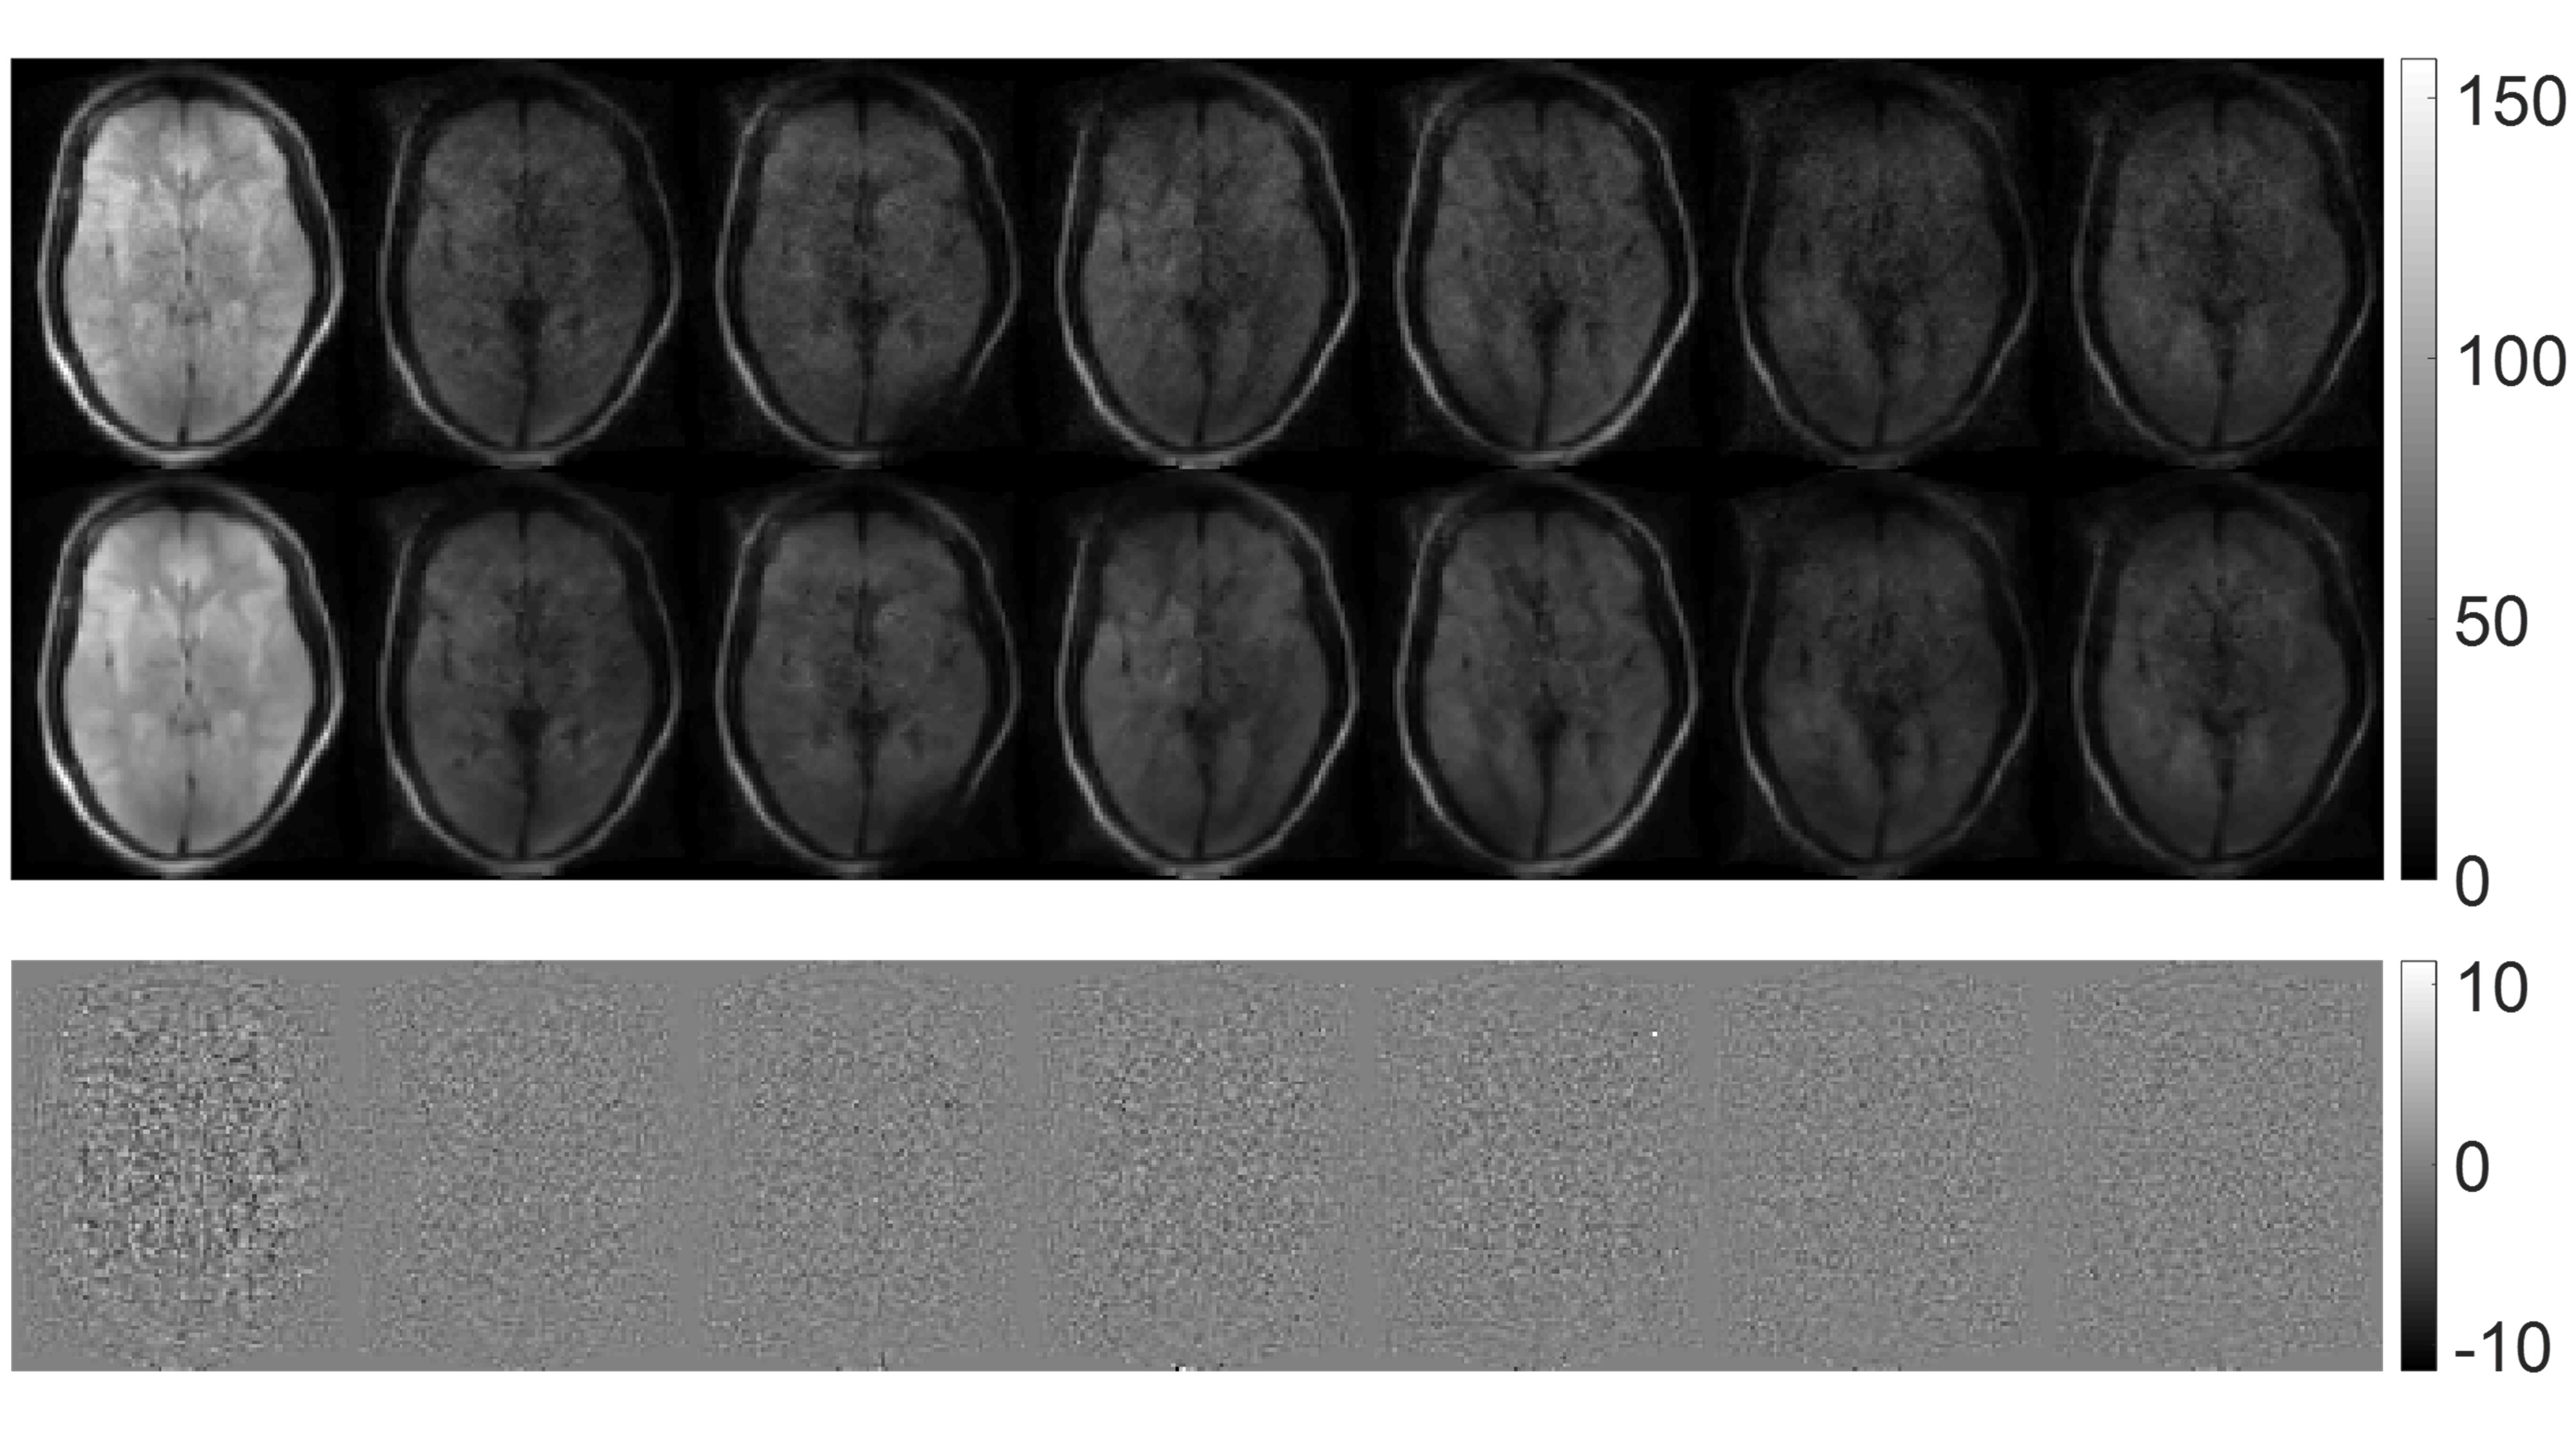
Figure 1: One non-diffusion weighted (left column) and 6 diffusion-weighted images (one per diffusion direction) shown before (top row) and after (middle row) de-noising using a non-local means approach. The difference (i.e., the noise which was removed) is shown in the third row. DWIs have a b-value of 600 s/mm2.
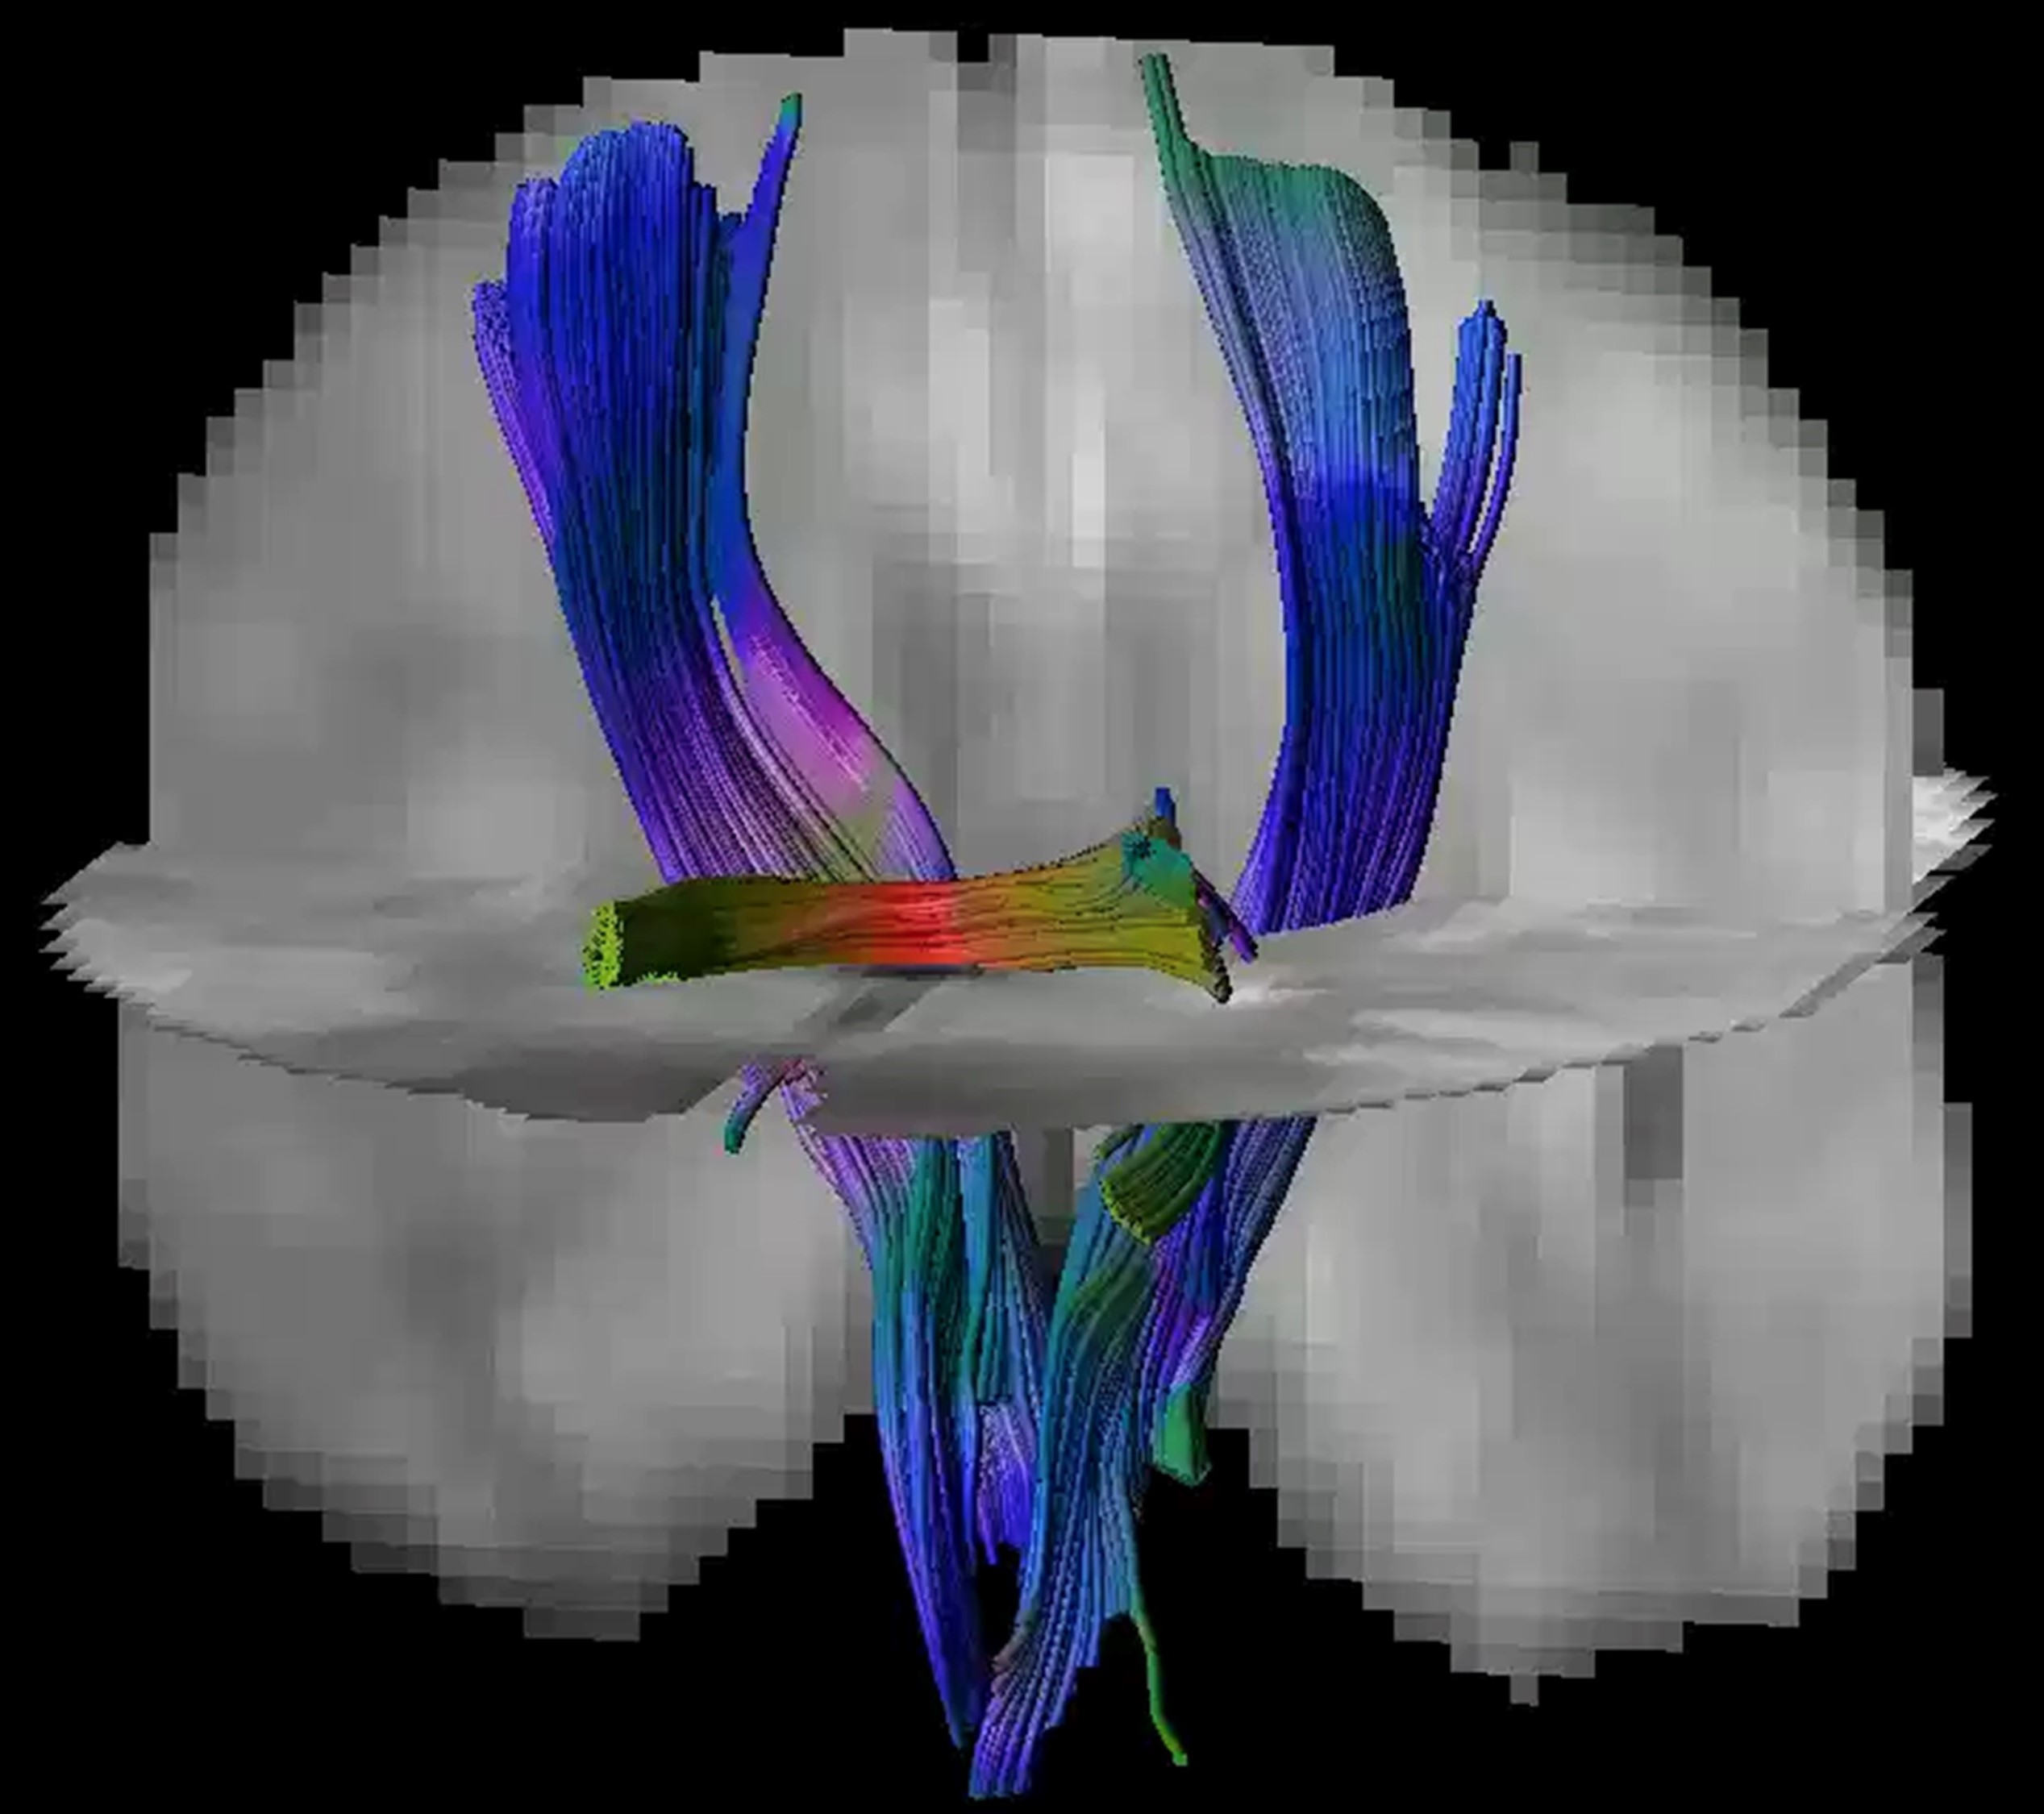
Figure 2: ExploreDTI tractography results showing the corticospinal tract in blue and the splenium in red / green, projected onto fractional anisotropy images. Six diffusion encoding directions with b=600 s/mm2 were used, and the diffusion tensor was estimated using a linear least squares approach.
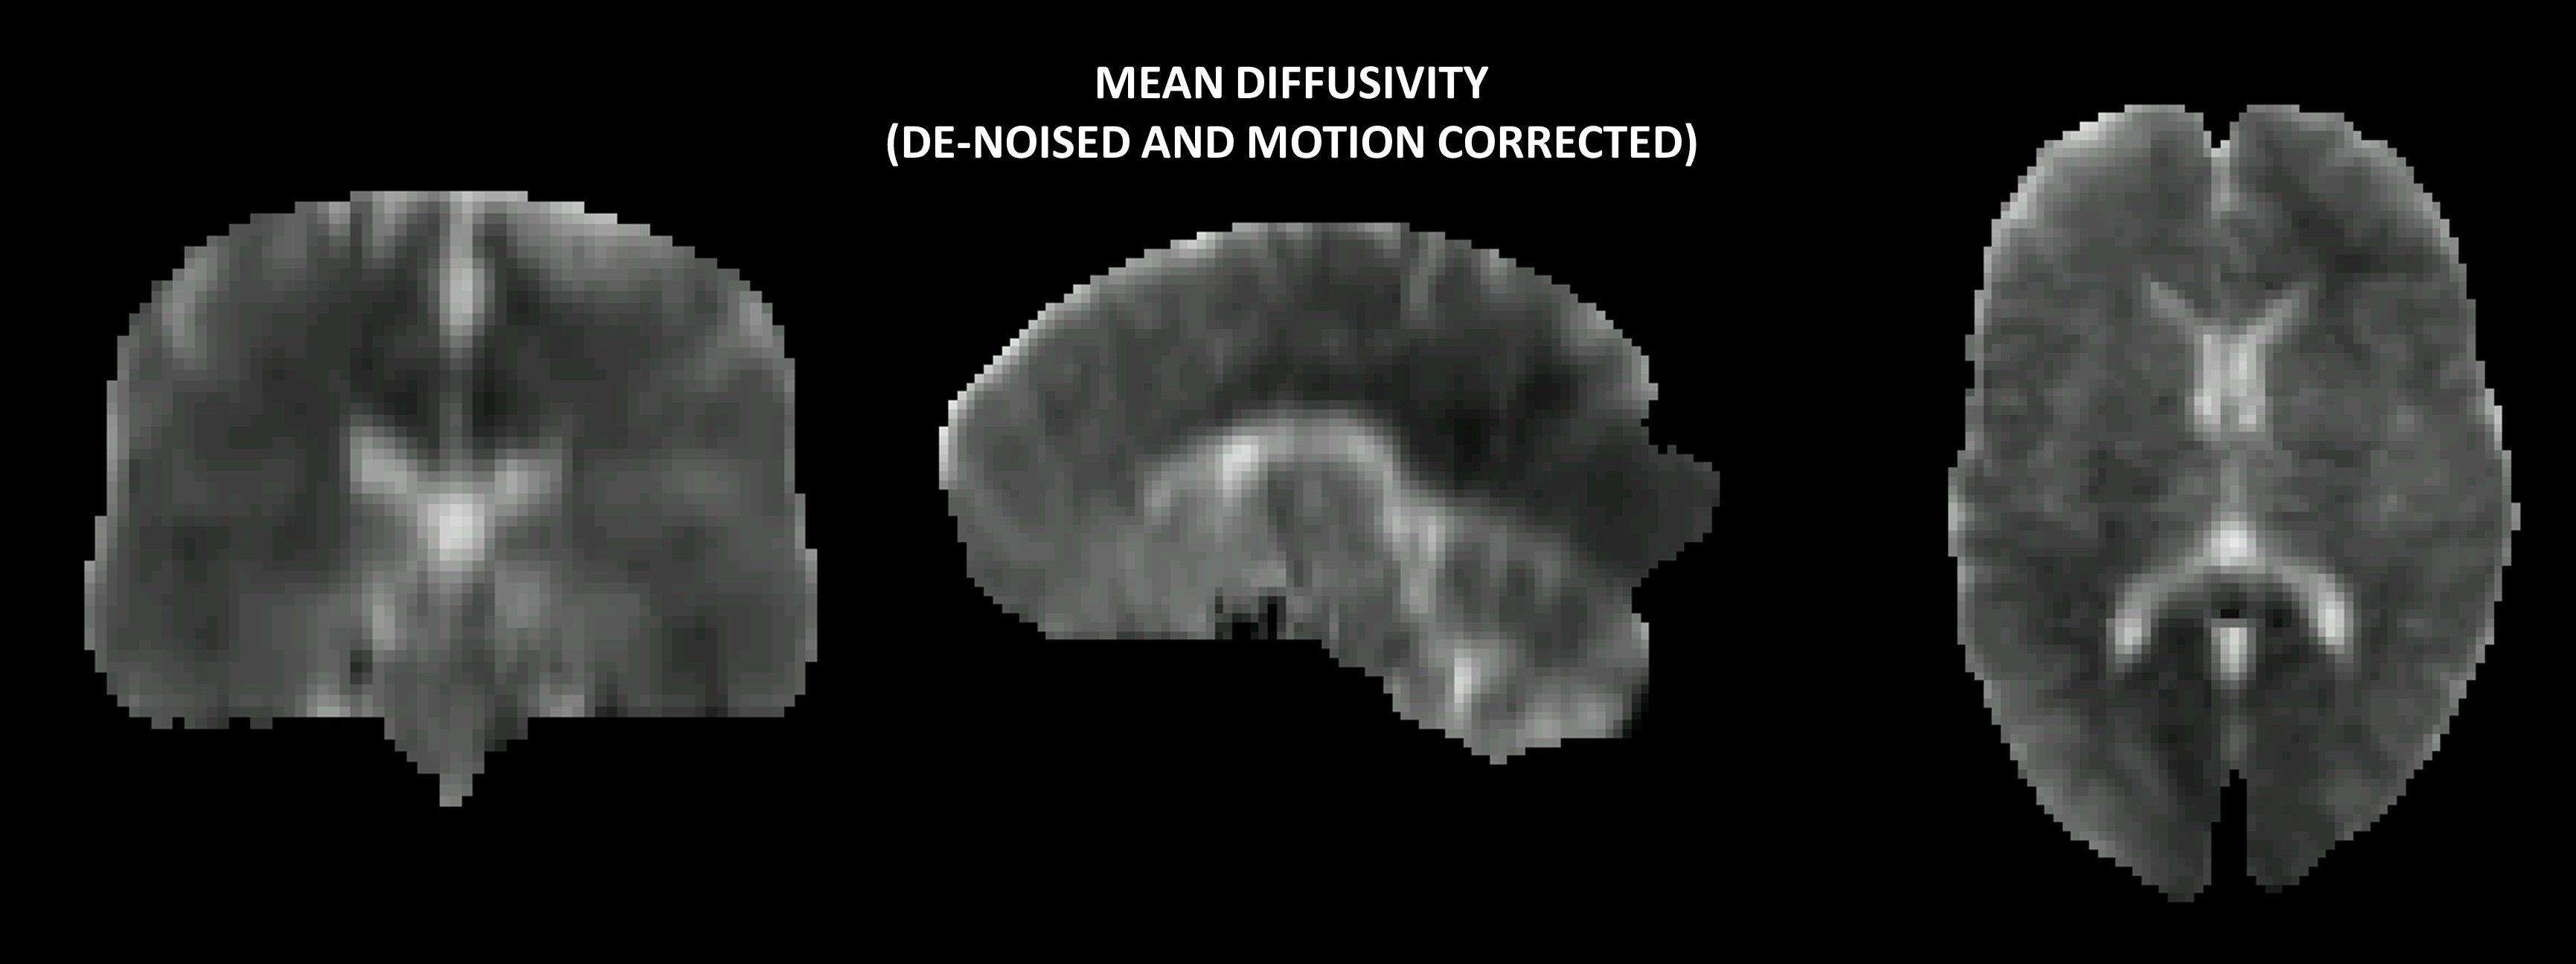
Figure 3: Coronal, sagittal and axial view of mean diffusivity maps after de-noising and motion correction (linear registration).
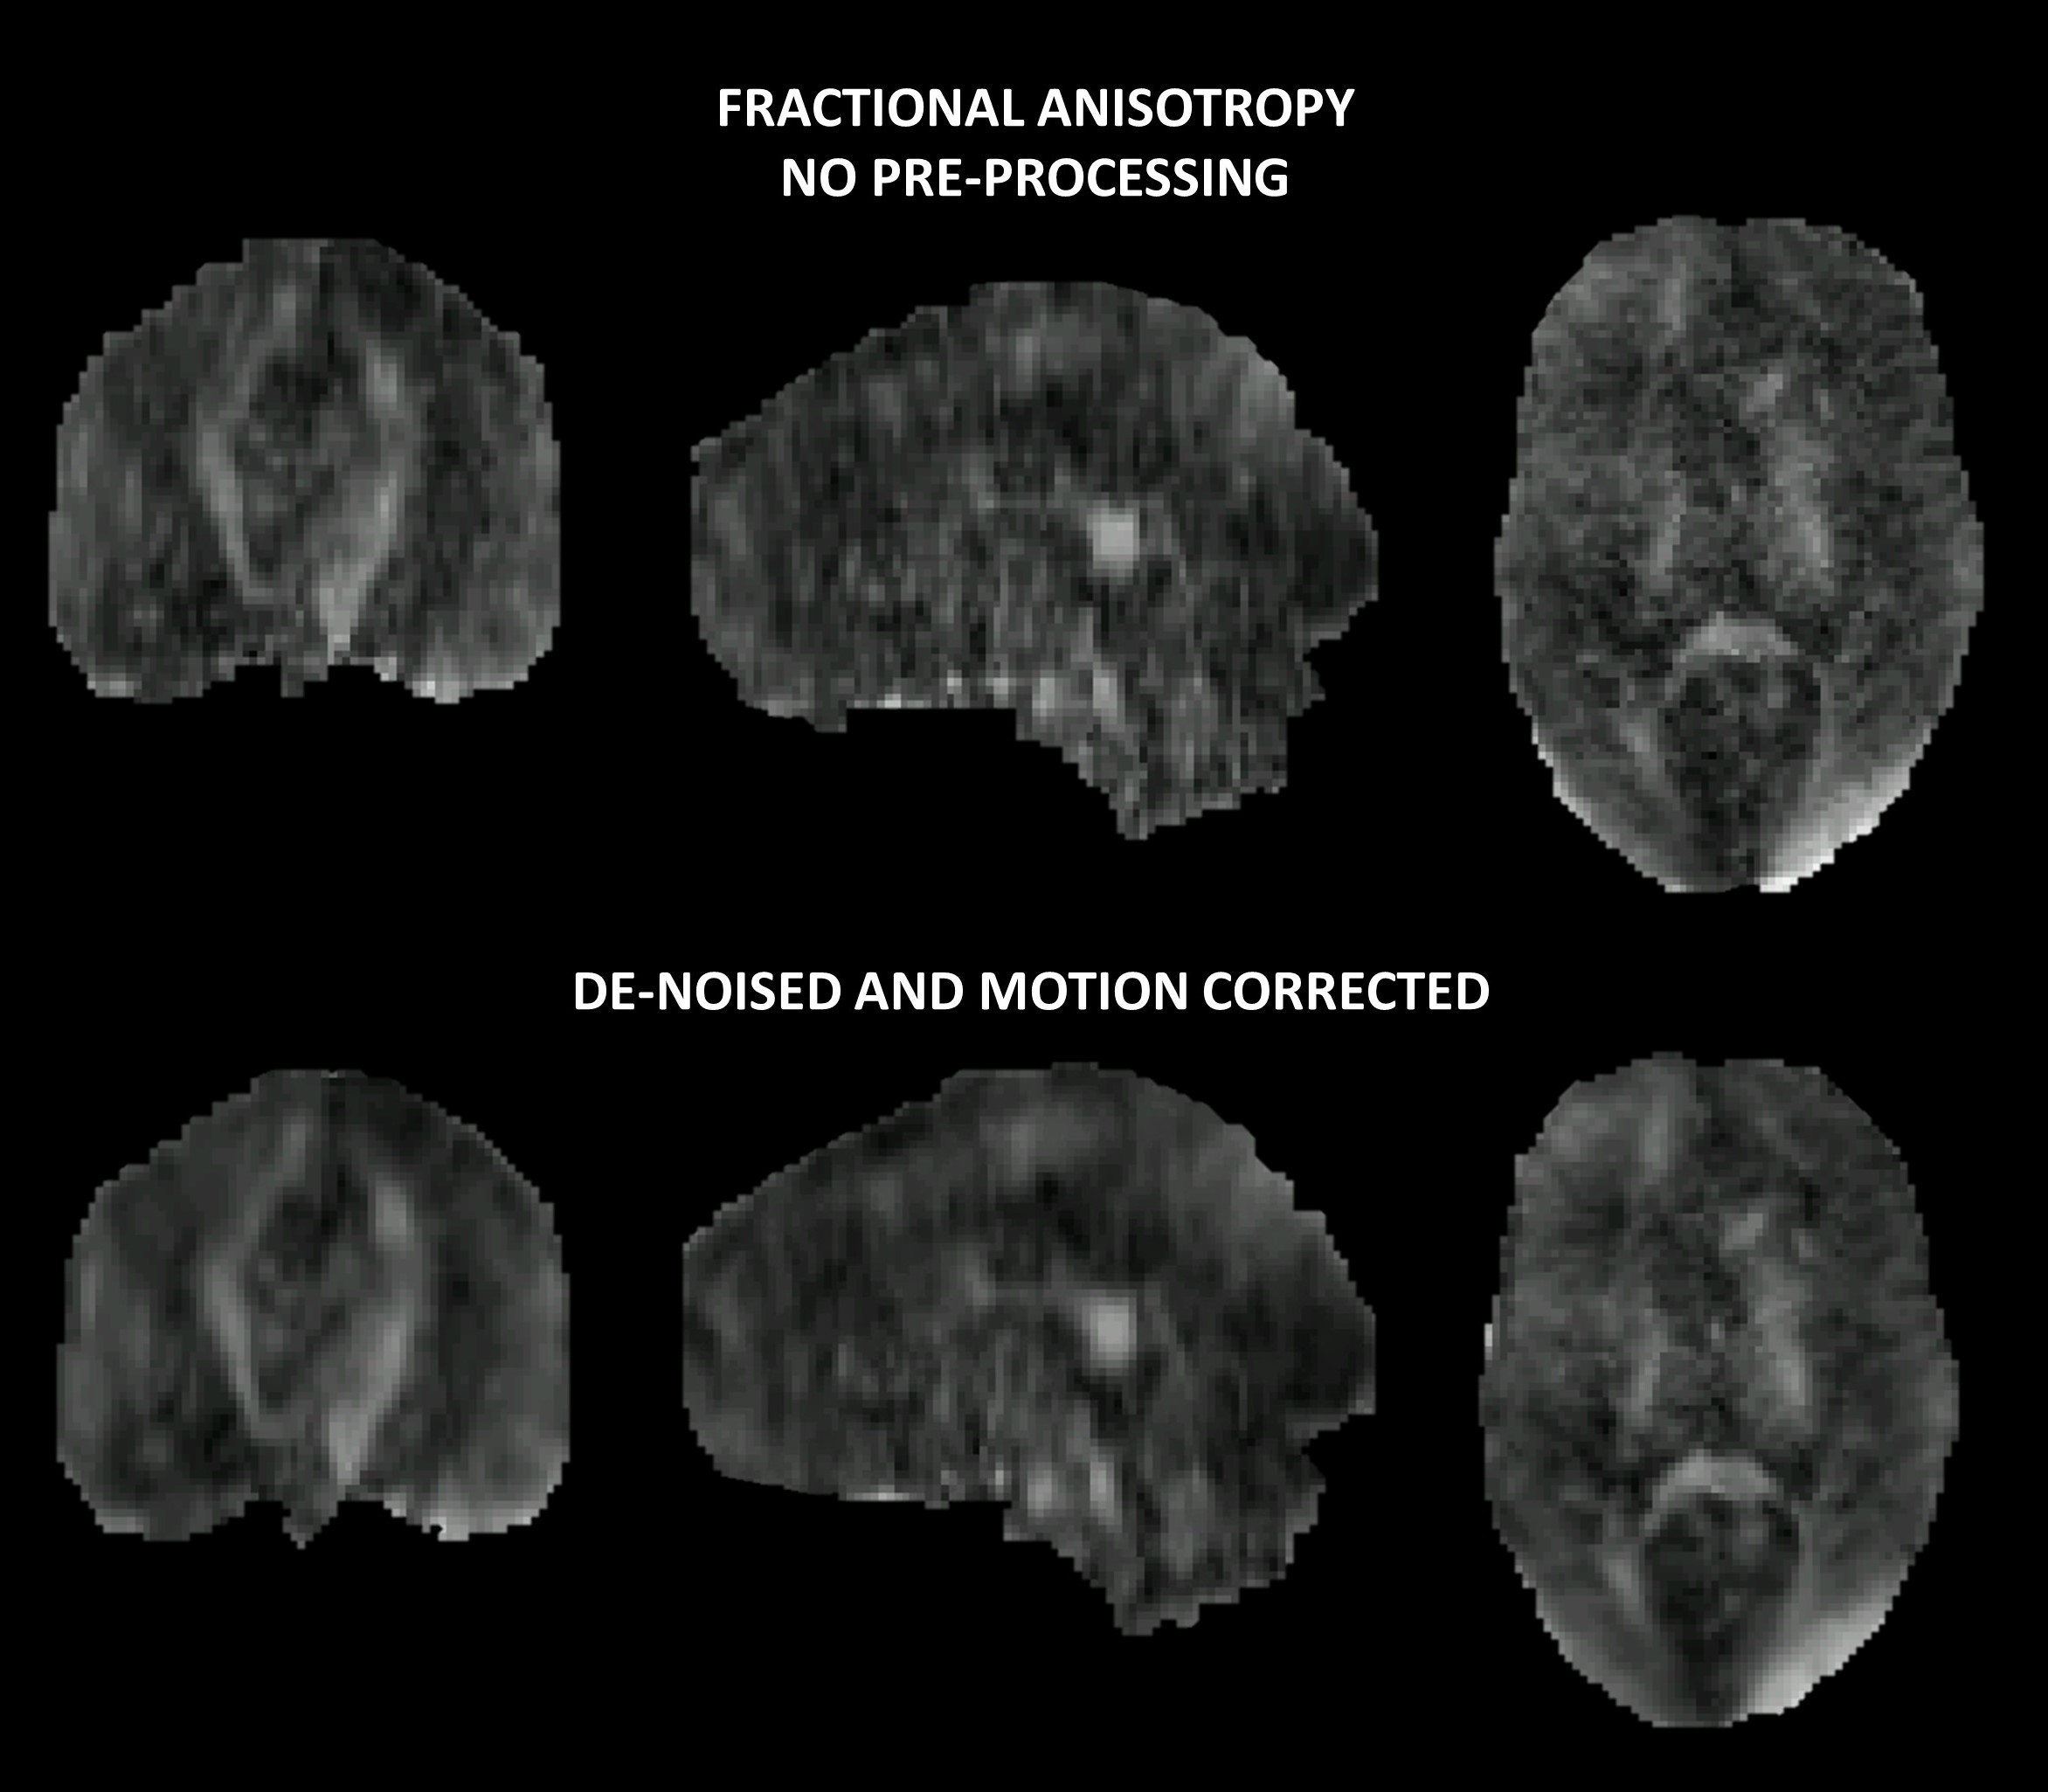
Figure 4: Coronal, sagittal and axial view of fractional anisotropy maps before (top row) and after (bottom row) denoising using a non-local means approach and motion-correction using FSL’s FLIRT.
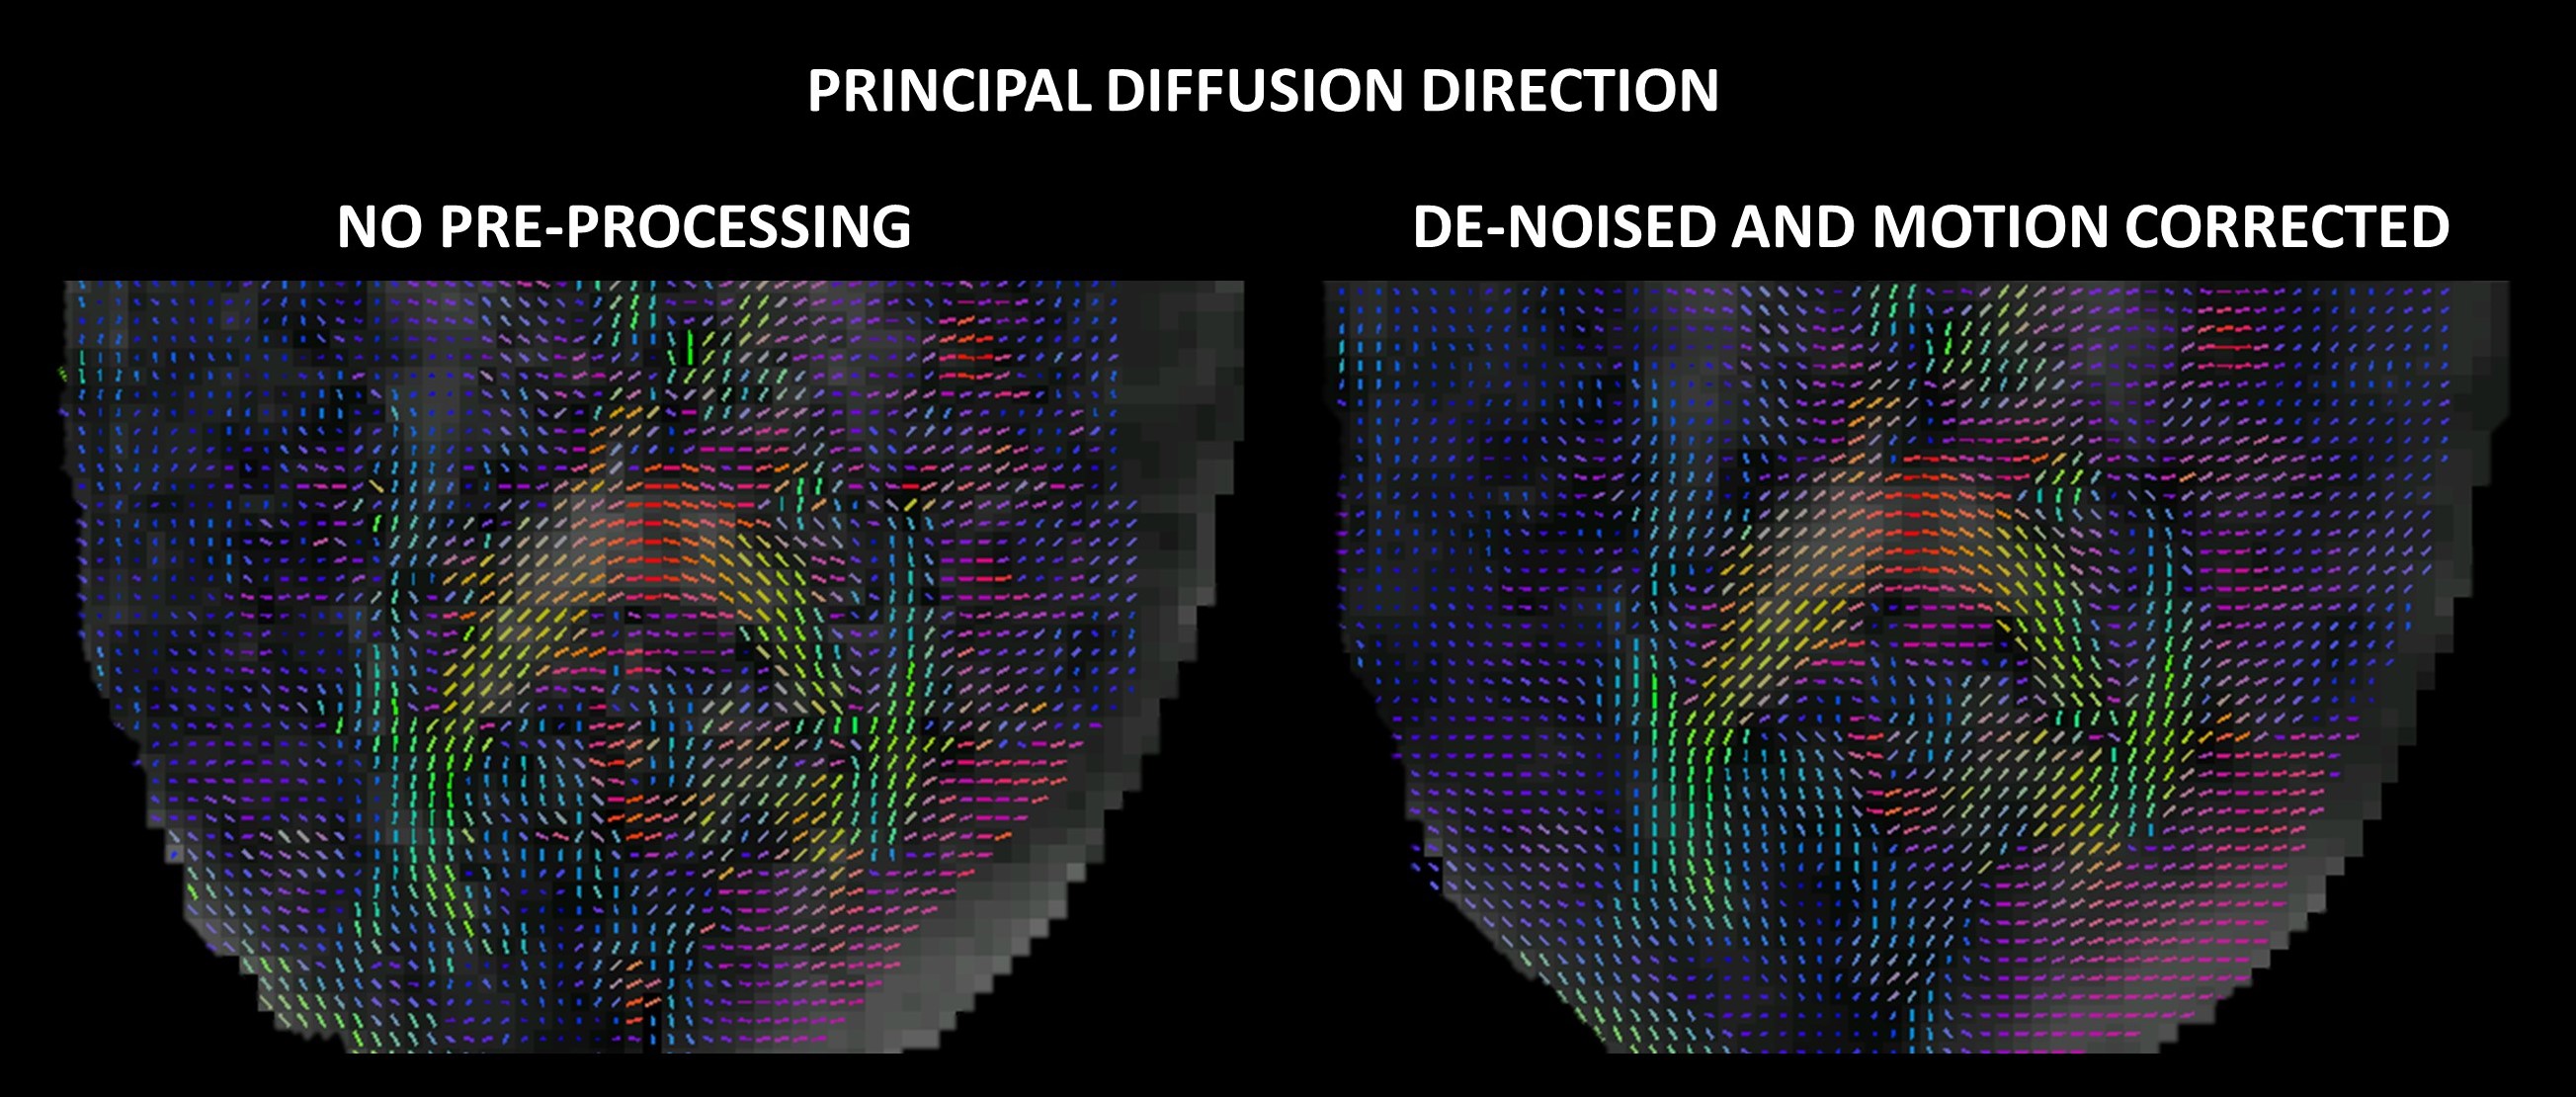
Figure 5: Vector plots with lines to indicate the principal diffusion direction within an axial slice. The benefit of de-noising and motion correction (linear registration) is shown by the improved coherence of PDD in the image on the right.