0102
Muscle magnetization transfer ratio is promising biomarker of hereditary neuropathy with liability to pressure palsy1Barrow Neuroimaging Innovation Center, Barrow Neurological Institute, Phoenix, AZ, United States, 2Department of Neurology, Wayne State University School of Medicine, Detroit, MI, United States, 3Department of Neurology, Houston Methodist Hospital, Houston, TX, United States
Synopsis
Keywords: Muscle, CEST & MT
Magnetization transfer ratio (MTR) and volume of thigh muscles were investigated as imaging biomarkers in Charcot-Marie-Tooth type 1A (CMT1A) and hereditary neuropathy with liability to pressure palsy (HNPP) patients. MTR was significantly different between HNPP and healthy control subjects; muscle volume was significantly different between CMT1A patients and healthy control subjects and HNPP patients. MTR and volume were found to be repeatable and reliable.Introduction
Charcot-Marie-Tooth type 1A (CMT1A) and hereditary neuropathy with liability to pressure palsy (HNPP) are two demyelinating/dysmyelinating inherited neuropathies. Both result from mutations to peripheral myelin protein 22 (PMP22) and present with distal limb muscle weakness, sensory loss, foot deformities, and absent reflexes [1,2]. Currently, disease progression is assessed using nerve conduction studies and disability scores (CMTNS: CMT neuropathy score). As clinical trials are anticipated, biomarkers are needed to monitor response and progression efficiently. Development of these biomarkers is made difficult by the slowly progressive nature of these diseases and the fact that therapies are more likely to slow or stop progression rather than reverse it [3]. A lack of suitable biomarkers leads to infeasible study sizes needed to show treatment efficacy [4]. Previous work has investigated imaging biomarkers of the sciatic nerve [5] and intramuscular fat [6] in CMT1A and HNPP patients. Previous work has shown that chronic muscle denervation and atrophy can be assayed via magnetization transfer (MT) MRI [7], presenting an opportunity for imaging biomarkers that could simultaneously report on nerve (as previously shown [5]) and muscle health. Here we investigate the scan-rescan repeatability, inter-rater reliability, and validity of these candidate imaging biomarkers in patients with CMT1A and HNPP.Methods
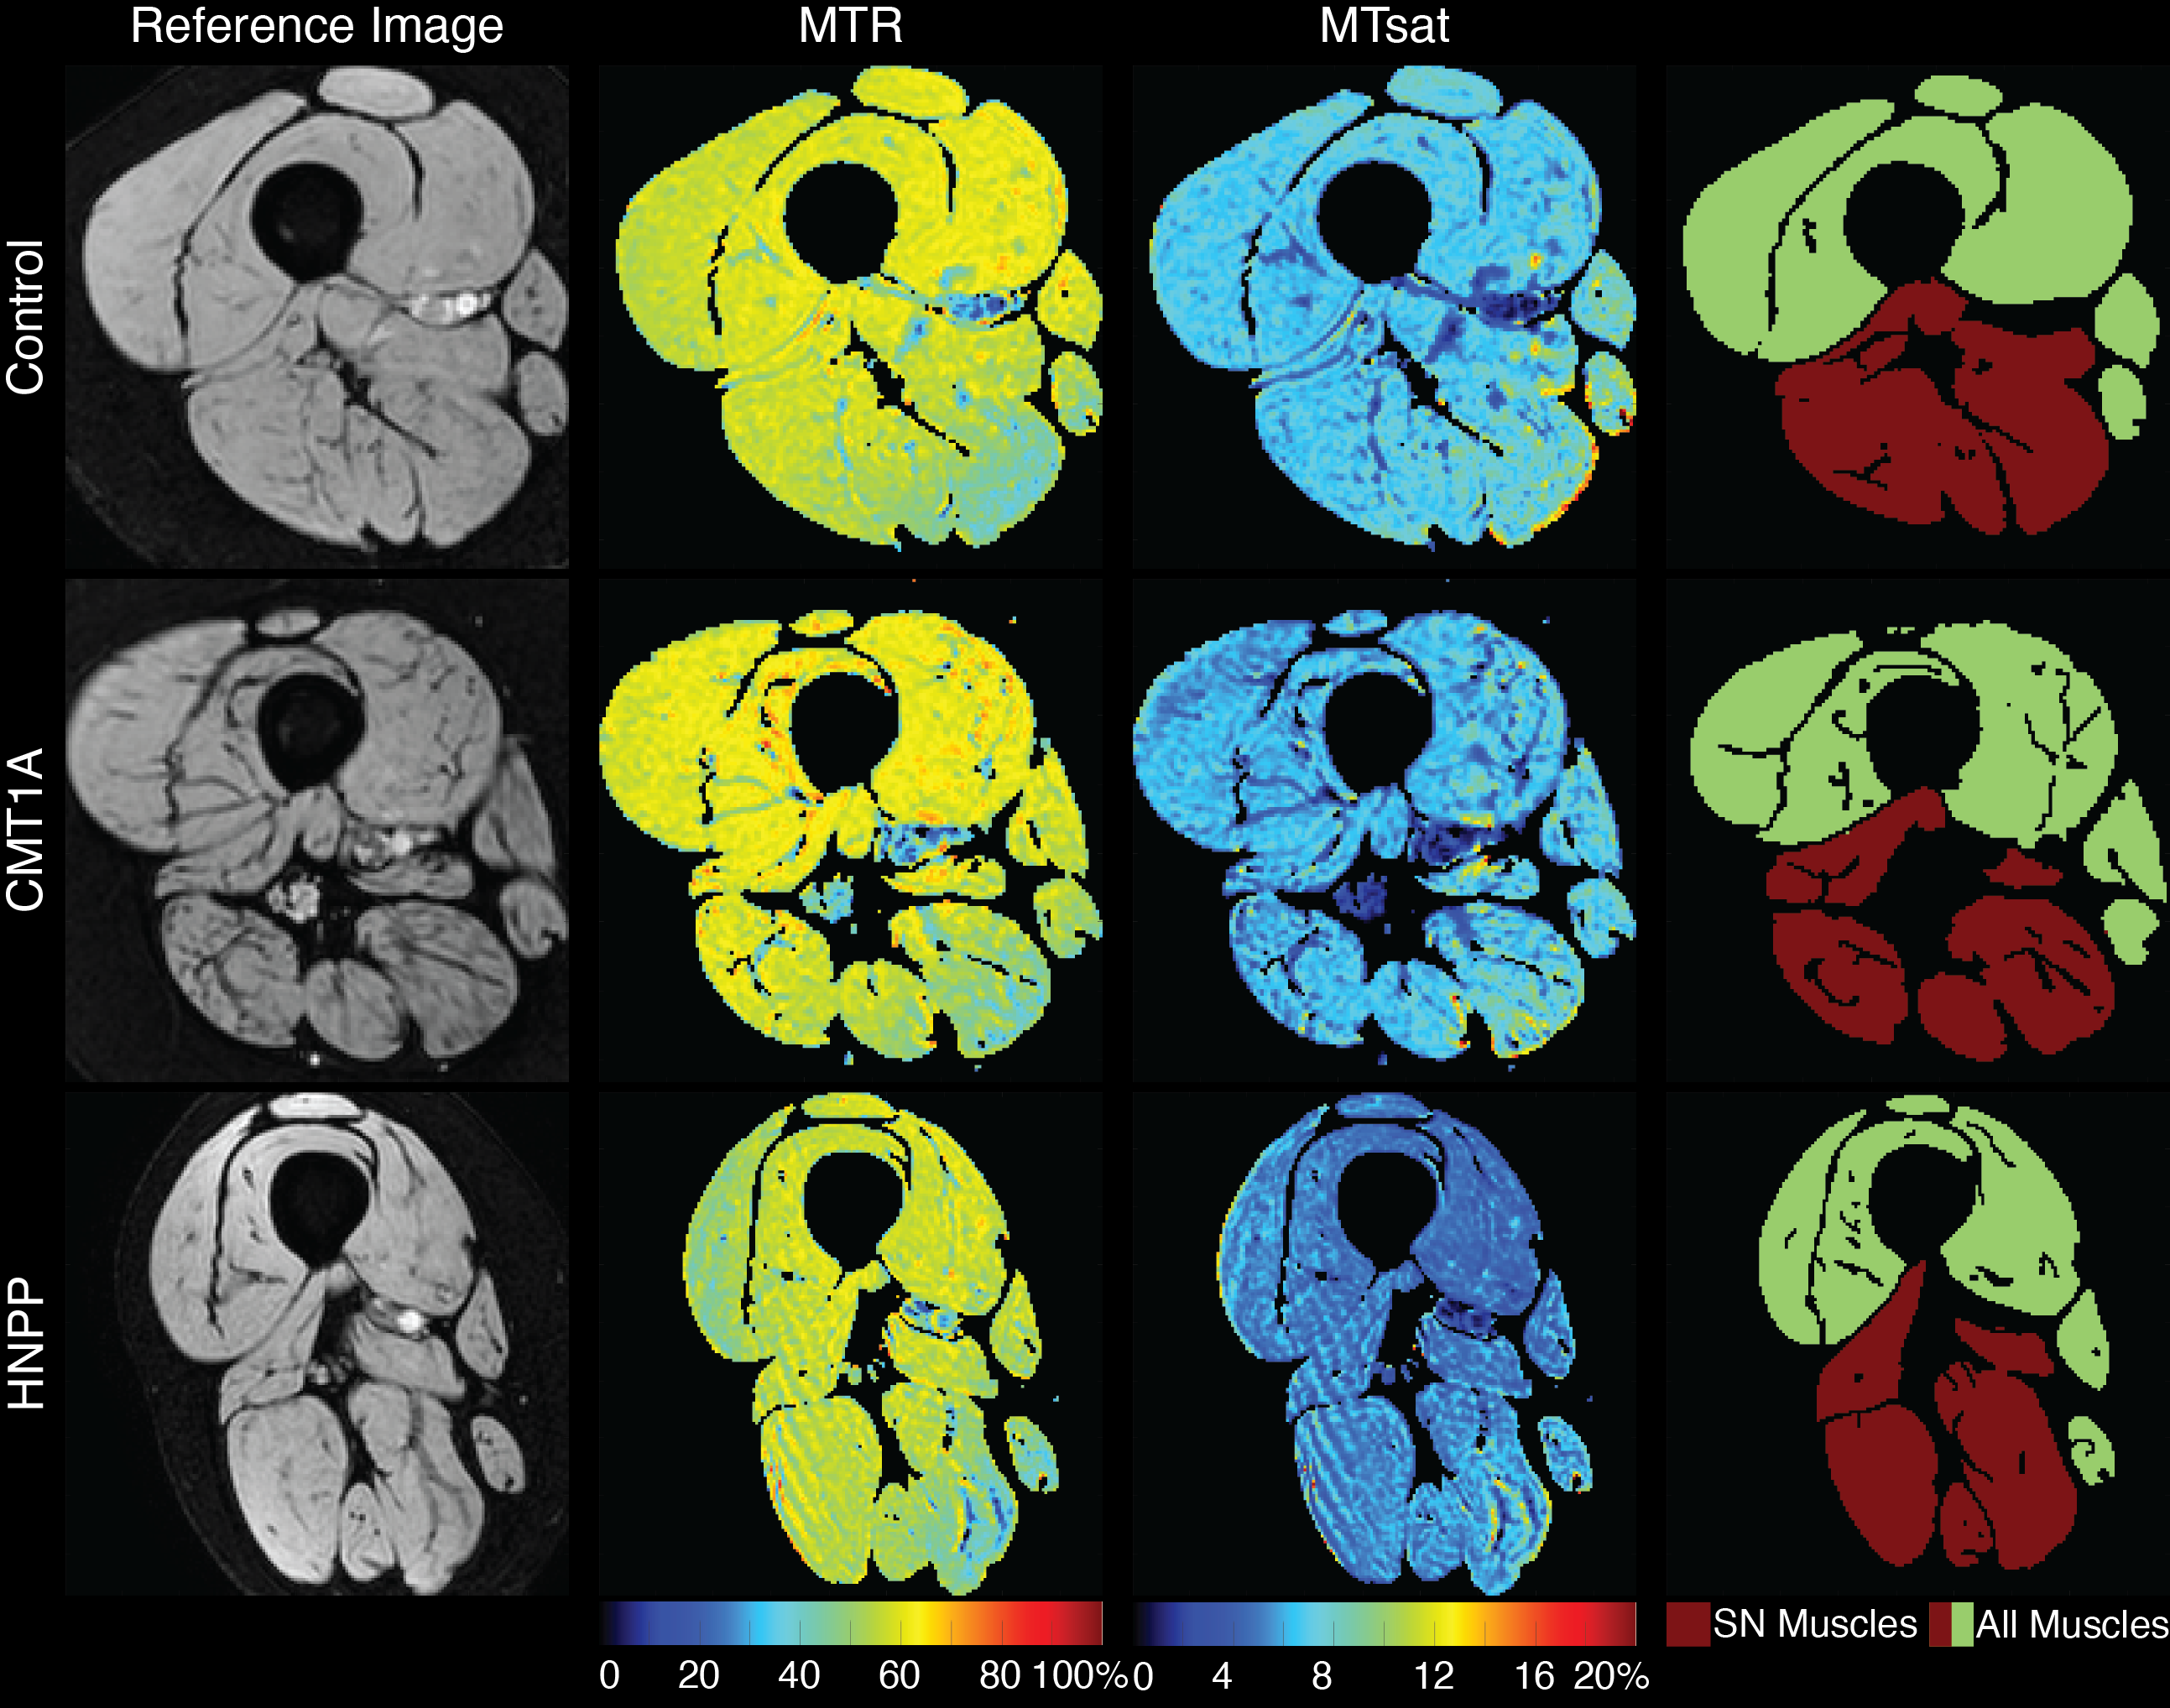
Eight patients (5 CMT1A, 3 HNPP) and 14 healthy subjects were recruited (Table 1), and the thigh of all subjects was scanned using a 3.0-T Philips MRI scanner. MT data were acquired in each subject with a MT saturation pulse (20-ms sinc-Gauss at 1 kHz off-resonance, 850° effective flip angles), segmented EPI readout (5 lines/shot), and water-selective excitation pulse (1-3-3-1, 6°). Additional parameters included: TR/TE=52-55/12.5 ms, SENSE factor=1.5, resolution=1.0x1.0x6.0 mm3, and field-of-view=192x192x96 mm3. A T1-weighted scan (30° flip angle, TR/TE=25/12.5 ms) was also acquired using the same sequence without an MT pulse.All data were non-rigidly co-registered using advanced normalization tools (ANTs) [8]. The thigh muscles were manually segmented (all thigh muscles and muscles that are innervated by the sciatic nerve (SN Muscles: adductor magnus, semimembranosus, semitendinosus, biceps short head, and biceps long head [9])) by two raters. MT metrics were extracted for each slice and averaged over all slices: MT ratio (MTR) was calculated from the MT-weighted and reference images [10] and an MT saturation index (MTsat) was calculated from the MT-weighted, reference, and T1w images [11]. Muscle volume was also calculated for comparison. To evaluate scan-rescan repeatability, three control subjects were scanned a second time (at least five days after the first scan). In addition, a second rater segmented all muscles and the muscles that innervate the sciatic nerve for 12 subjects (6 healthy controls, 5 CMT1A patients, 1 HNPP patient) to evaluate inter-rater reliability. Finally, clinical disability was measured as CMTNSL (CMTNS measured in the legs) to provide preliminary data on the ability of the MT muscle biomarkers to report on patient disability.
Statistical Analysis
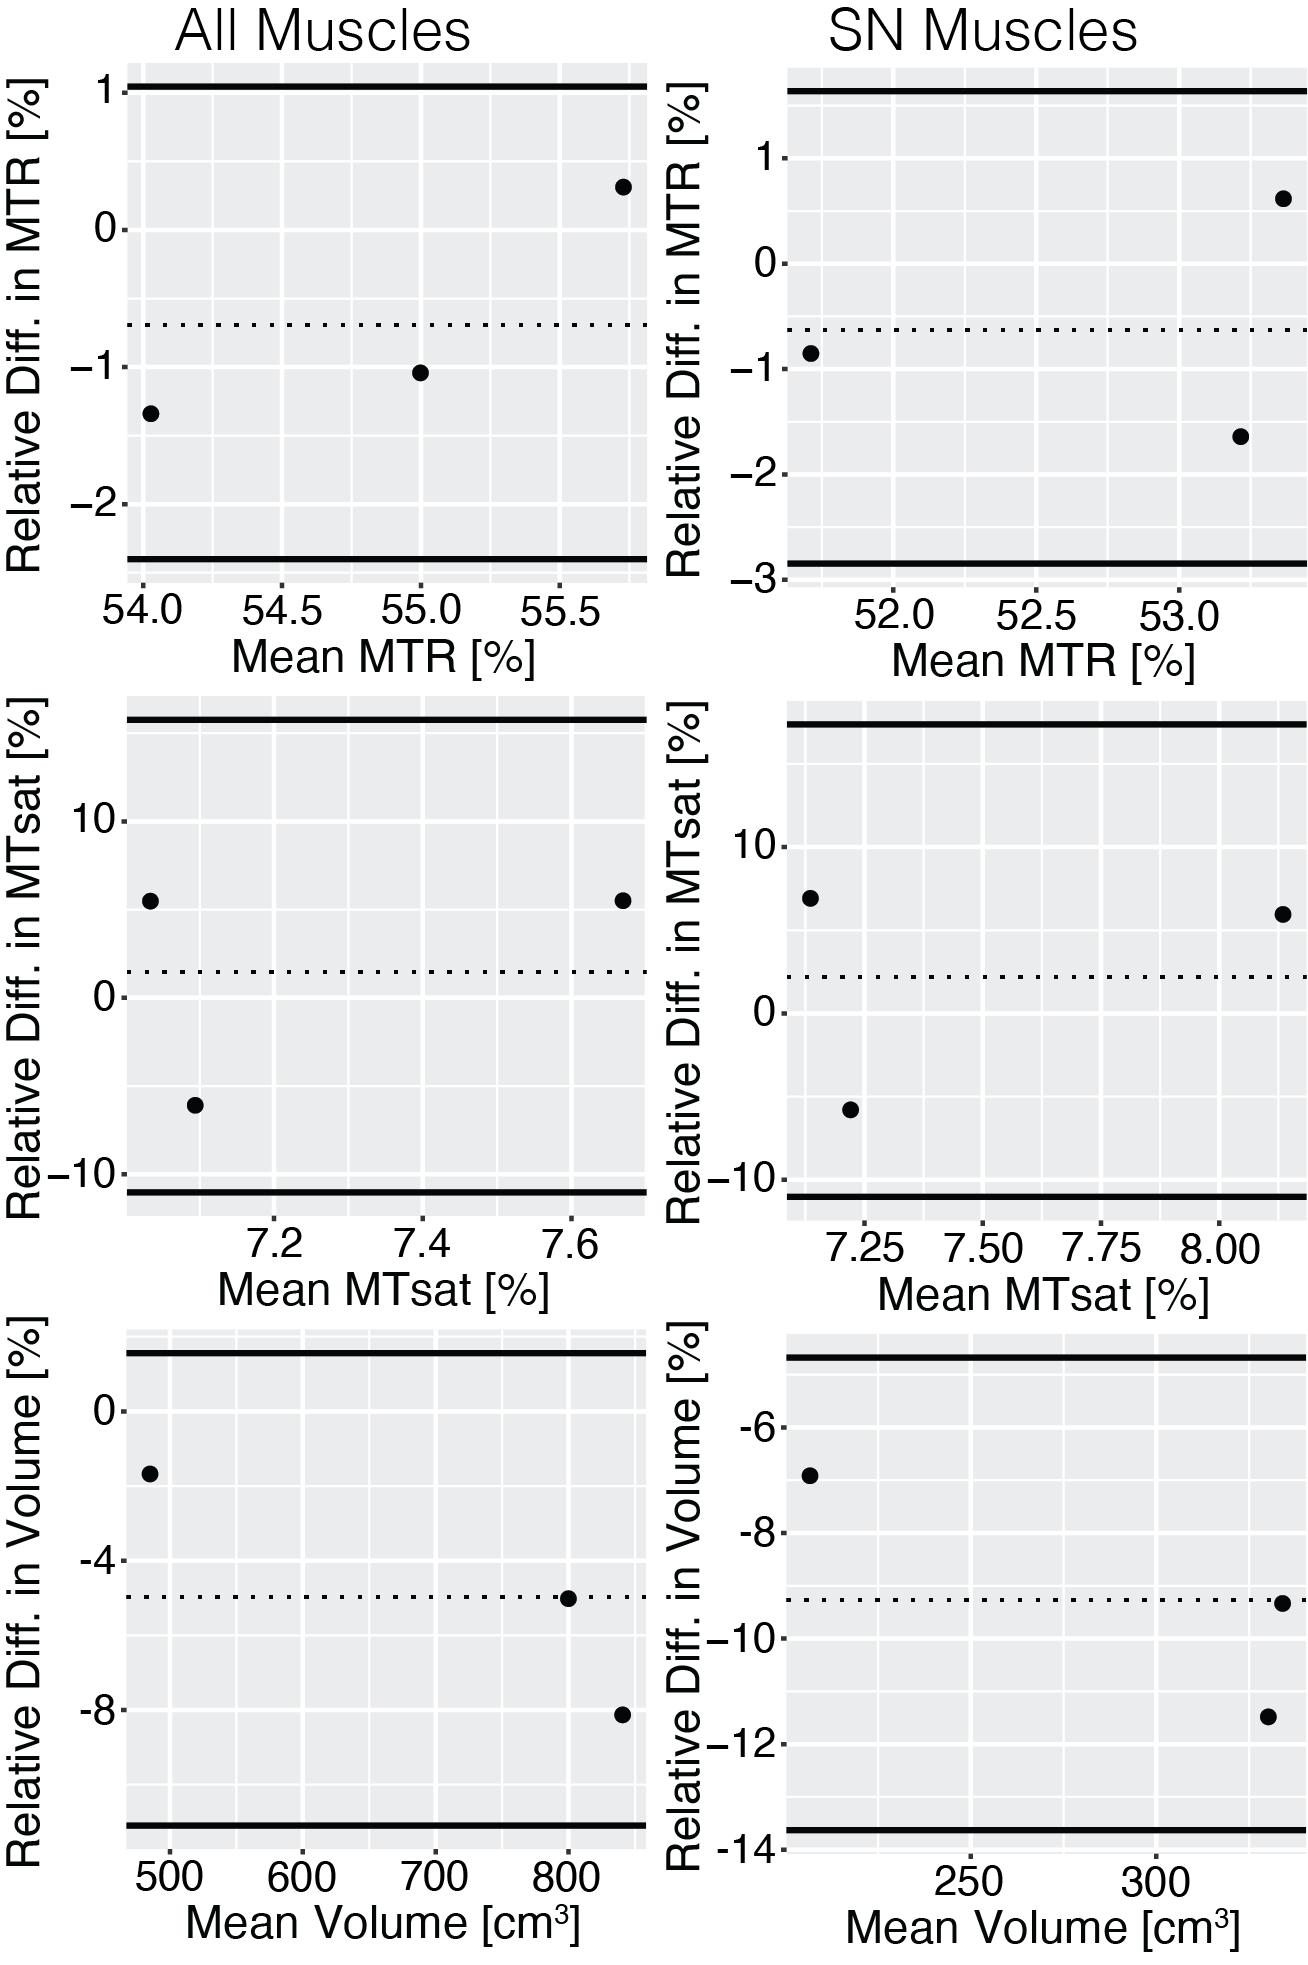
Differences between patients and control subjects were evaluated for each imaging metric using the Wilcoxon rank-sum test and effect size was evaluated according to Cohen’s D for each patient population. The MT imaging biomarkers were further assessed for relationships with CMTNSL in the eight patients using Pearson correlation. Repeatability of each imaging measure was assessed using the intraclass correlation coefficient (ICC) and coefficient of variation (CV). In addition, the relative limits of agreement (LOA) were calculated according to Bland-Altman analysis [12,13]. Inter-rater reliability was determined for each potential imaging biomarker using ICC, CV, and the paired t-test.Results
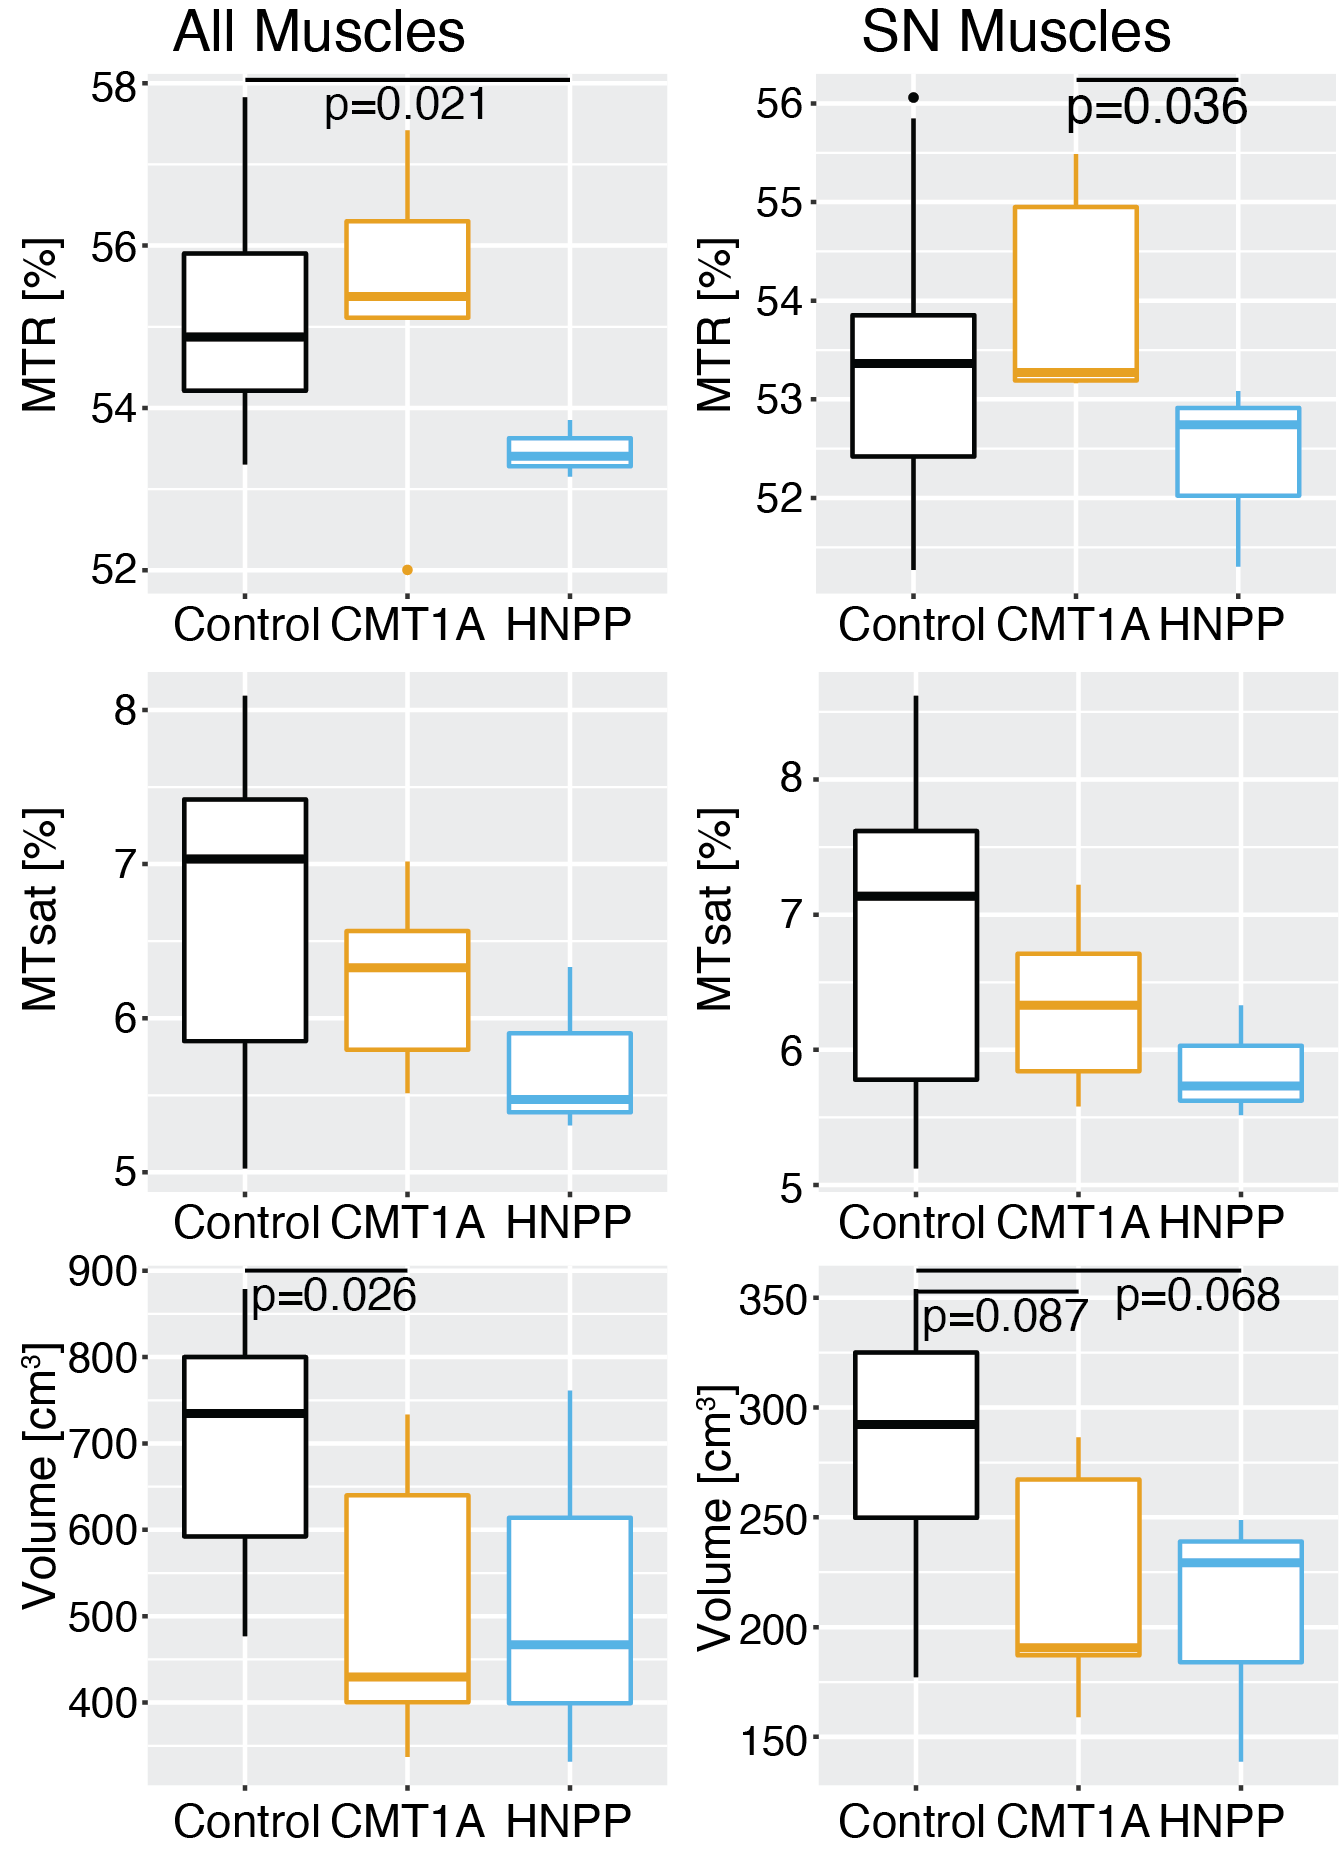
Significant differences were found between the CMT1A patients and the control subjects for the volume of all muscles (p=0.026, Cohen’s D=1.37), between the HNPP patients and the control subjects for MTR of all muscles (p=0.021, Cohen’s D=1.68), and between the CMT1A and HNPP patients for MTR of the muscles innervated by the SN (p=0.036, Cohen’s D=1.58). MTR was the most repeatable imaging metric [all muscles: ICC=0.88, CV=0.88%, LOA=(-2.40%, 1.05%)]; muscles innervated by the sciatic nerve: ICC=0.85, CV=1.15%, LOA=(-2.85%, 1.64%)). All remaining metrics were repeatable (ICC>0.70, CV<7%, LOA within ±18%). All metrics were very reliable between raters (ICC>0.94, CV<9.77%).Discussion
Previous work showed that leg muscle fat fraction was elevated in CMT1A [14,15] and HNPP [6] patients. We hypothesized that this would be reflected in changes in muscle MTR and MTsat values for these patient populations, however, MTR was only significantly different between HNPP patients and healthy control subjects. MTR was also the most repeatable metric and highly reliable. Volume of all muscles also showed promise as a biomarker in CMT1A patients as there were significant differences between CMT1A patients and control subjects and HNPP patients. Muscle volume may be sensitive to sex, age, and BMI which would make it a less ideal biomarker. There were no metrics that correlated with CMTNSL; however, this should be interpreted with caution given the small sample size. Previous work showed the promise of sciatic nerve imaging biomarkers [5], but we found that evaluating the potential imaging biomarkers in all muscles was superior to evaluating only muscles innervated by the sciatic nerve. Future work will focus on enrolling a larger cohort in a longitudinal study.Acknowledgements
Acknowledgements: NINDS R01NS115748, Detroit Medical Center Foundation (#2018-3328), Philips HealthcareReferences
[1] I. Katona, X. Wu, S.M.E.E. Feely, S. Sottile, C.E. Siskind, L.J. Miller, M.E. Shy, J. Li, PMP22 expression in dermal nerve myelin from patients with CMT1A, Brain. 132 (2009) 1734–1740. https://doi.org/10.1093/brain/awp113.
[2] R.A. Lewis, A.J. Sumner, The electrodiagnostic distinctions between chronic familial and acquired demyelinative neuropathies., Neurology. 32 (1982) 592–596. https://doi.org/10.1212/wnl.32.6.592.
[3] C. Verhamme, I.N. Van Schaik, J.H.T.M. Koelman, R.J. De Haan, M. De Visser, The natural history of Charcot-Marie-Tooth type 1A in adults: A 5-year follow-up study, Brain. 132 (2009) 3252–3262. https://doi.org/10.1093/brain/awp251.
[4] M.E. Shy, L. Chen, E.R. Swan, R. Taube, K.M. Krajewski, D. Herrmann, R.A. Lewis, M.P. McDermott, Neuropathy progression in Charcot-Marie-Tooth disease type 1A, Neurology. 70 (2008) 378 LP – 383. https://doi.org/10.1212/01.wnl.0000297553.36441.ce.
[5] A.R. Roth, J. Li, R.D. Dortch, Candidate imaging biomarkers for PMP22-related inherited neuropathies, Ann Clin Transl Neurol. n/a (2022). https://doi.org/https://doi.org/10.1002/acn3.51561.
[6] M. Pridmore, R. Castoro, M.S. McCollum, H. Kang, J. Li, R. Dortch, Length-dependent MRI of hereditary neuropathy with liability to pressure palsies, Ann Clin Transl Neurol. 7 (2020) 15–25. https://doi.org/10.1002/acn3.50953.
[7] C. Nuñez-Peralta, P. Montesinos, A. Alonso-Jiménez, J. Alonso-Pérez, D. Reyes-Leiva, J. Sánchez-González, J. Llauger-Roselló, S. Segovia, I. Belmonte, I. Pedrosa, A. Martínez-Noguera, B. Matellini-Mosca, G. Walter, J. Díaz-Manera, Magnetization Transfer Ratio in Lower Limbs of Late Onset Pompe Patients Correlates With Intramuscular Fat Fraction and Muscle Function Tests, Front Neurol. 12 (2021). https://www.frontiersin.org/articles/10.3389/fneur.2021.634766.
[8] T. Vercauteren, X. Pennec, A. Perchant, N. Ayache, Diffeomorphic demons: Efficient non-parametric image registration, Neuroimage. 45 (2009) S61–S72. https://doi.org/https://doi.org/10.1016/j.neuroimage.2008.10.040.
[9] B.A. Giuffre, R. Jeanmonod, Anatomy, Sciatic Nerve, StatPearls. (2022).
[10] R.D. Dortch, L.M. Dethrage, J.C. Gore, S.A. Smith, J. Li, Proximal nerve magnetization transfer MRI relates to disability in Charcot-Marie-Tooth diseases, Neurology. 83 (2014) 1545–1553. https://doi.org/10.1212/WNL.0000000000000919.
[11] G. Helms, H. Dathe, K. Kallenberg, P. Dechent, High-resolution maps of magnetization transfer with inherent correction for RF inhomogeneity and T1 relaxation obtained from 3D FLASH MRI, Magn Reson Med. 60 (2008) 1396–1407. https://doi.org/10.1002/mrm.21732.
[12] J.M. Bland, D.G. Altman, Measuring agreement in method comparison studies., Stat Methods Med Res. 8 (1999) 135–160. https://doi.org/10.1177/096228029900800204.
[13] J.M. Bland, D.G. Altman, Agreement Between Methods of Measurement with Multiple Observations Per Individual, J Biopharm Stat. 17 (2007) 571–582. https://doi.org/10.1080/10543400701329422.
[14] J. Bas, A.C. Ogier, A. le Troter, E. Delmont, B. Leporq, L. Pini, M. Guye, A. Parlanti, M.-N. Lefebvre, D. Bendahan, S. Attarian, Fat fraction distribution in lower limb muscles of patients with CMT1A, Neurology. 94 (2020) e1480–e1487. https://doi.org/10.1212/WNL.0000000000009013.
[15] H.S. Kim, Y.C. Yoon, B. Choi, W. Jin, J.G. Cha, Muscle fat quantification using magnetic resonance imaging : case – control study of Charcot – Marie – Tooth disease patients and volunteers, (2019) 574–585. https://doi.org/10.1002/jcsm.12415.
Figures