0095
Longitudinal evaluation of the muscles of patients with Myotonic Dystrophy type 1 treated by metformin, using quantitative 1H and 23Na MRI1NMR Laboratory, Neuromuscular Investigation Center, Institute of Myology, Paris, France, 2Neuromuscular Physiology and Evaluation Laboratory, Neuromuscular Investigation Center, Institute of Myology, Paris, France, 3Institute of Myology, Paris, France, 4Institute of Radiology, University Hospital Erlangen, FAU, Erlangen, Germany
Synopsis
Keywords: Muscle, Tissue Characterization
Myotonic dystrophy type 1 (DM1) is a neuromuscular disorder resulting in progressive muscle wasting and dysfunction. We aimed at determining the relationship between several 1H and 23Na MRI indices of disease severity and disease activity in the muscles of DM1 patients, and evaluating their response to a 12-month metformin treatment. We showed that these indices could differentiate DM1 patients from healthy controls. Variables related to disease severity correlated with functional tests and indices related to disease activity were increased and mutually correlated. Over the 12-months treatment interval, MRI variables were more sensitive than functional outcomes to detect disease progression.INTRODUCTION
Myotonic dystrophy type 1 (DM1) is a neuromuscular disorder (NMD) caused by a CTG repeat expansion in the 3’UTR of the DMPK gene1. In adults with DM1, structural changes affecting skeletal muscle tissue result in progressive muscle wasting and dysfunction. Recently, metformin, a well-known anti-diabetic drug, has been shown to improve mobility of these patients2. These encouraging results, together with the upcoming oligonucleotide clinical trials justify the need to validate quantitative imaging biomarkers to objectively assess disease progression and treatment efficacy.Patients with DM1 already revealed elevated intramuscular muscle fat fraction (FF), a biomarker of disease severity, and elevated water T2, a biomarker of disease activity3. Tissue sodium concentration (TSC), as measured by 23Na MRI, has been shown to be a sensitive marker of cell integrity and energy metabolism in two patients with myotonic dystrophy4. Recently, water T1, as measured by MR fingerprinting with water and fat separation (MRF T1-FF)5, has also been proposed for monitoring disease activity in NMDs6. The aim of our study was to determine the relationship between these quantitative 1H and 23Na MRI indices in patients with DM1, and evaluate their response to a 12-month metformin treatment.
METHODS
Seven patients (51.6 [45.4-58.2] years, 5 women) with DM1, and nine healthy volunteers (49.1 [35.7-58.8] years, 6 women) participated in this study. Patients with DM1 were evaluated at baseline and over a 12-months metformin treatment (3000 mg/d). Their function was assessed using the 6-minute walk distance (6MWD) and the Motor Function Measure (MFM) scale7.Quantitative 1H and 23Na muscle MRI was done with a 3T scanner (Magnetom PrismaFit, Siemens Healthineers). The 1H part was performed in the thighs and legs using multi-channel surface coils. FF was measured using 3-point Dixon8 (3 TEs = 2.75/3.95/7.55ms, TR = 10ms, Tacq = 3min12s). A multi- spin-echo sequence was acquired (17 echoes ranging from 9.5ms to 161.5ms, TR = 3s, Tacq = 3min41s) from which water T2 values were calculated by a tri-exponential fitting procedure9. An MRF T1-FF sequence was acquired (train of 1400 spokes, varying TE, TR and FA, Tacq = 50s) to generate water T1 maps5.
23Na imaging was performed using a single-tuned 23Na birdcage knee coil (Stark Contrast). All 23Na images were acquired using a density-adapted 3D-radial readout scheme10. For TSC, the following parameters were used: TE = 0.3ms, TR = 120ms, 5384 projections, Tacq = 10min46 s. Inversion recovery images (intracellular-weighted [ICW]) were acquired with a TI of 34 ms11 (TE = 0.3ms, TR = 124ms, 4760 projections, Tacq = 9min50 s). TSC and ICW signals were calibrated using reference phantoms and corrected for the non-negligible sodium signal of fat12.
RESULTS
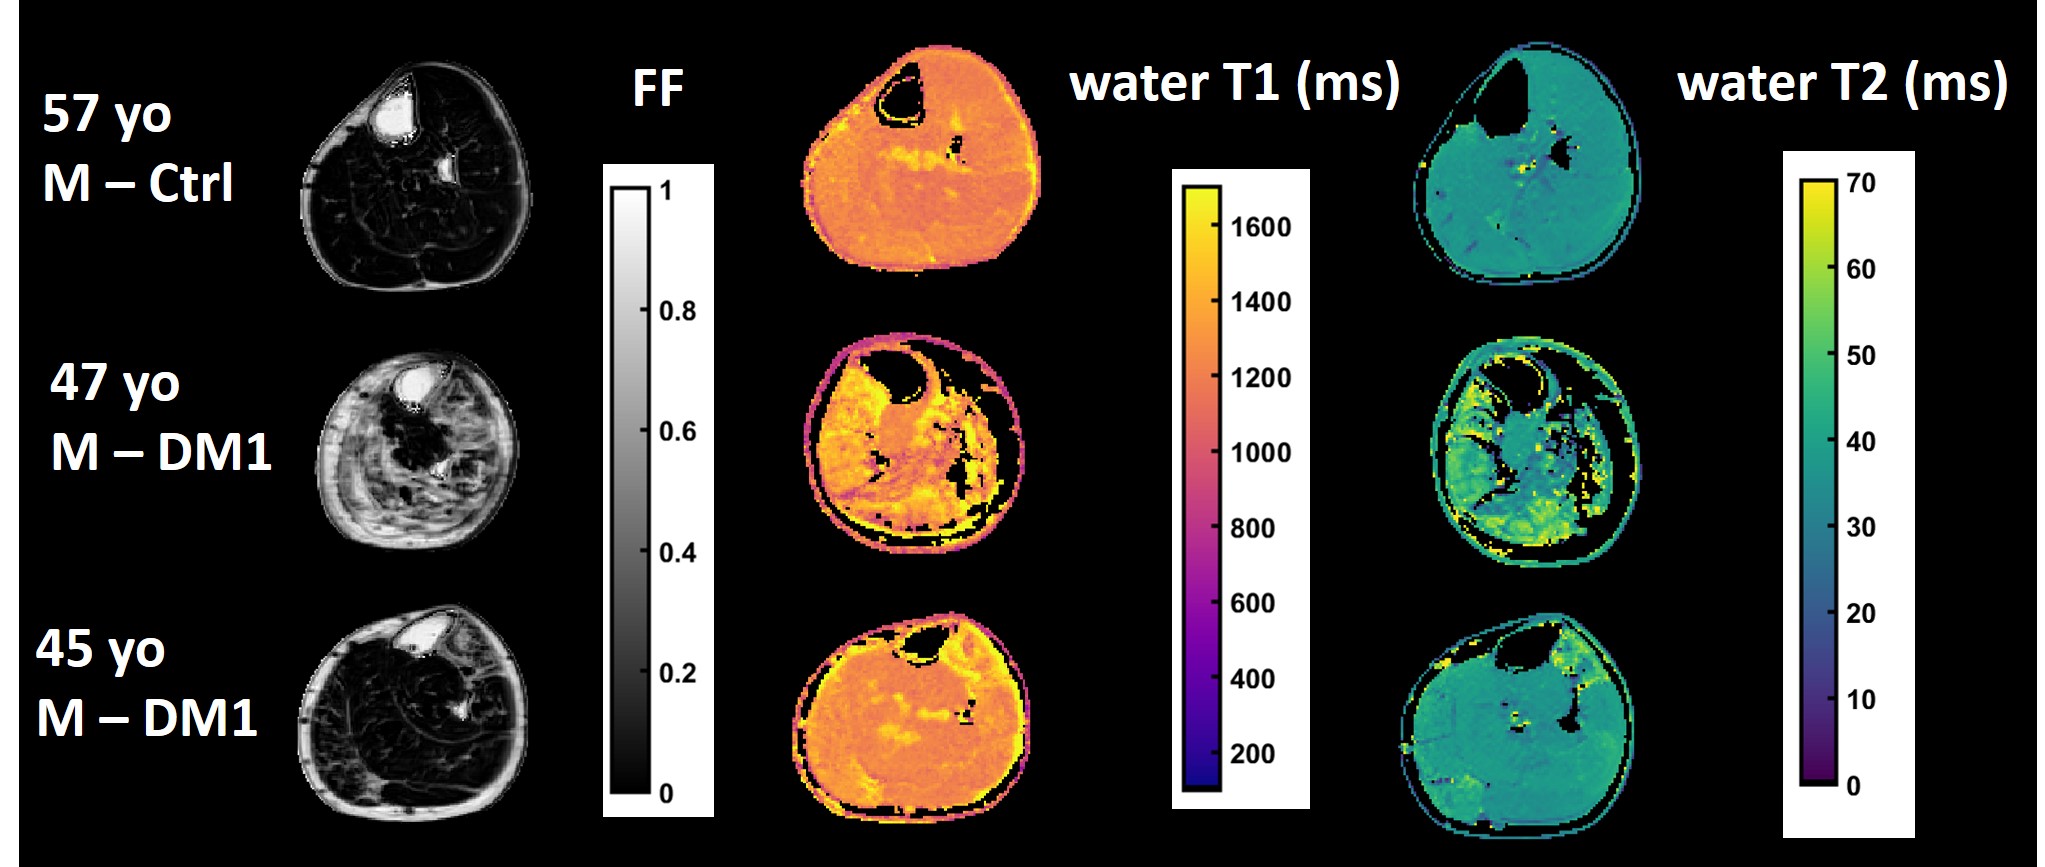
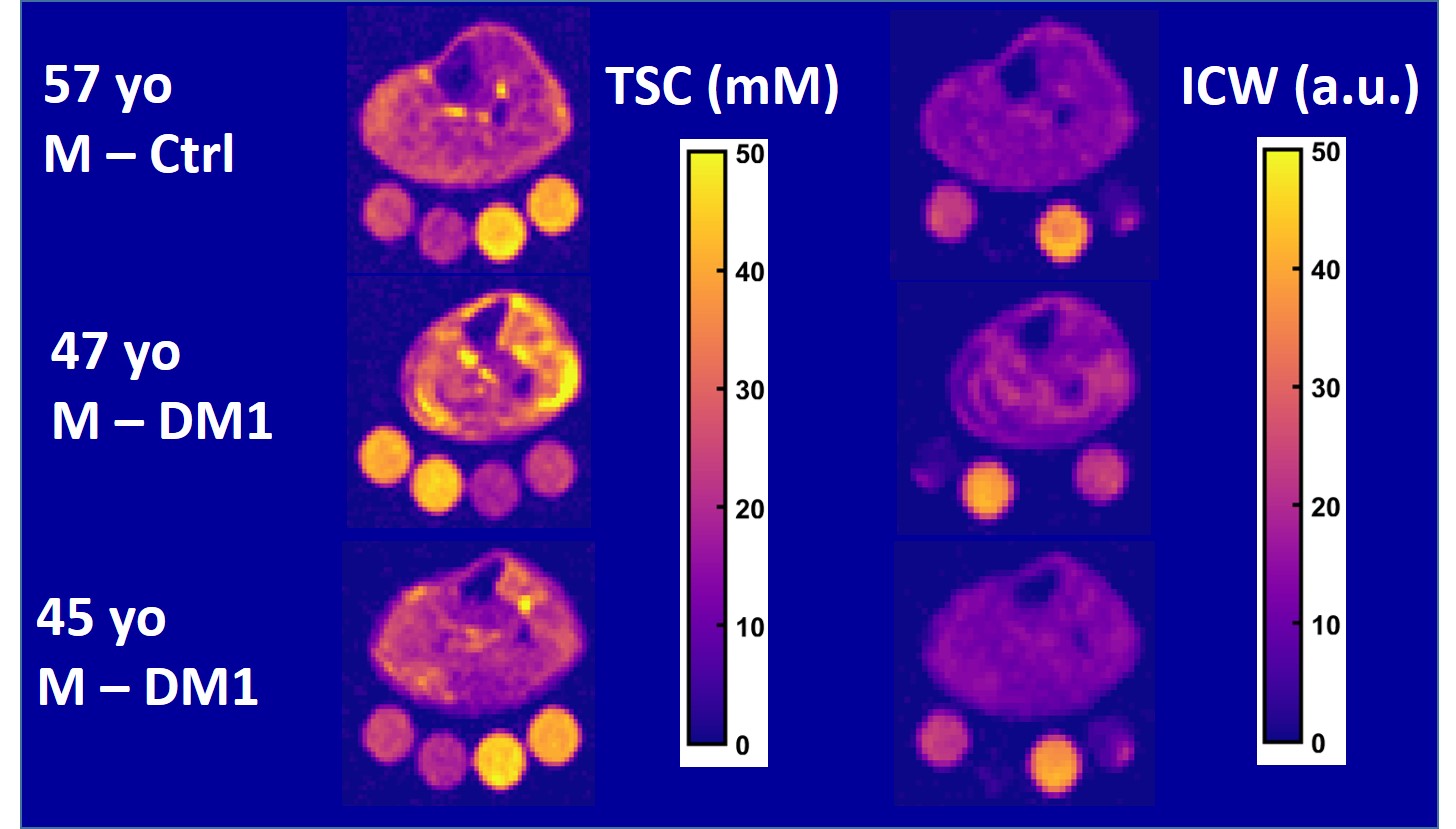
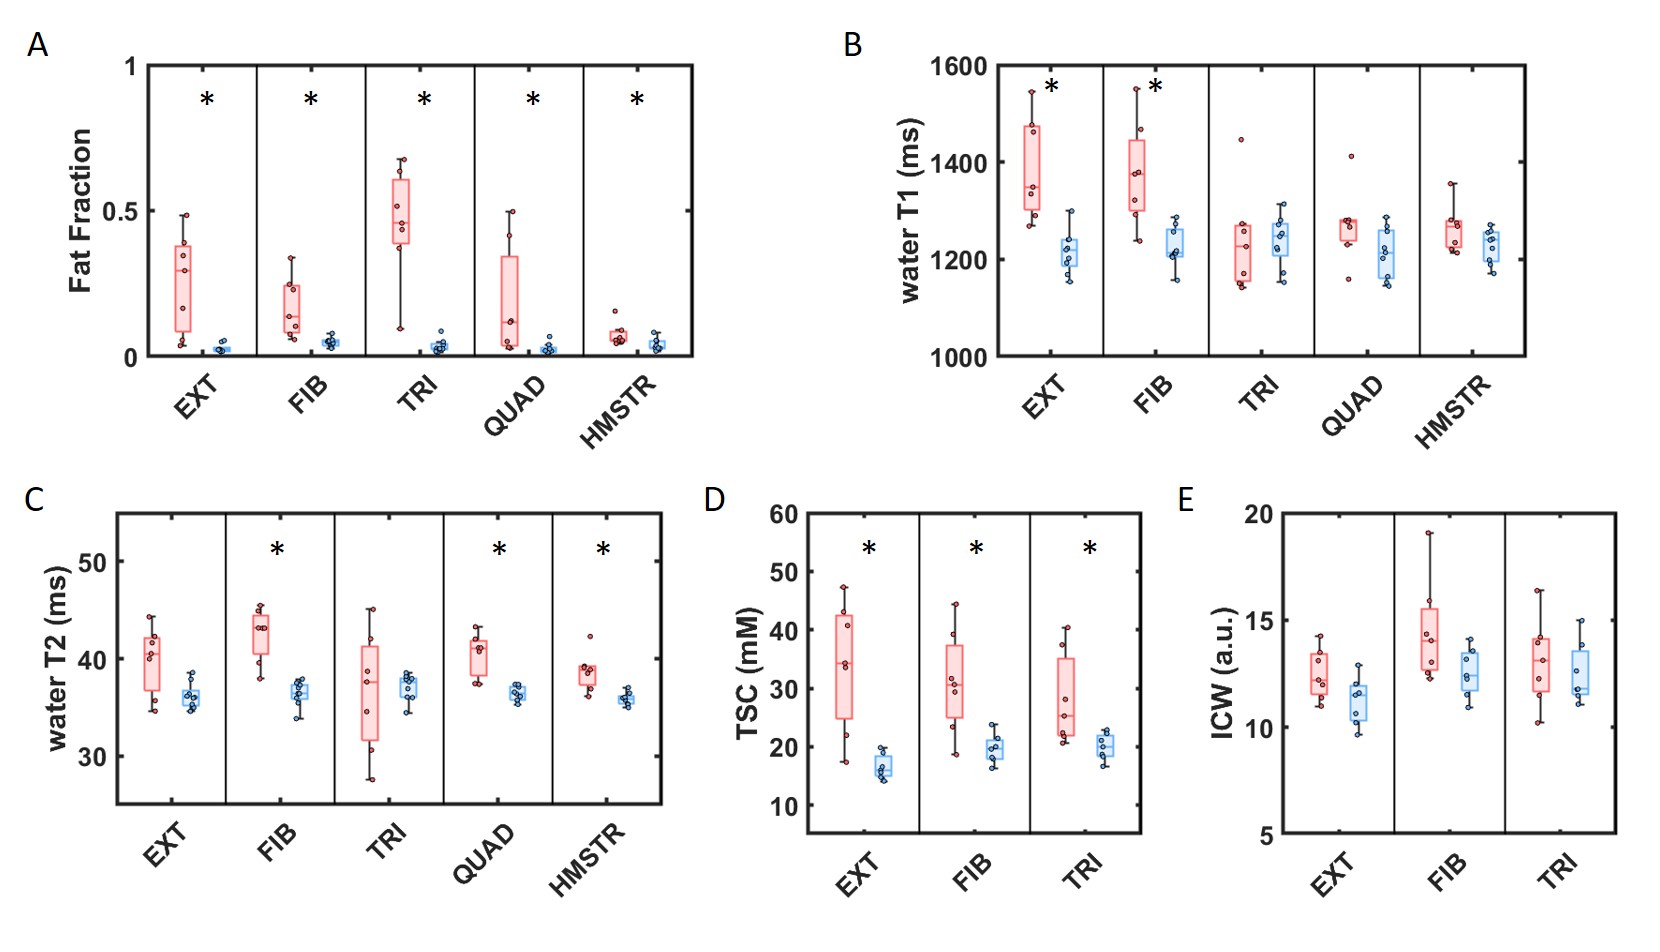
Figure 1 shows representative FF, water T1, water T2 maps obtained in the leg of a healthy control and two participants with DM1 at different levels of disease severity. Figure 2 shows the corresponding TSC and ICW images. In these patients, all indices of disease activity (except ICW) were higher than in healthy controls.All muscles of DM1 patients presented higher FF values than healthy controls (Figure 3-A). FF values in the triceps correlated significantly to the 6MWD (r =-0.90). Water T1, water T2 and TSC were significantly higher in the anterior compartment of the legs (extensor and fibula) of patients with DM1 compared to healthy counterparts while ICW did not show significant differences (Figure 3-B-E). In the thighs, water T2 was significantly higher in the muscles of patients with DM1 while water T1 did not show significant differences. At the muscle group level, all markers of disease activity were correlated (Figure 4-A), except for ICW (data not shown). These indices were the highest in muscles with intermediate FF (Figure 4-B).
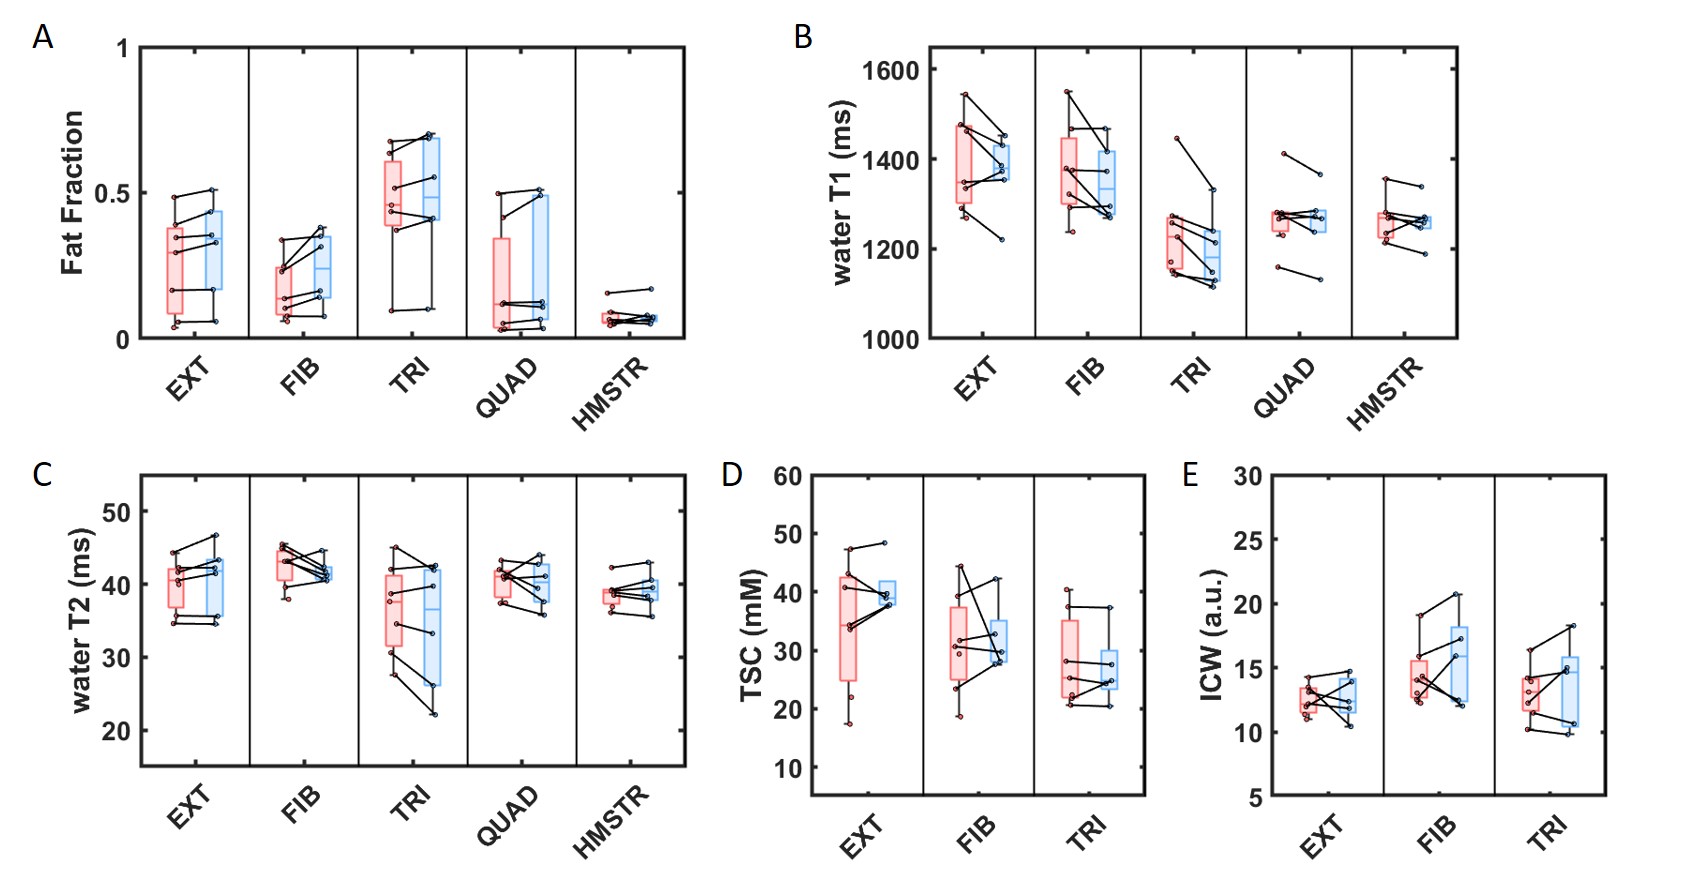
After 12 months, the muscles of patients with DM1 experienced a significant increase of FF of 0.014 [0.002-0.035] (P <.001, Figure 5-A). FF increase did not correlate to the indices of disease activity at baseline. Water T2 values, TSC and ICW values did not show any variation after 12 months (P =.084, P =.516 and P =.328 respectively), while water T1 values significantly decreased by a median value of 28 ms [2.6-52.5ms] (P <.001) (Figure 5-B-E). Water T1 decrease was positively correlated with water T1 value at baseline (r =0.48, P =.007). Functional outcomes remained stable after 12 months (P =.886 and P =.617 for the 6MWD and the MFM score, respectively).
DISCUSSION & CONCLUSION
Quantitative 1H and 23Na MRI-based indices could differentiate DM1 patients from healthy controls. We showed that variables related to disease severity correlated with functional tests and indices related to disease activity (water T1, water T2 and TSC) were increased from the early stage of muscle tissue degeneration and mutually correlated. Over a 12-months metformin treatment interval, despite a significant increase of FF, we observed a significant decrease in water T1. Quantitative MRI variables were more sensitive than functional outcomes to detect disease progression and could represent sensitive biomarkers for assessing early treatment response in clinical trials.Acknowledgements
No acknowledgement found.References
1- Meola et al. Biochimica et Biophysica Acta (BBA) - Molecular Basis of Disease Volume (2015), 1852(4), 594-606
2- Bassez et al., Brain (2018), 141(10):2855-65
3- Heskamp et al., Neurology (2019), 92(24): e2803-e2814
4- Constantidines et al., Radiology (2000), 216(2): 558-68
5- Marty et al., Magn Reson Med (2020); 83(2): 621-34
6- Marty et al., Radiology (2021); 300(3): 652-60
7- Bérard et al., Neuromuscular Disorders (2005) ; 15(7):463-70
8- Glover et al., Magn Reson Med (1991); 18(2): 371-83
9- Azzabou et al., J Magn Reson Imaging (2015); 41(3):645-53
10- Nagel et al., Magn Reson Med (2009); 62:1565-1573
11- Nagel et al, Invest Radiol (2011); 46(12):759-766
12- Gerhalter et al., J Magn Reson Imaging (2019); 50(4):1103-1113
Figures