0094
Contraction characteristics of the triceps surae in muscular diseases assessed by 3D dynamic imaging with synchronized electrical stimulation1Basel Muscle MRI, Department of Biomedical Engineering, University of Basel, Basel, Switzerland, 2Research Coordination Team, Department of Radiology, University Hospital Basel, Basel, Switzerland, 3Advanced Imaging and Radiomics Center, IRCCS Mondino Foundation, Pavia, Italy, 4Cardiovascular MR R&D, Siemens Medical Solutions USA, Inc., Cleveland, OH, United States, 5Department of Brain and Behavioural Sciences, University of Pavia, Pavia, Italy
Synopsis
Keywords: Muscle, Rare disease, Dynamic MRI, Muscle Function
Accelerated three-dimensional. three-directional dynamic acquisition of muscle contraction during electrical muscle stimulation was applied on a cohort of 10 patients with metabolic diseases affecting the muscles and 14 healthy controls. Maximum strain and contraction rates were calculated on the three muscles of the triceps surae.
The strain and the buildup rate (rate to reach maximum strain) showed a clear trend for the differentiation of patients and volunteers, especially in the Soleus muscle.
In conclusion, dynamic muscle MRI during electrical stimulation is a promising marker for muscle health in muscular diseases.
Introduction
Dynamic imaging with synchronized neuromuscular electrical stimulation (NMES) has been successfully applied in healthy volunteers1,2, and, recently, in patients with facioscapulohumeral dystrophy (FSHD), yielding promising results on the possibility of using the derived parameters of strain and contraction and relaxation rates as functional biomarkers of disease3. This latter study, however, was only limited to a single slice acquired in the thigh.In this study, we are expanding the investigation to a wider spectrum of metabolic diseases affecting the skeletal muscle with an exploratory analysis of 10 patients with dystrophic and non-dystrophic myotonias, and 14 volunteers, focusing on time-resolved, three-dimensional acquisition of the triceps surae during electrical muscle stimulation.
Methods
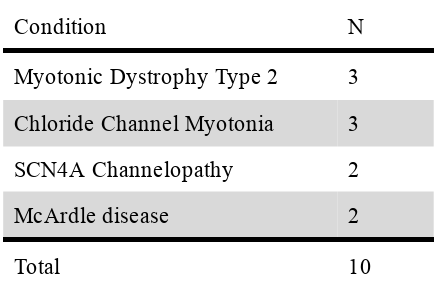
14 healthy volunteers (5 male, median age 50y, range: 35-62) and 10 patients (6 male, median age 46y range: 25-66) were scanned at a clinical 3T MRI scanner (MAGNETOM Skyra, Siemens Healthcare, Erlangen, Germany) during NMES. A summary of the patients’ conditions is presented in table 1.During a preparation phase, two sets of gel-based electrodes were placed on the subject’s right leg. The stimulation intensity was tested, and the evoked force was measured before the scan with a custom-made MR-compatible sensor4, as well as the maximum voluntary force (MVF) in the same position. The stimulation current was established immediately before the scan as the current required to elicit a force of approximately 10% of the MVF.
For the stimulation, a commercial 2-channel EMS device was used to induce periodic muscle contraction of the calf muscles. Biphasic stimulation with rectangular pulses was applied (pulse width: 400 μs, pulse frequency: 80 Hz, contraction duration: 750 ms, release duration: 750 ms release).
During the MR acquisition, the second channel of the stimulator was converted to a trigger signal by a custom electronic device1.
For the dynamic acquisition, a prospectively-gated highly accelerated cartesian 4D flow research sequence using L1-regularized wavelet-based compressed sensing5,6 was placed in a sagittal orientation to cover the whole calf. The imaging protocol had the following parameters: TE/TR 4.1/8.7 ms, flip angle 10°, bandwidth 910 Hz/px, matrix size 128x54x48, resolution 2.3x2.3x2.5 mm³, Venc 15 cm/s, 2 k-space lines per segments, acceleration factor 7.6. The acquisition time was approximately 5 minutes per each dataset.
The velocity datasets were subsequently postprocessed offline to calculate the strain tensor at each spatial location throughout the stimulation cycle1. The three muscles soleus (Sol), gastrocnemius medialis (GM), and gastrocnemius lateralis (GL) were segmented using the computer-assisted segmentation software Dafne7. The maximum positive eigenvalue of the strain tensor was visualized and calculated over the segmented muscles for each subject. Maximum strain, and, additionally, the buildup and release rates (the rates at which the maximum strain is reached after stimulation, or at which the muscle strain returns to baseline after stimulation removal, respectively3) were compared between patients and control over the whole triceps surae using a Wilcoxon rank sum nonparametric test. No inferential statistics were performed on the disaggregated data due to lack of statistical power.
Results
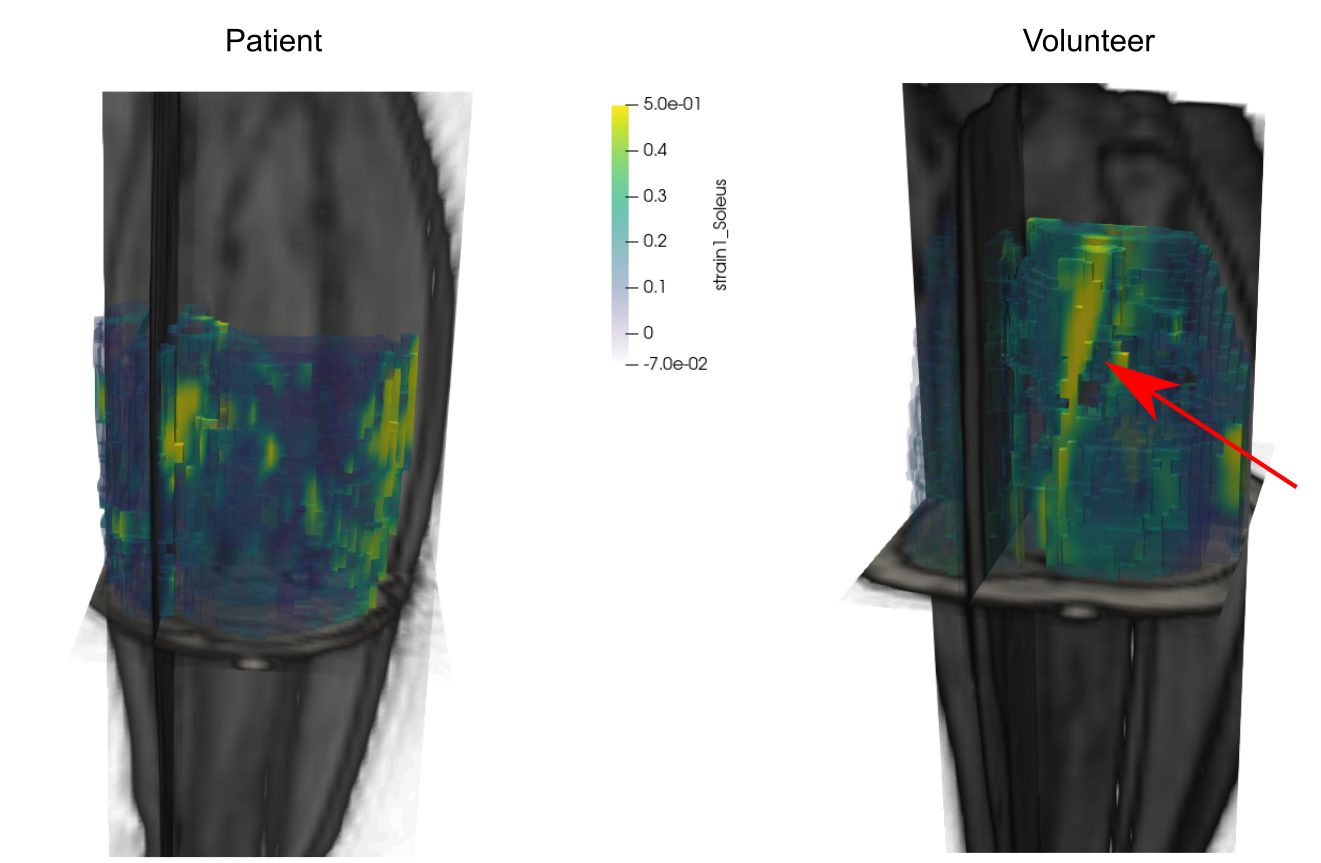
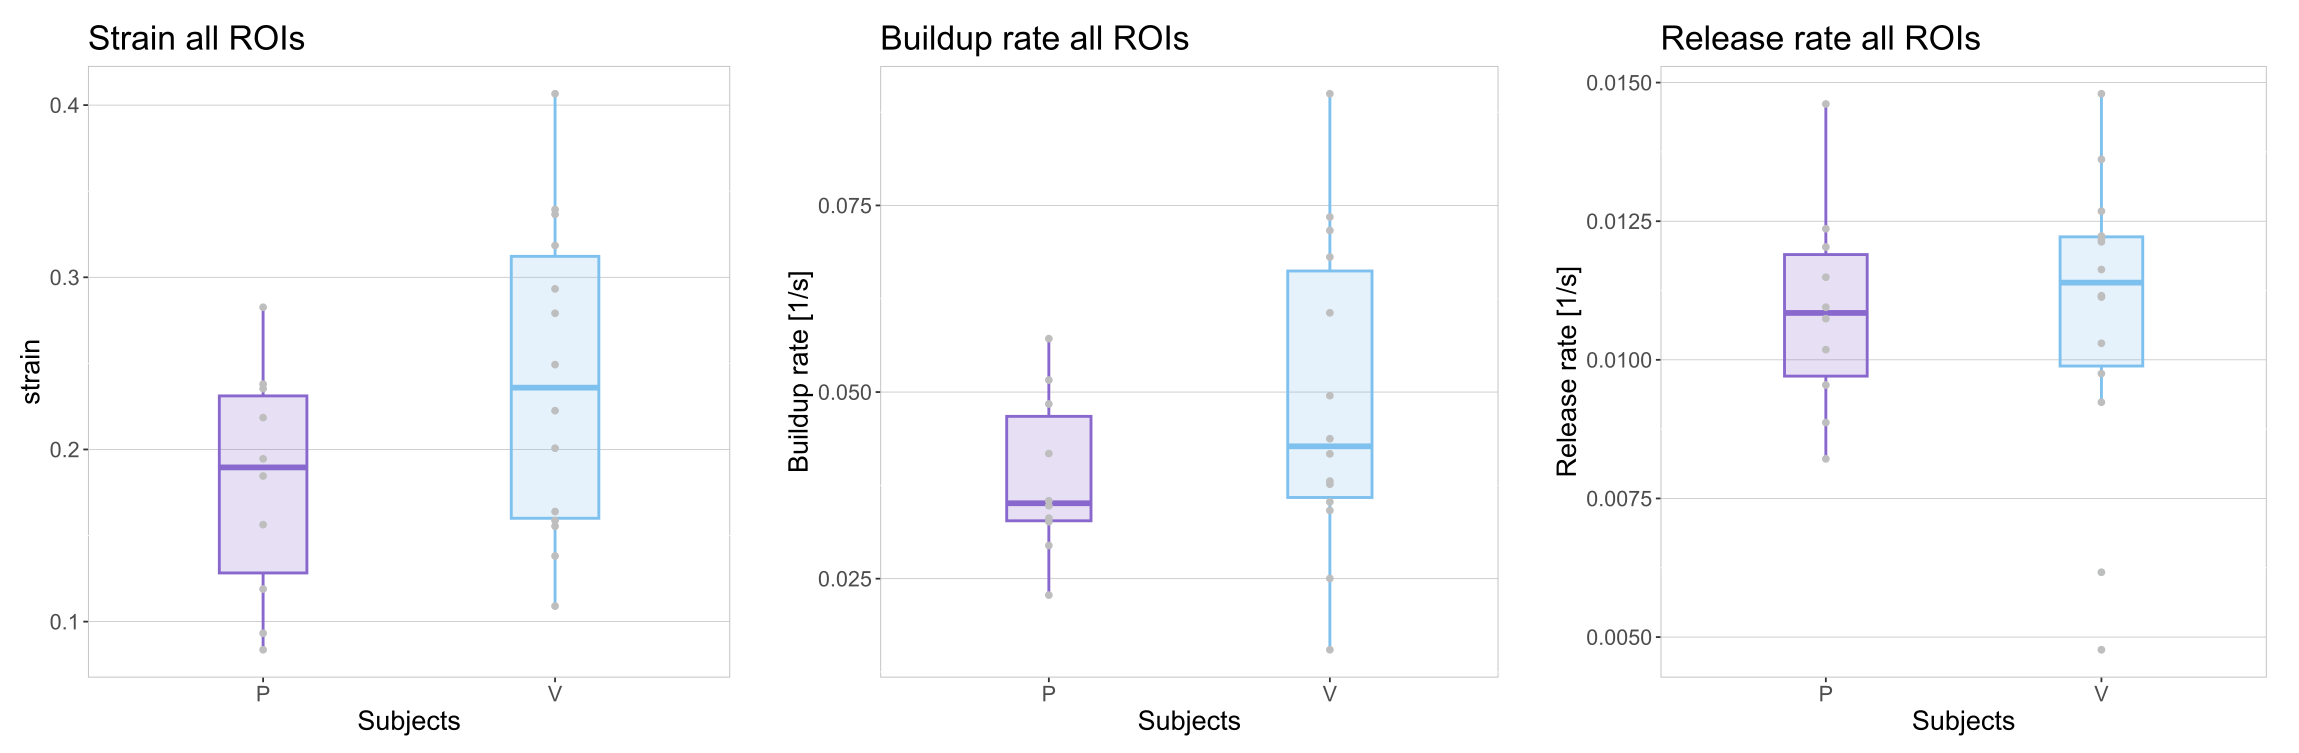
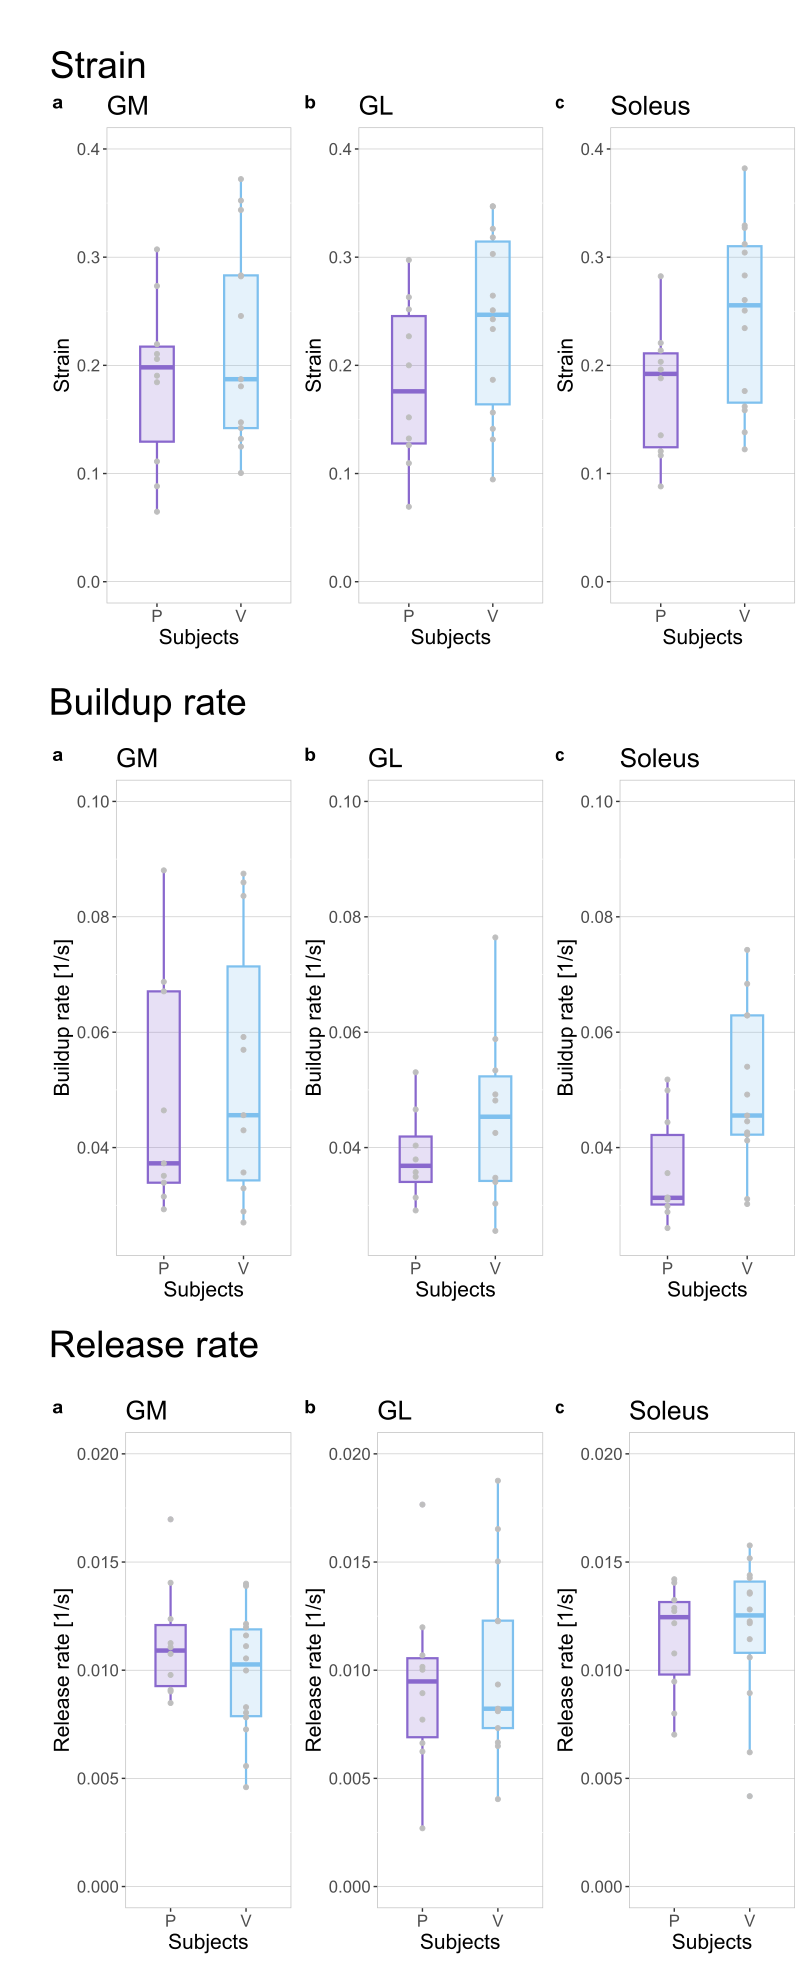
Some qualitatively different patterns could be found between patients and controls, as exemplified in Fig. 1, where a high-strain area appears during the contraction between the center of the two NMES electrodes. Over the whole triceps surae (Fig. 2), both the strain and the buildup rate showed a median increase between patients and healthy controls, with the strain having a median of 0.24 for controls and 0.19 for patients, and the buildup rate having a median of 0.042s-1 for controls and 0.035s-1 for patients. The release rate showed a smaller difference, with 0.0114s-1 for controls and 0.0108s-1 for patients. In all cases, the rank sum test did not reach significance, with the lowest p-value of 0.12 for the strain variable (95% confidence interval of the difference -0.02, 0.13). The disaggregated analysis of the three muscles showed a higher difference in strain and buildup rates in the soleus in comparison with the other muscles (Fig. 3).Discussion
In a patient cohort with metabolic diseases that affect the muscles, we studied the contraction characteristics of the skeletal muscle (triceps surae) during electrical muscle stimulation. Although the examined variables (strain, buildup, and release rates) did not achieve statistical significance between the patient and the control group, some interesting trends could be observed. Specifically, the control group showed elevated maximum averaged strain and buildup rate. In line with previous findings on the aging population2, it is expected that a healthy muscle will respond more readily to electrical stimulation. Similarly, a higher buildup rate corresponds to a faster reach of the contraction plateau, which is also expected in an unimpaired muscle. The main limitation of this study is the relatively small number of patients and the heterogeneity of the diseases considered. Still, the results are encouraging to justify further investigation of muscular function in metabolic diseases with this approach. Future investigations should focus on the soleus as it seems to be the most sensitive indicator for this measure.Acknowledgements
No acknowledgement found.References
1. Deligianni X, Pansini M, Garcia M, et al. Synchronous MRI of muscle motion induced by electrical stimulation. Magn. Reson. Med. 2017;77:664–672 doi: 10.1002/mrm.26154.
2. Deligianni X, Klenk C, Place N, et al. Dynamic MR imaging of the skeletal muscle in young and senior volunteers during synchronized minimal neuromuscular electrical stimulation. Magn. Reson. Mater. Phys. Biol. Med. 2020;33:393–400 doi: 10.1007/s10334-019-00787-7.
3. Deligianni X, Santini F, Paoletti M, et al. Dynamic magnetic resonance imaging of muscle contraction in facioscapulohumeral muscular dystrophy. Sci. Rep. 2022;12:7250 doi: 10.1038/s41598-022-11147-2.
4. Santini F, Bieri O, Deligianni X. OpenForce MR: A low-cost open-source MR-compatible force sensor. Concepts Magn. Reson. Part B Magn. Reson. Eng. 2018;48B:e21404 doi: 10.1002/cmr.b.21404.
5. Liang D, King K, Liu B, Ying L. Accelerating SENSE using distributed compressed sensing. In: Proceedings 17th Scientific Meeting, International Society for Magnetic Resonance in Medicine, Honolulu. ; 2009. p. 377.
6. Liu J, Rapin J, Chang T, et al. Dynamic cardiac MRI reconstruction with weighted redundant Haar wavelets (abstr). Proc Int Soc Magn Reson Med 2012;67.
7. Dafne. https://www.dafne.network/. Accessed October 25, 2022.
Figures