0092
Repeatability and Sensitivity of qDESS T2 Mapping of Cartilage1Orthopaedic Surgery, Stanford University, Stanford, CA, United States, 2Department of Radiology, Stanford University, Stanford, CA, United States
Synopsis
Keywords: Cartilage, Relaxometry, Repeatability, T2, qDESS
Intra- and inter-day repeatabilities of qDESS T2 in knee cartilage, assessed by fully-automatic segmentation using a deep-learning, open-source framework for musculoskeletal MRI analysis (DOSMA) and also by manual segmentation of tread mark regions of known tibiofemoral contact areas, were assessed and compared in 10 uninjured participants. qDESS T2 RMSA-CVs were less than 6% for all ROIs examined and showed good to excellent ICCs for the majority of ROIs assessed. A preliminary sensitivity analysis found that both segmentation schemes detected significant T2 changes over time in lateral tibial cartilage while only DOSMA segmentation detected T2 change to medial tibial cartilage.PURPOSE
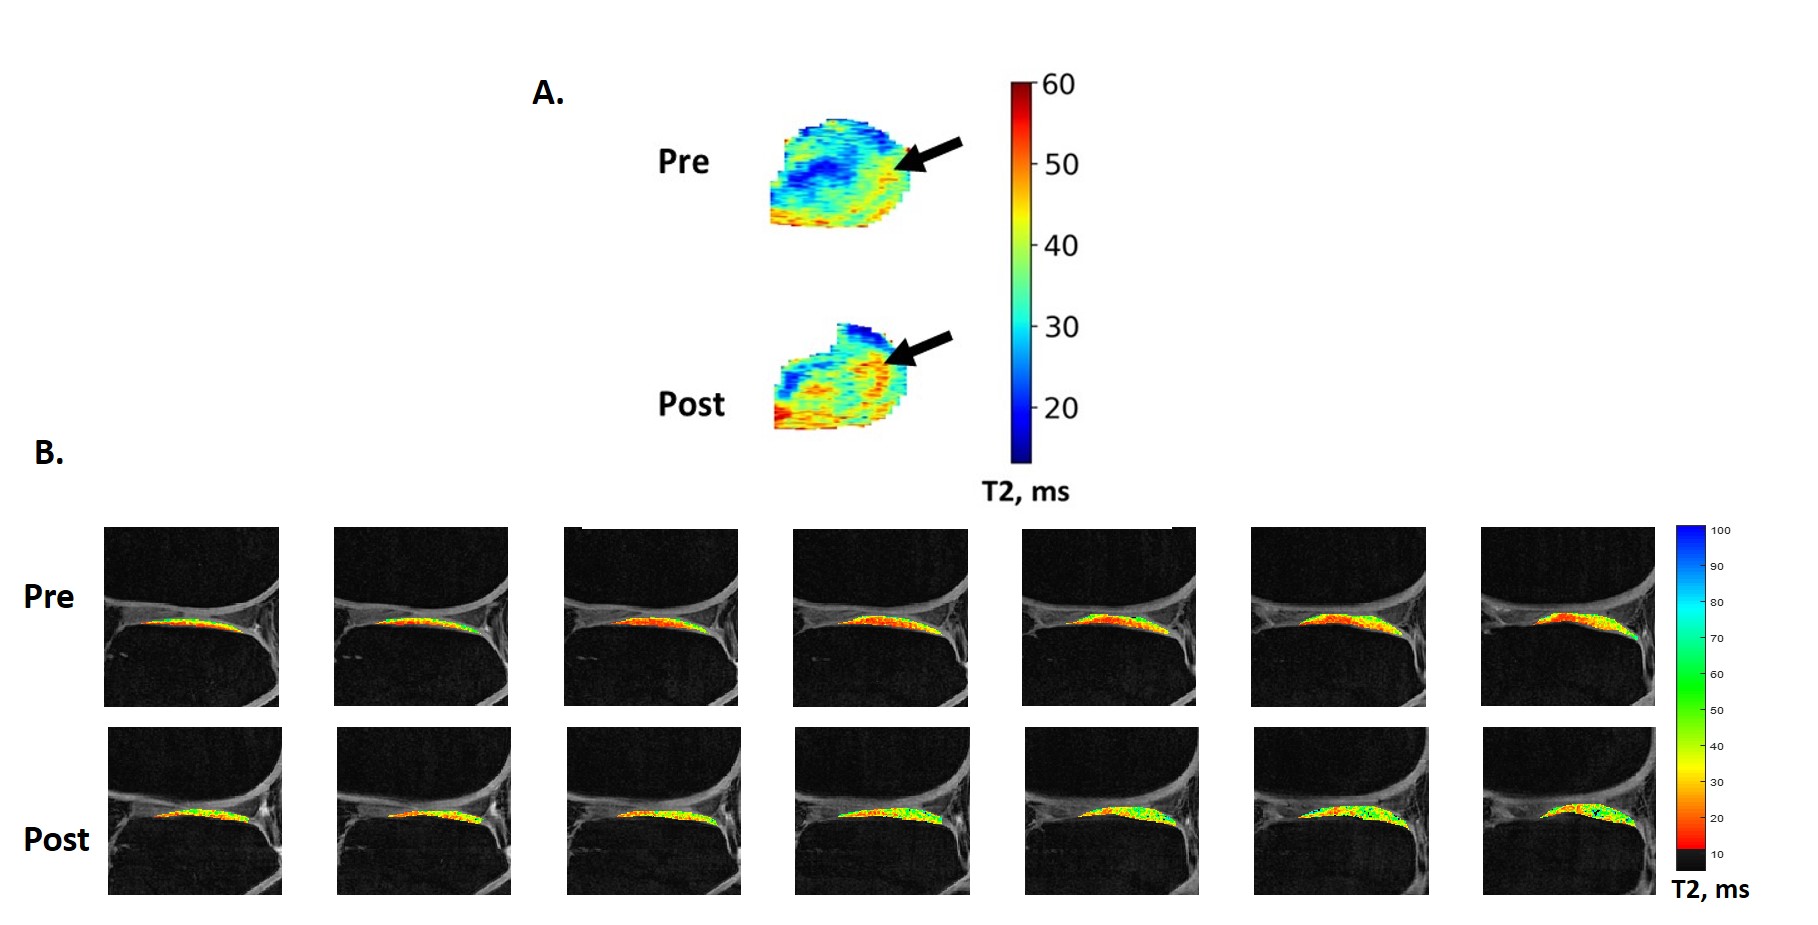
Compositional cartilage imaging can be used to detect osteoarthritis (OA)1 as well as joints at heightened risk of developing OA, termed “pre-OA”.2; 3 Quantitative double-echo steady state (qDESS) T2 mapping of knee cartilage is attractive because of its short acquisition time (~5min) and high resolution,4 its capacity to be implemented across different vendor platforms,5 and its demonstrated ability to distinguish between different radiographic OA grades.6 Importantly, fully automatic and accurate cartilage segmentation for 3T qDESS acquisitions has recently been developed,5; 7; 8 is freely available,9 and can be used to quantitate regional T2 values in several, broad, pre-determined regions of interest (ROIs) across each knee surface. Alternatively, manual segmentation of focal tibiofemoral strips of cartilage (which we term “tread mark” ROIs and which are largely consistent with known regions of cartilage contact during common daily activities10) have been shown to detect cartilage compositional changes in patients with anterior cruciate ligament reconstruction (ACLR).11 Alteration to the distribution of load following ACLR12 is thought to contribute to cartilage compositional changes observed in this population13-16 and affects some areas of cartilage more than others.17 Therefore, the primary goal of this work is to examine the combined acquisition and segmentation repeatability of qDESS T2 measures with 2 different tibiofemoral regional analysis schemes: 1) fully-automatic segmentation using a deep-learning, open-source framework for musculoskeletal MRI analysis (DOSMA),9 and 2) manual segmentation of tread mark regions of tibiofemoral contact areas. This work also seeks to compare the relative sensitivities of qDESS T2 derived by each of the segmentation schemes to detect longitudinal changes to cartilage composition in a preliminary analysis of image data from an ongoing clinical interventional trial in an ACLR population.METHODS
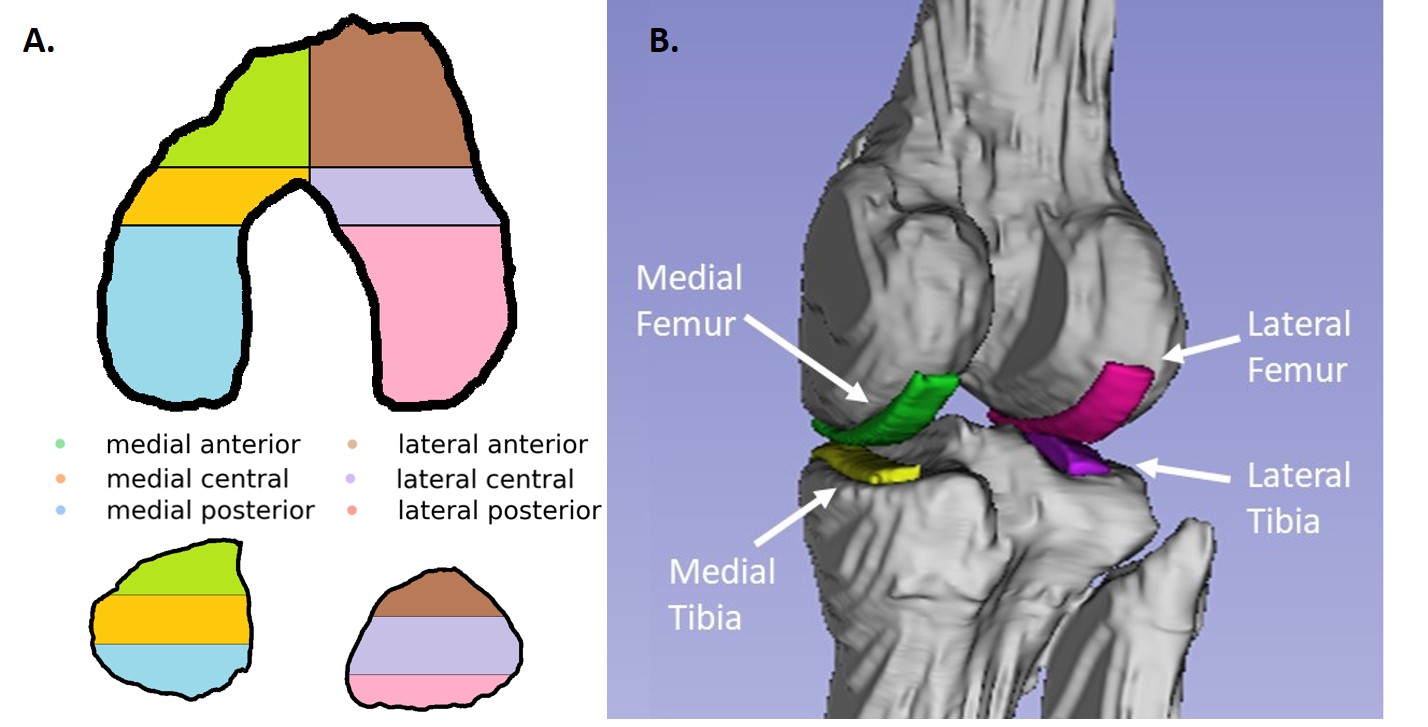
Twenty-five participants: 11 uninjured controls (8 females; mean age: 28 (standard deviation (SD): 3) years) and 14 patients with ACLR (8 females; mean age: 29 (SD: 6) years; 2.2 (SD: 0.4) years post-ACLR) consented to participate in these IRB-approved studies and underwent 2-3 separate 3T MRI examinations (GE Healthcare) of the knee. T2 maps were generated from a quantitative double-echo in steady state (qDESS) sequence (TR/TEs: 21/6.7, 34.8 ms; FA 20°, 0.42x0.42 mm resolution; 1.5 mm slice thickness).18 Average T2 values from full-thickness tibiofemoral cartilage were determined 2 ways: 1) fully automatic segmentation of 6 femoral and 6 tibial ROIs using DOSMA and Python, Figure 1A,9 and 2) manual segmentation of 4 tread mark ROIs11 (10.5 mm wide) in medial and lateral femoral and tibial cartilage from 7 contiguous slices with custom software (MATLAB, TheMathWorks), Figure 1B. Inter-scan reproducibility was derived from the root-mean-square average coefficients of variation (%RMSA-CV) for each ROI: √((∑CV2)/n)*100, where intra-participant CV was calculated as SD/average of test and retest measures for each ROI, and n is number of participants. Reliability of qDESS T2 measures was assessed with intraclass correlation coefficient (ICC) estimates and their 95% confidence intervals based on an absolute agreement, 2-way random-effects model. ICC values <0.5 were considered poor; 0.5-0.75 moderate; ≥0.75–0.9 good; ≥0.9 excellent.19 Inter-scan precision was determined from the median of intra-participant SDs for each ROI. A preliminary sensitivity analysis of longitudinal T2 change detected by each segmentation scheme was conducted in ACLR participants before and 6 months after completing a gait retraining intervention intended to reduce medial knee compartment loading (DOD W81XWH-18-1-0590).20 Pre- and post-intervention T2 change was assessed with paired t-tests (paired Wilcoxon Signed Rank (WSR) test for non-normal distributions). Statistical analyses were performed with SPSS (v25, IBM).RESULTS
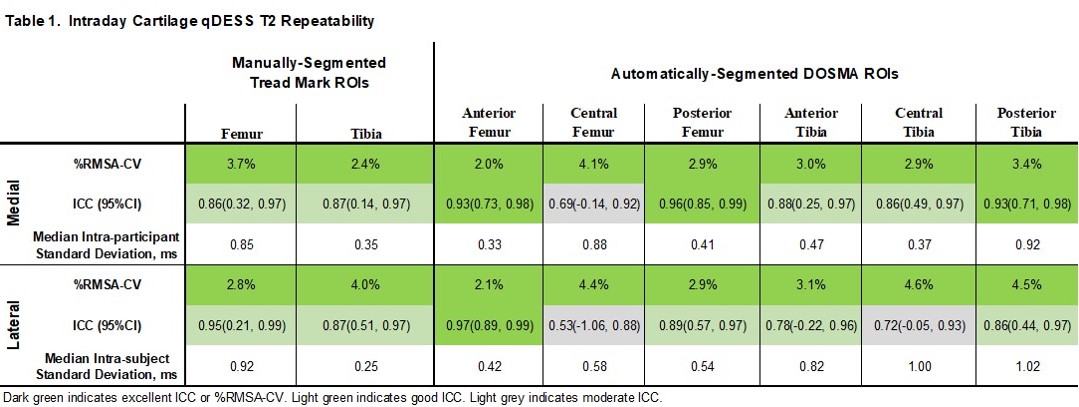
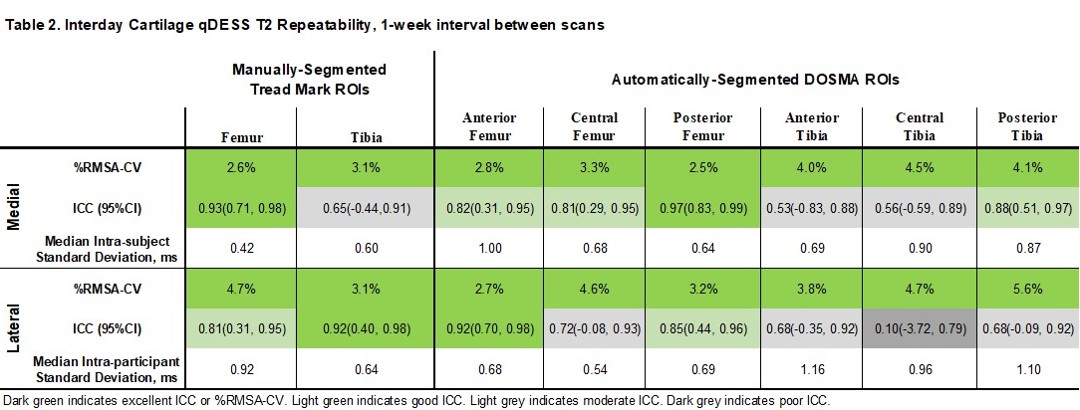
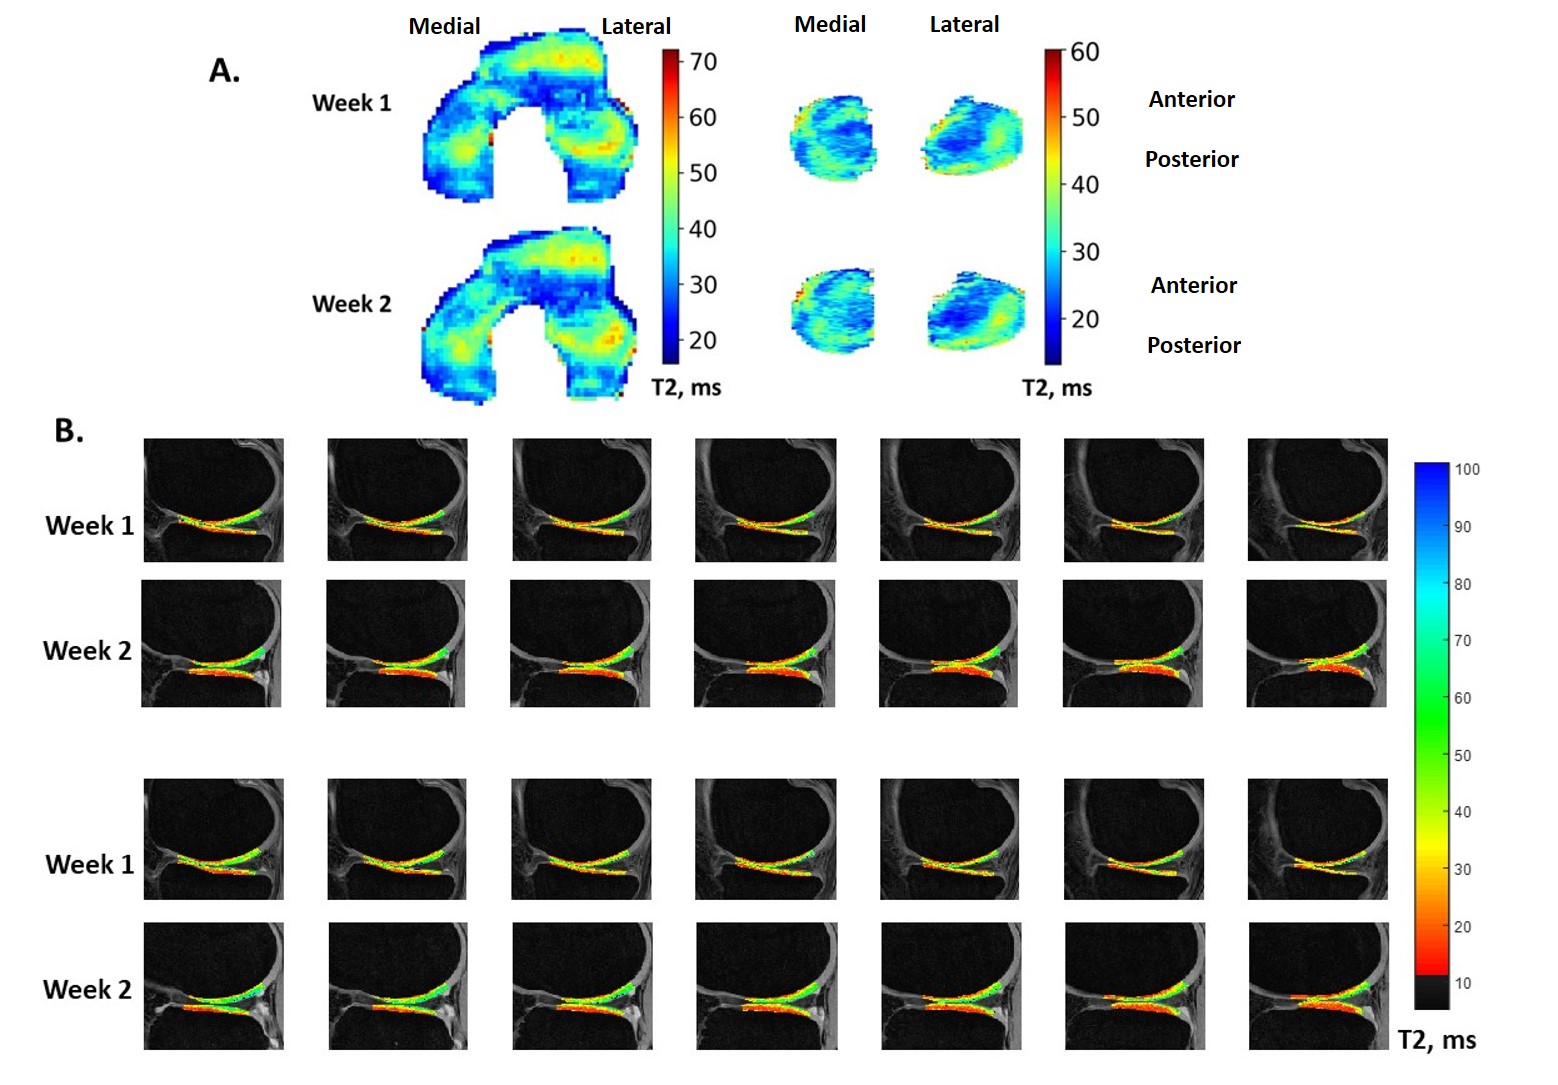
Table 1 lists intraday results from 10/11 controls who were scanned twice in one day with a brief pause out of the scanner for coil repositioning. Table 2 lists interday results from 10/11 controls who were scanned twice with a 1-week interval between scans (mean interval 7.7 (SD 2.6) days). Figure 2 shows sample T2 maps produced by each scheme. T2 increases were detected in the lateral tibial plateau of ACLR participants across the gait-retraining intervention with both segmentation schemes: an 8% T2 increase was detected in the manually-segmented lateral tibial tread mark (WSR p=0.030), while a 5% increase was detected in DOSMA-segmented anterior lateral tibial cartilage (mean difference=1.43 ms, 95%CI (0.42, 2.44) ms, p=0.009), Figure 3. Additionally, DOSMA detected a 7% T2 increase in central medial tibial cartilage (WSR p=0.041).DISCUSSION
Regional qDESS T2 repeatability assessments showed excellent1 RMSA-CVs of less than 6% for all ROIs examined and good to excellent ICCs for the majority of ROIs assessed by each segmentation scheme. Manually-segmented tread mark T2s had similar RMSA-CVs and ICCs compared to automatically-segmented DOSMA T2s, albeit in somewhat differently sized and placed ROIs. These regional ROI results are broadly consistent with previously reported single-slice4 and global qDESS T2 repeatability values.21 The preliminary sensitivity analysis found that both segmentation schemes detected significant T2 changes over time in lateral tibial cartilage while only DOSMA segmentation detected T2 change to medial tibial cartilage. This discrepancy can help to inform where to look for mechanically-mediated cartilage compositional change in further investigations of ACLR knees.CONCLUSION
Cartilage T2 measured from qDESS acquisitions with manual tread mark or automatic DOSMA segmentation both show good to excellent repeatability and are sensitive to cartilage compositional change in ACLR knees.Acknowledgements
NIH RO1 AR052784 (PI-Chu), R01 EB002524 (PI-Gold), R01 AR077604 (PI-Hargreaves), and P41 EB027060 (PI-Delp); Philips and GE Healthcare; and DOD W81XWH-18-1-0590 (PI-Chu).References
1. MacKay JW, Low SBL, Smith TO, et al. 2018. Systematic review and meta-analysis of the reliability and discriminative validity of cartilage compositional MRI in knee osteoarthritis. Osteoarthritis Cartilage 26(9):1140-1152.
2. Chu CR, Williams AA, Coyle CH, et al. 2012. Early diagnosis to enable early treatment of pre-osteoarthritis. Arthritis Res Ther 14(3):212.
3. Chu CR, Williams AA, Erhart-Hledik JC, et al. 2021. Visualizing pre-osteoarthritis: Integrating MRI UTE-T2* with mechanics and biology to combat osteoarthritis-The 2019 Elizabeth Winston Lanier Kappa Delta Award. J Orthop Res 39(8):1585-1595.
4. Chaudhari AS, Black MS, Eijgenraam S, et al. 2018. Five-minute knee MRI for simultaneous morphometry and T2 relaxometry of cartilage and meniscus and for semiquantitative radiological assessment using double-echo in steady-state at 3T. J Magn Reson Imaging 47(5):1328-1341.
5. Schmidt AM, Desai AD, Watkins LE, et al. 2022. Generalizability of Deep Learning Segmentation Algorithms for Automated Assessment of Cartilage Morphology and MRI Relaxometry. J Magn Reson Imaging.
6. Eijgenraam SM, Chaudhari AS, Reijman M, et al. 2020. Time-saving opportunities in knee osteoarthritis: T2 mapping and structural imaging of the knee using a single 5-min MRI scan. Eur Radiol 30(4):2231-2240.
7. Desai AD, Barbieri M, Mazzoli V, et al. 2019. DOSMA: A deep-learning, open-source framework for musculoskeletal MRI analysis. Proc Intl Soc Mag Reson Med, Montreal, Canada, 27.
8. Desai AD, Caliva F, Iriondo C, et al. 2021. The International Workshop on Osteoarthritis Imaging Knee MRI Segmentation Challenge: A Multi-Institute Evaluation and Analysis Framework on a Standardized Dataset. Radiol Artif Intell 3(3):e200078.
9. Desai AD. 2019. DOSMA. https://githubcom/ad12/DOSMA.
10. Thomeer LT, Guan S, Gray HA, et al. 2022. Articular contact motion at the knee during daily activities. J Orthop Res 40(8):1756-1769.
11. Williams AA, Titchenal MR, Do BH, et al. 2019. MRI UTE-T2* shows high incidence of cartilage subsurface matrix changes 2 years after ACL reconstruction. J Orthop Res 37(2):370-377.
12. Andriacchi TP, Favre J, Erhart-Hledik JC, et al. 2015. A systems view of risk factors for knee osteoarthritis reveals insights into the pathogenesis of the disease. Ann Biomed Eng 43(2):376-387.
13. Teng HL, Wu D, Su F, et al. 2017. Gait Characteristics Associated With a Greater Increase in Medial Knee Cartilage T1rho and T2 Relaxation Times in Patients Undergoing Anterior Cruciate Ligament Reconstruction. Am J Sports Med 45(14):3262-3271.
14. Titchenal MR, Williams AA, Chehab EF, et al. 2018. Cartilage Subsurface Changes to Magnetic Resonance Imaging UTE-T2* 2 Years After Anterior Cruciate Ligament Reconstruction Correlate With Walking Mechanics Associated With Knee Osteoarthritis. Am J Sports Med 46(3):565-572.
15. Williams AA, Titchenal MR, Andriacchi TP, et al. 2018. MRI UTE-T2* profile characteristics correlate to walking mechanics and patient reported outcomes 2 years after ACL reconstruction. Osteoarthritis Cartilage 26(4):569-579.
16. Williams JR, Neal K, Alfayyadh A, et al. 2022. Knee cartilage T2 relaxation times 3 months after ACL reconstruction are associated with knee gait variables linked to knee osteoarthritis. J Orthop Res 40(1):252-259.
17. Su F, Hilton JF, Nardo L, et al. 2013. Cartilage morphology and T1rho and T2 quantification in ACL-reconstructed knees: a 2-year follow-up. Osteoarthritis Cartilage 21(8):1058-1067.
18. Sveinsson B, Chaudhari AS, Gold GE, et al. 2017. A simple analytic method for estimating T2 in the knee from DESS. Magn Reson Imaging 38:63-70.
19. Koo TK, Li MY. 2016. A Guideline of Selecting and Reporting Intraclass Correlation Coefficients for Reliability Research. J Chiropr Med 15(2):155-163.
20. He J, Mahtani GB, Chu CR. 2022. Is Remote Active Feedback Gait Retraining Comparable to In-Person Retraining 2 Years Post Anterior Cruciate Ligament Reconstruction? OARSI World Congress, Berlin, Germany, 30:S153.
21. Asay JL, Gatti AA, Desai AD, et al. 2022. Repeatability of Cartilage T2 relaxation times measures at 3T and 7T using quantitative double-echo in steady-state. Proc Intl Soc Mag Reson Med, Montreal, London, UK.
Figures