0086
Automated, reference-free quantification of cortical bone parameters detects impairments in postmenopausal osteoporosis1Radiology, University of Pennsylvania, Philadelphia, PA, United States, 2Bioengineering, University of Pennsylvania, Philadelphia, PA, United States, 3School of Electronics, Kyungpook National University, Daegu, Korea, Republic of, 4Endocrinology, University of Pennsylvania, Philadelphia, PA, United States, 5Data Science, Worcester Polytechnic Institute, Worcester, MA, United States
Synopsis
Keywords: Bone, Aging, Osteoporosis, Porosity, ultrashort echo time
While ultrashort echo time (UTE) measures of pore water have shown promise in assessing cortical bone porosity, most are hindered by the need for complicated processing and reference samples. The suppression ratio (SR) is a marker of porosity which is simply calculated as the voxel-wise ratio of two UTE magnitude images, one without and with long-T2 suppression. Automated cortical bone segmentation via deep learning showed elevated SR in postmenopausal women with osteoporosis (P=0.001) and was strongly associated with pore water density (R=0.93) and with pQCT BMD (R=-0.88). Results suggest that SR can detect elevated porosity in postmenopausal osteoporosis.INTRODUCTION
The mainstay of osteoporotic fracture risk prediction is bone mineral density (BMD) assessed by dual-energy X-ray absorptiometry (DXA) at the hip and spine. However, DXA is unable to distinguish cortical bone (CB) from trabecular bone, nor can it distinguish between the morphological and microstructural properties of bone, which are major contributors to bone strength{1, 2}. CB comprises 80% of whole-body bony mass and antiosteoporotic medications affect cortical and trabecular compartments differently{3-5}. Furthermore, CB area (morphology) and porosity (microstructure) measures have been shown to predict incident fractures independent of DXA, age, sex, height, or weight{6, 7}. Although CB morphology is comparatively easier to quantify in vivo, porosity is more challenging. While porosity has traditionally been measured with HR-pQCT in the peripheral skeleton{8}, advances in ultrashort echo time (UTE) sequences enable measurement of previously undetectable short-T2 species in CB and have inspired several methods to quantify surrogates of porosity{9-12}. These techniques work by differentiating the two chemically distinct water pools, pore water (PW) and bound water (BW), based on their different T2s{9-12}. PW measures have been shown in cadavers to be predictive of bone strength{13-15} and density{13-15}, and our group recently showed that osteoporotic women have elevated PW{16}. However, PW quantification typically requires either an external reference and accounting for differences in T1s/T2s{12}, or it requires long scan times and ill-posed multiexponential calculation{10}. Additionally, manual segmentation of CB is laborious and impractical in the clinic. The suppression ratio (SR) was previously proposed in the authors’ lab as a biomarker of porosity and is simply calculated as the ratio of two UTE sequences, one with and one without inversion-recovery long-T2 suppression{17}. While the SR has been largely unexplored due to long scan times for 3D IR-UTE sequences, the development of fast variable-flip-angle (VFA)-IR-UTE sequences enables SR calculation in clinically feasibly acquisition times{18}. The goal of this was two-fold: (a) to develop an algorithm for automated CB segmentation, and (b) to investigate SR as a possible biomarker for porosity in postmenopausal osteoporosis.METHODS
We retrospectively analyzed data in 3 participant groups evaluated in a recent study by the authors{16}: [1] 10 healthy, young participants (30.0±2.1 years), [2] 9 postmenopausal, non-osteoporotic (62.6±6.0 years), and [3] 9 postmenopausal, osteoporotic (63.5±5.9 years). Osteoporosis was defined as any DXA T-score≤-2.5. Data had been acquired previously in the mid-tibia at 3T with two custom sequences{12}, an 8-minute 3D UTE (Sunsuppressed) and a 6-minute 3D VFA-IR-UTE with long-T2 suppression (Ssuppressed){12, 18}, were acquired. The SR was computed voxel-wise as{17}:$$Suppression Ratio (SR) = \frac{S_{unsuppressed}}{S_{suppressed}} = \frac{S_{UTE}}{S_{IR-UTE}} \approx \frac{TW}{BW}=\frac{1}{1-\frac{PW}{TW}}$$
where total water (TW) = PW+BW{12}. The theoretical relationship between PW and SR is expected to be non-linear. PW was computed as previously reported{16} by referencing the CB signal to that of a nearby reference sample with known relaxation parameters. pQCT data at the mid-tibia and DXA at the hip were also available. Cortical area fraction (CAF) was calculated as the ratio of the cortical area over the periosteal area. Manual contouring was performed on the second echo UTE image. A U-Net neural network{19} was trained to automatically segment the bone on other data, and all data reported herein serve as never-before-seen test dataset. Significance was determined via one-way ANOVA in JMP16.0, with significance at P<0.05.
RESULTS
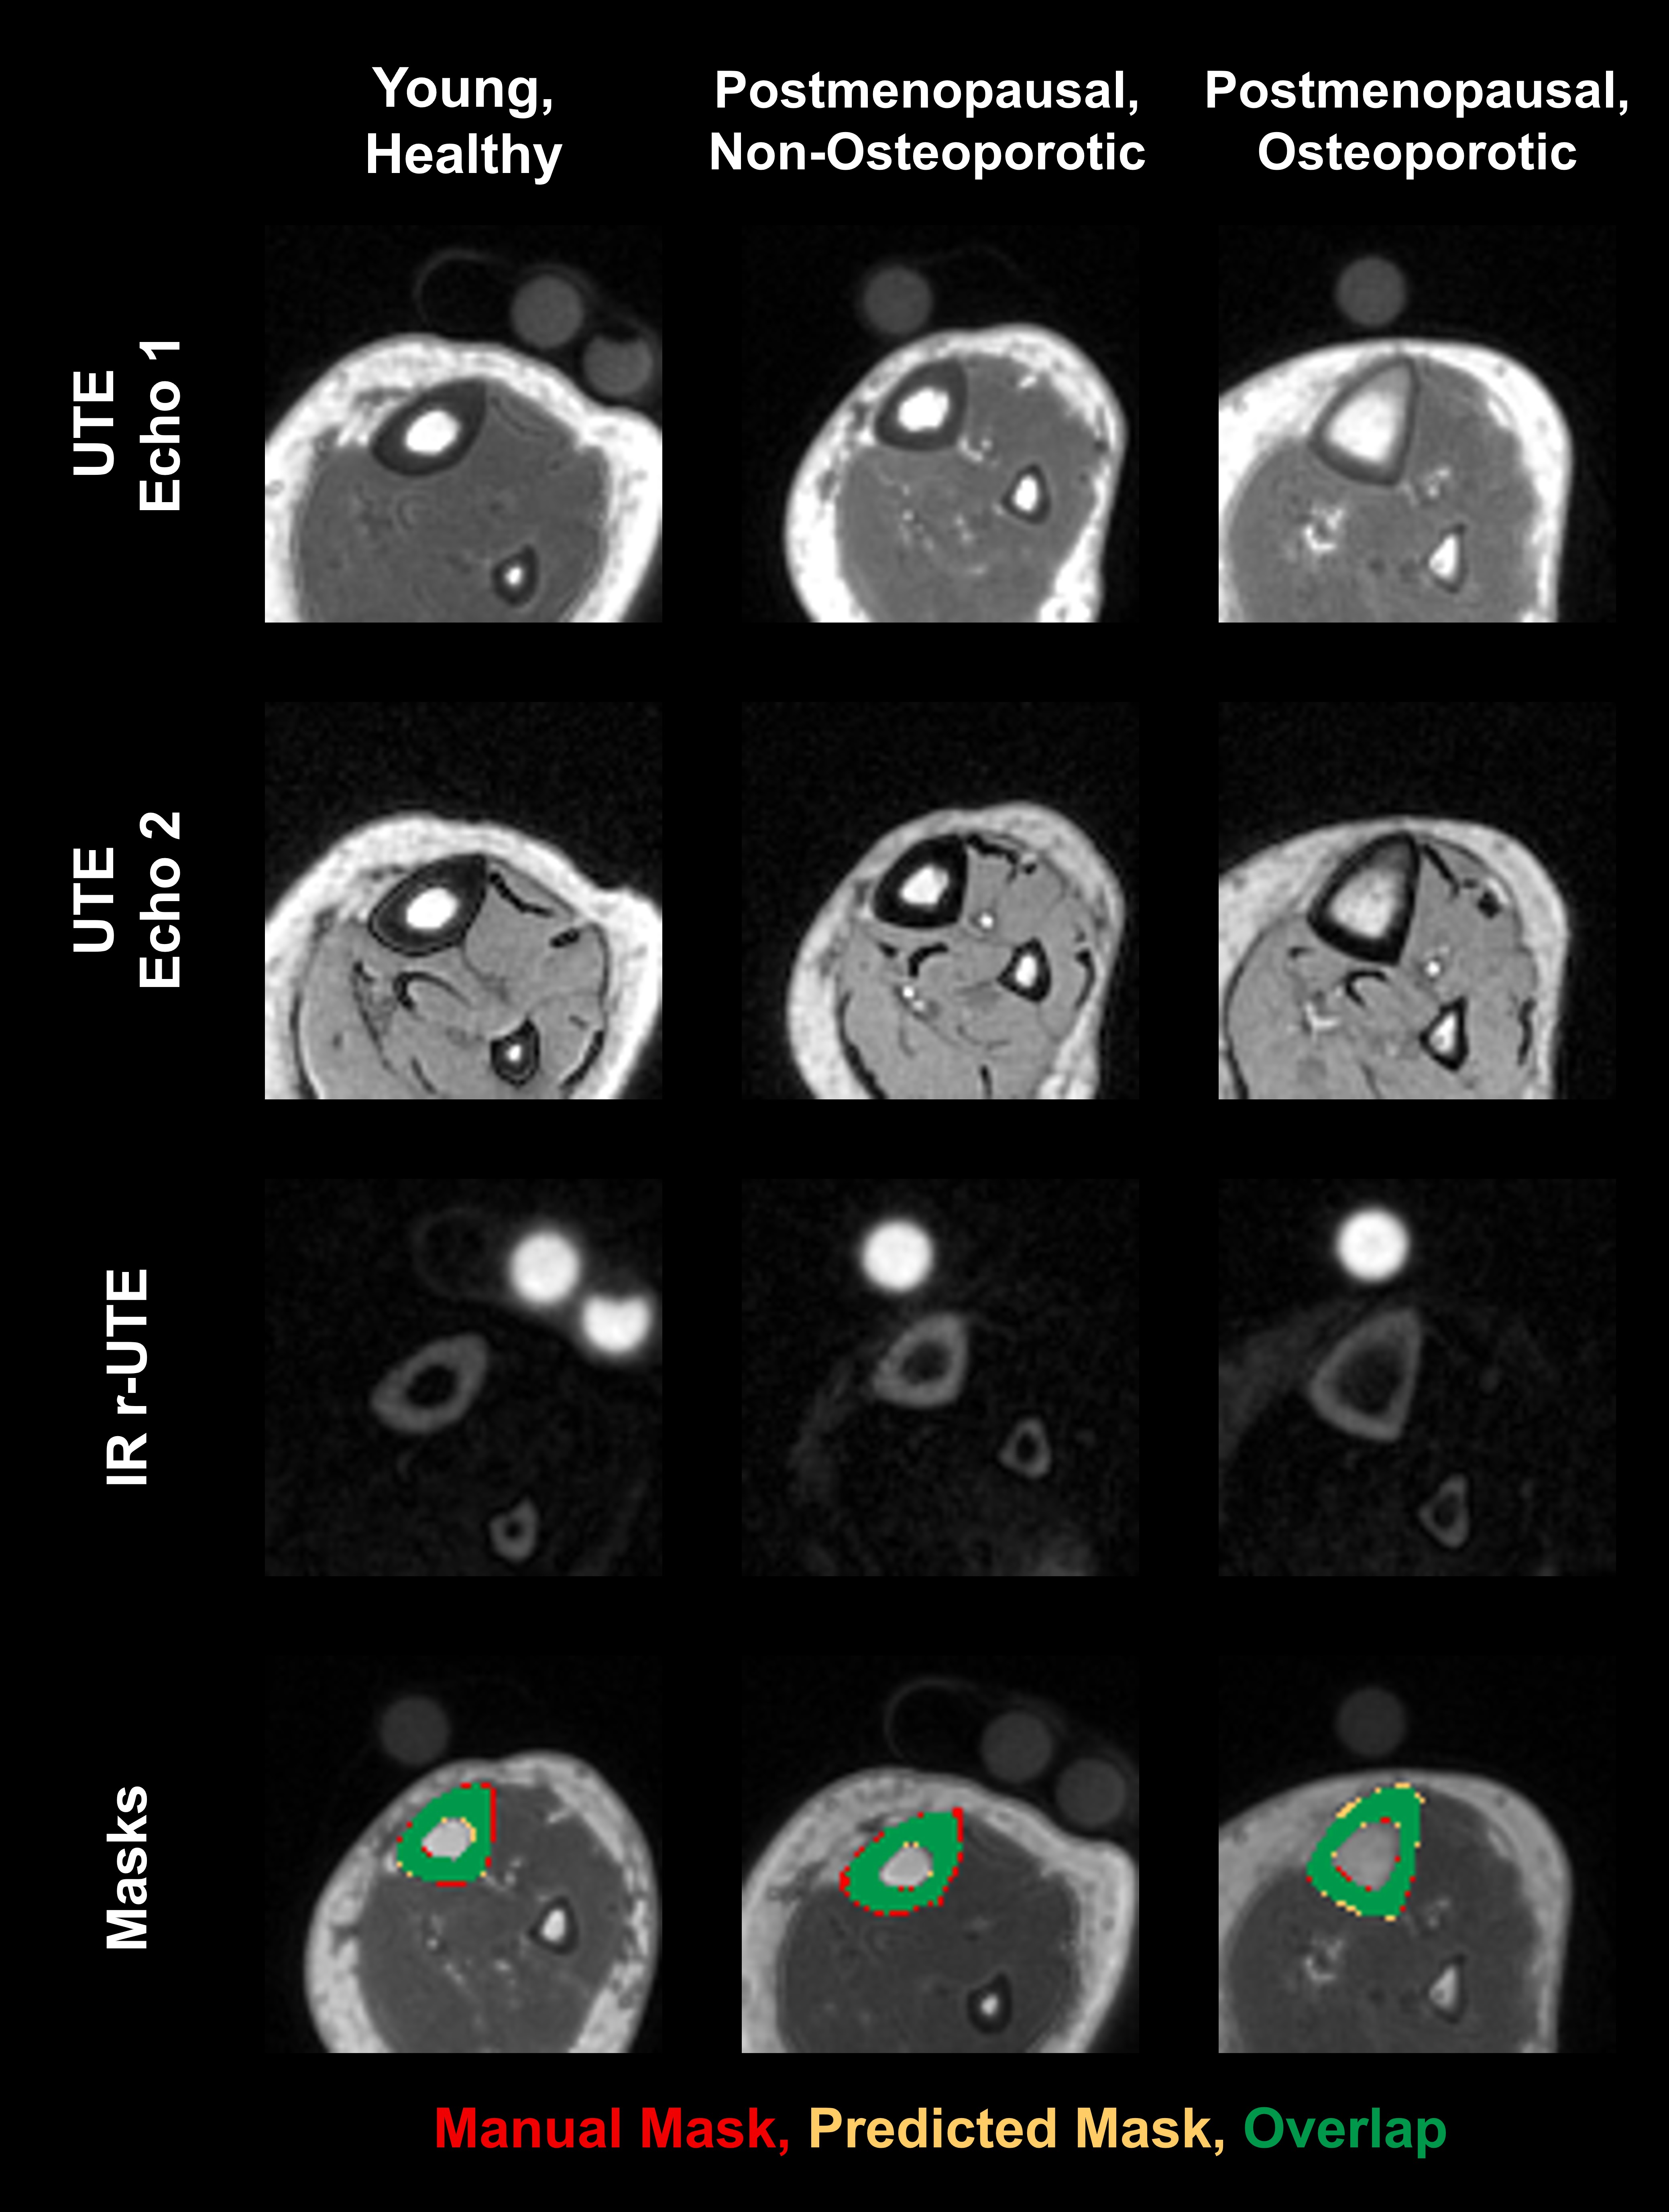
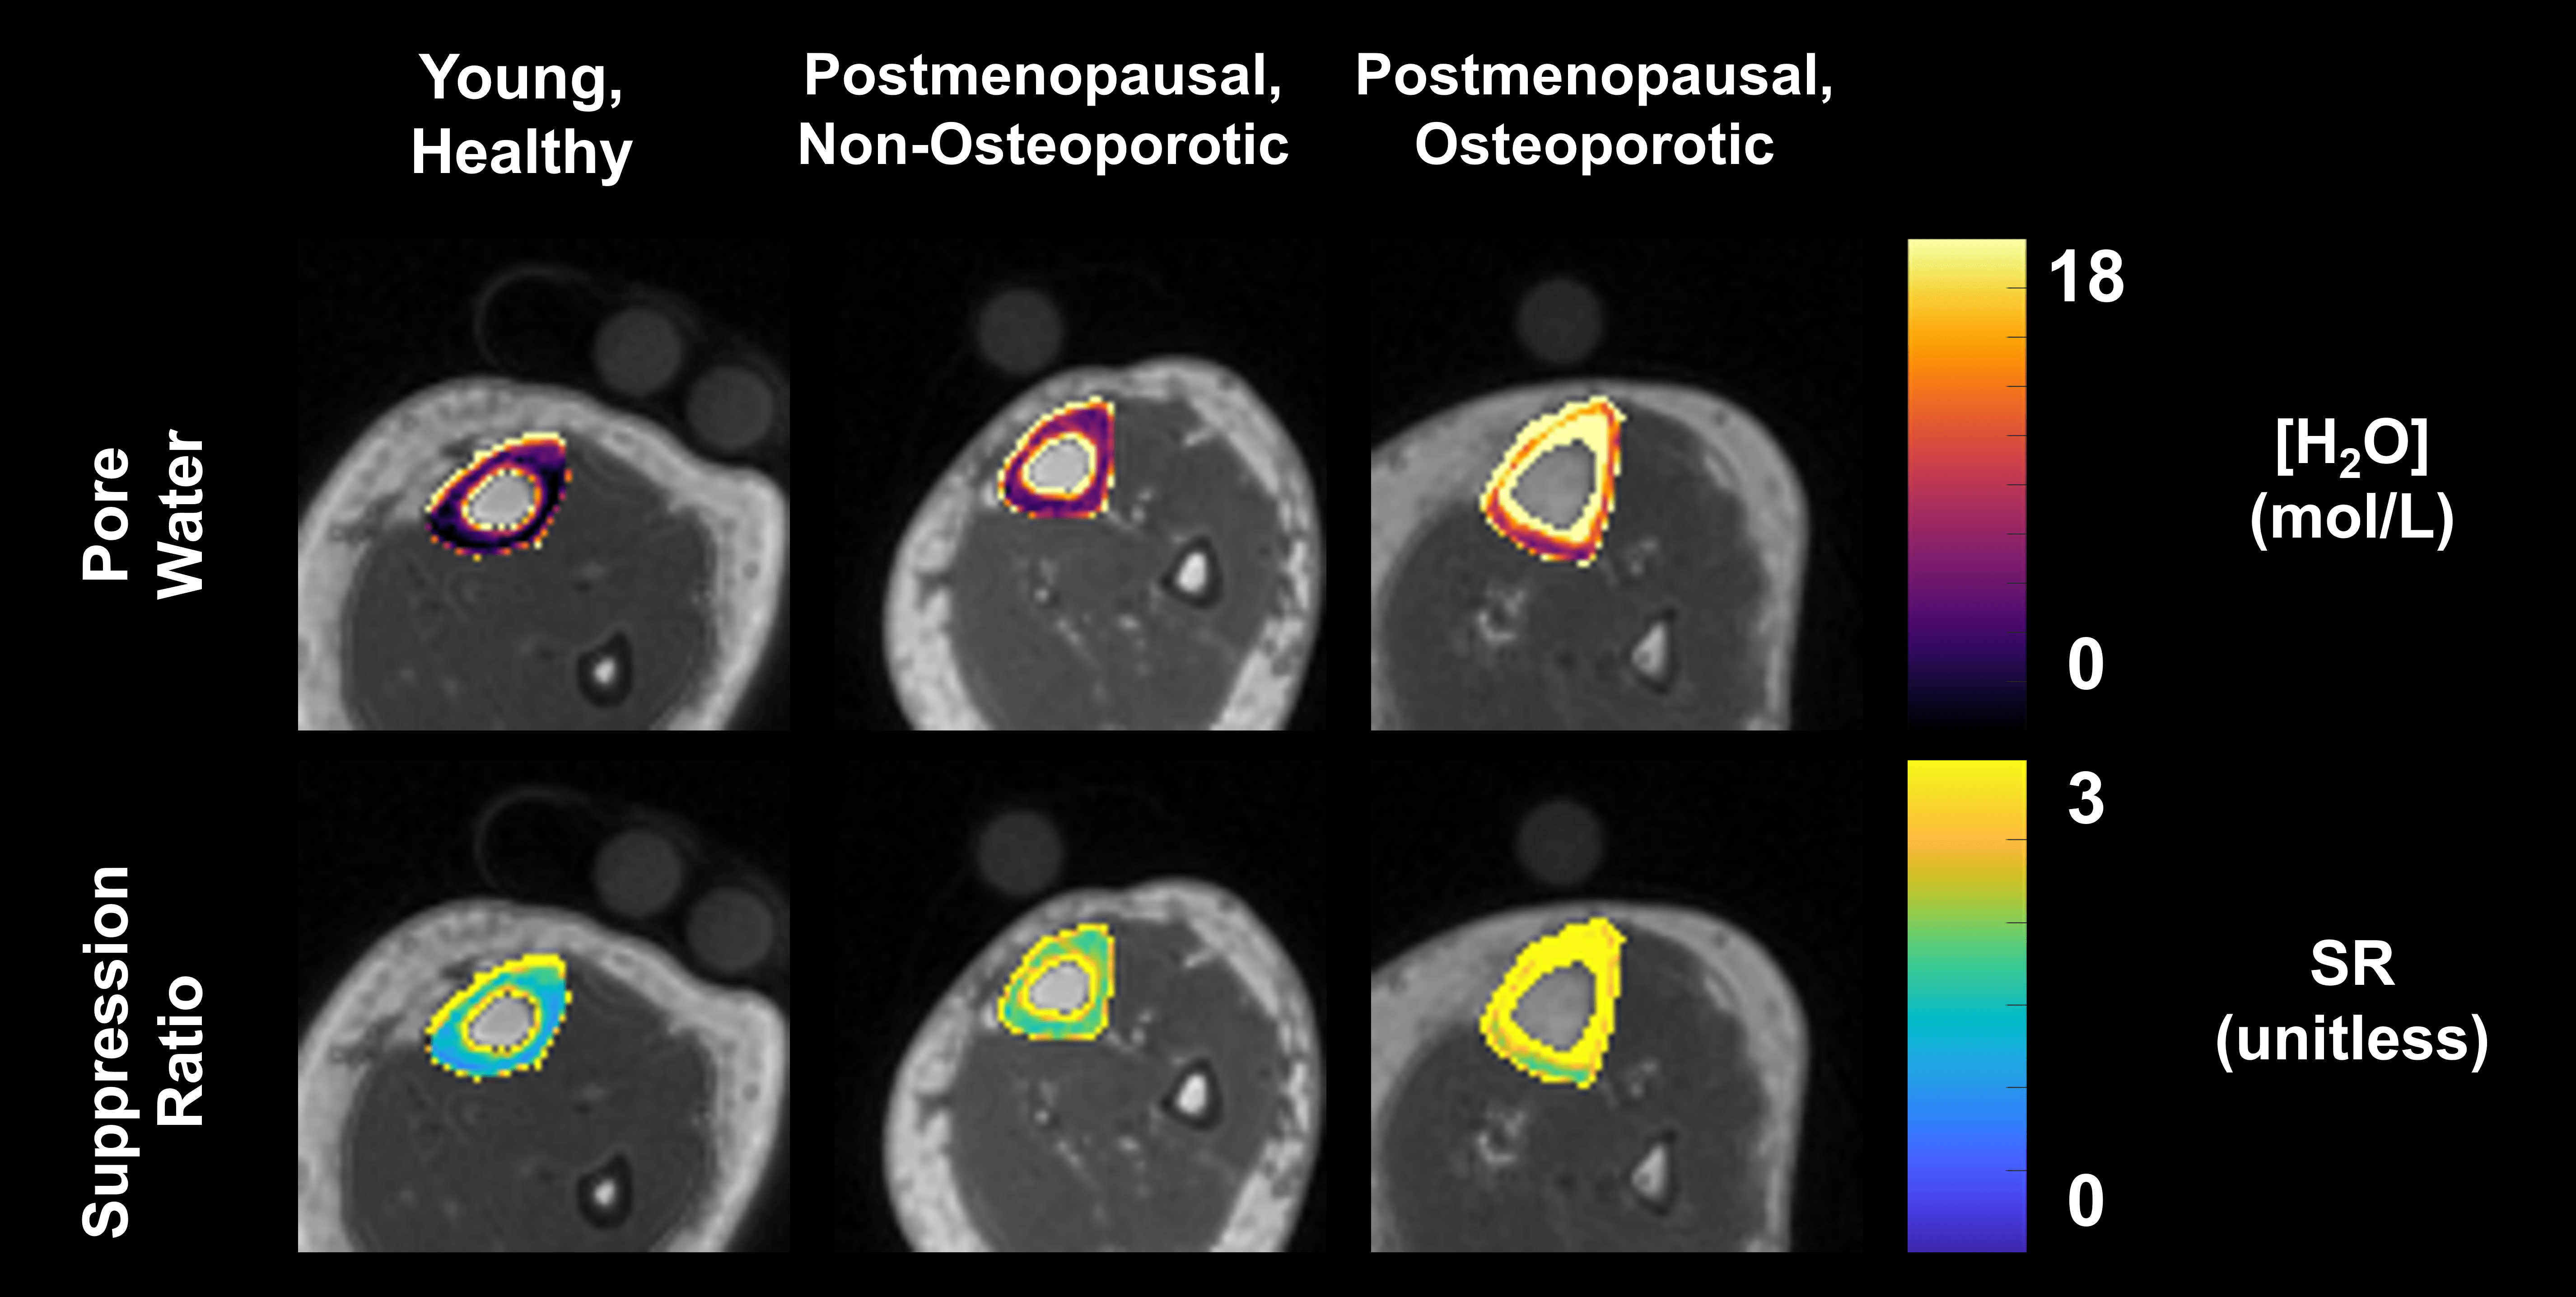
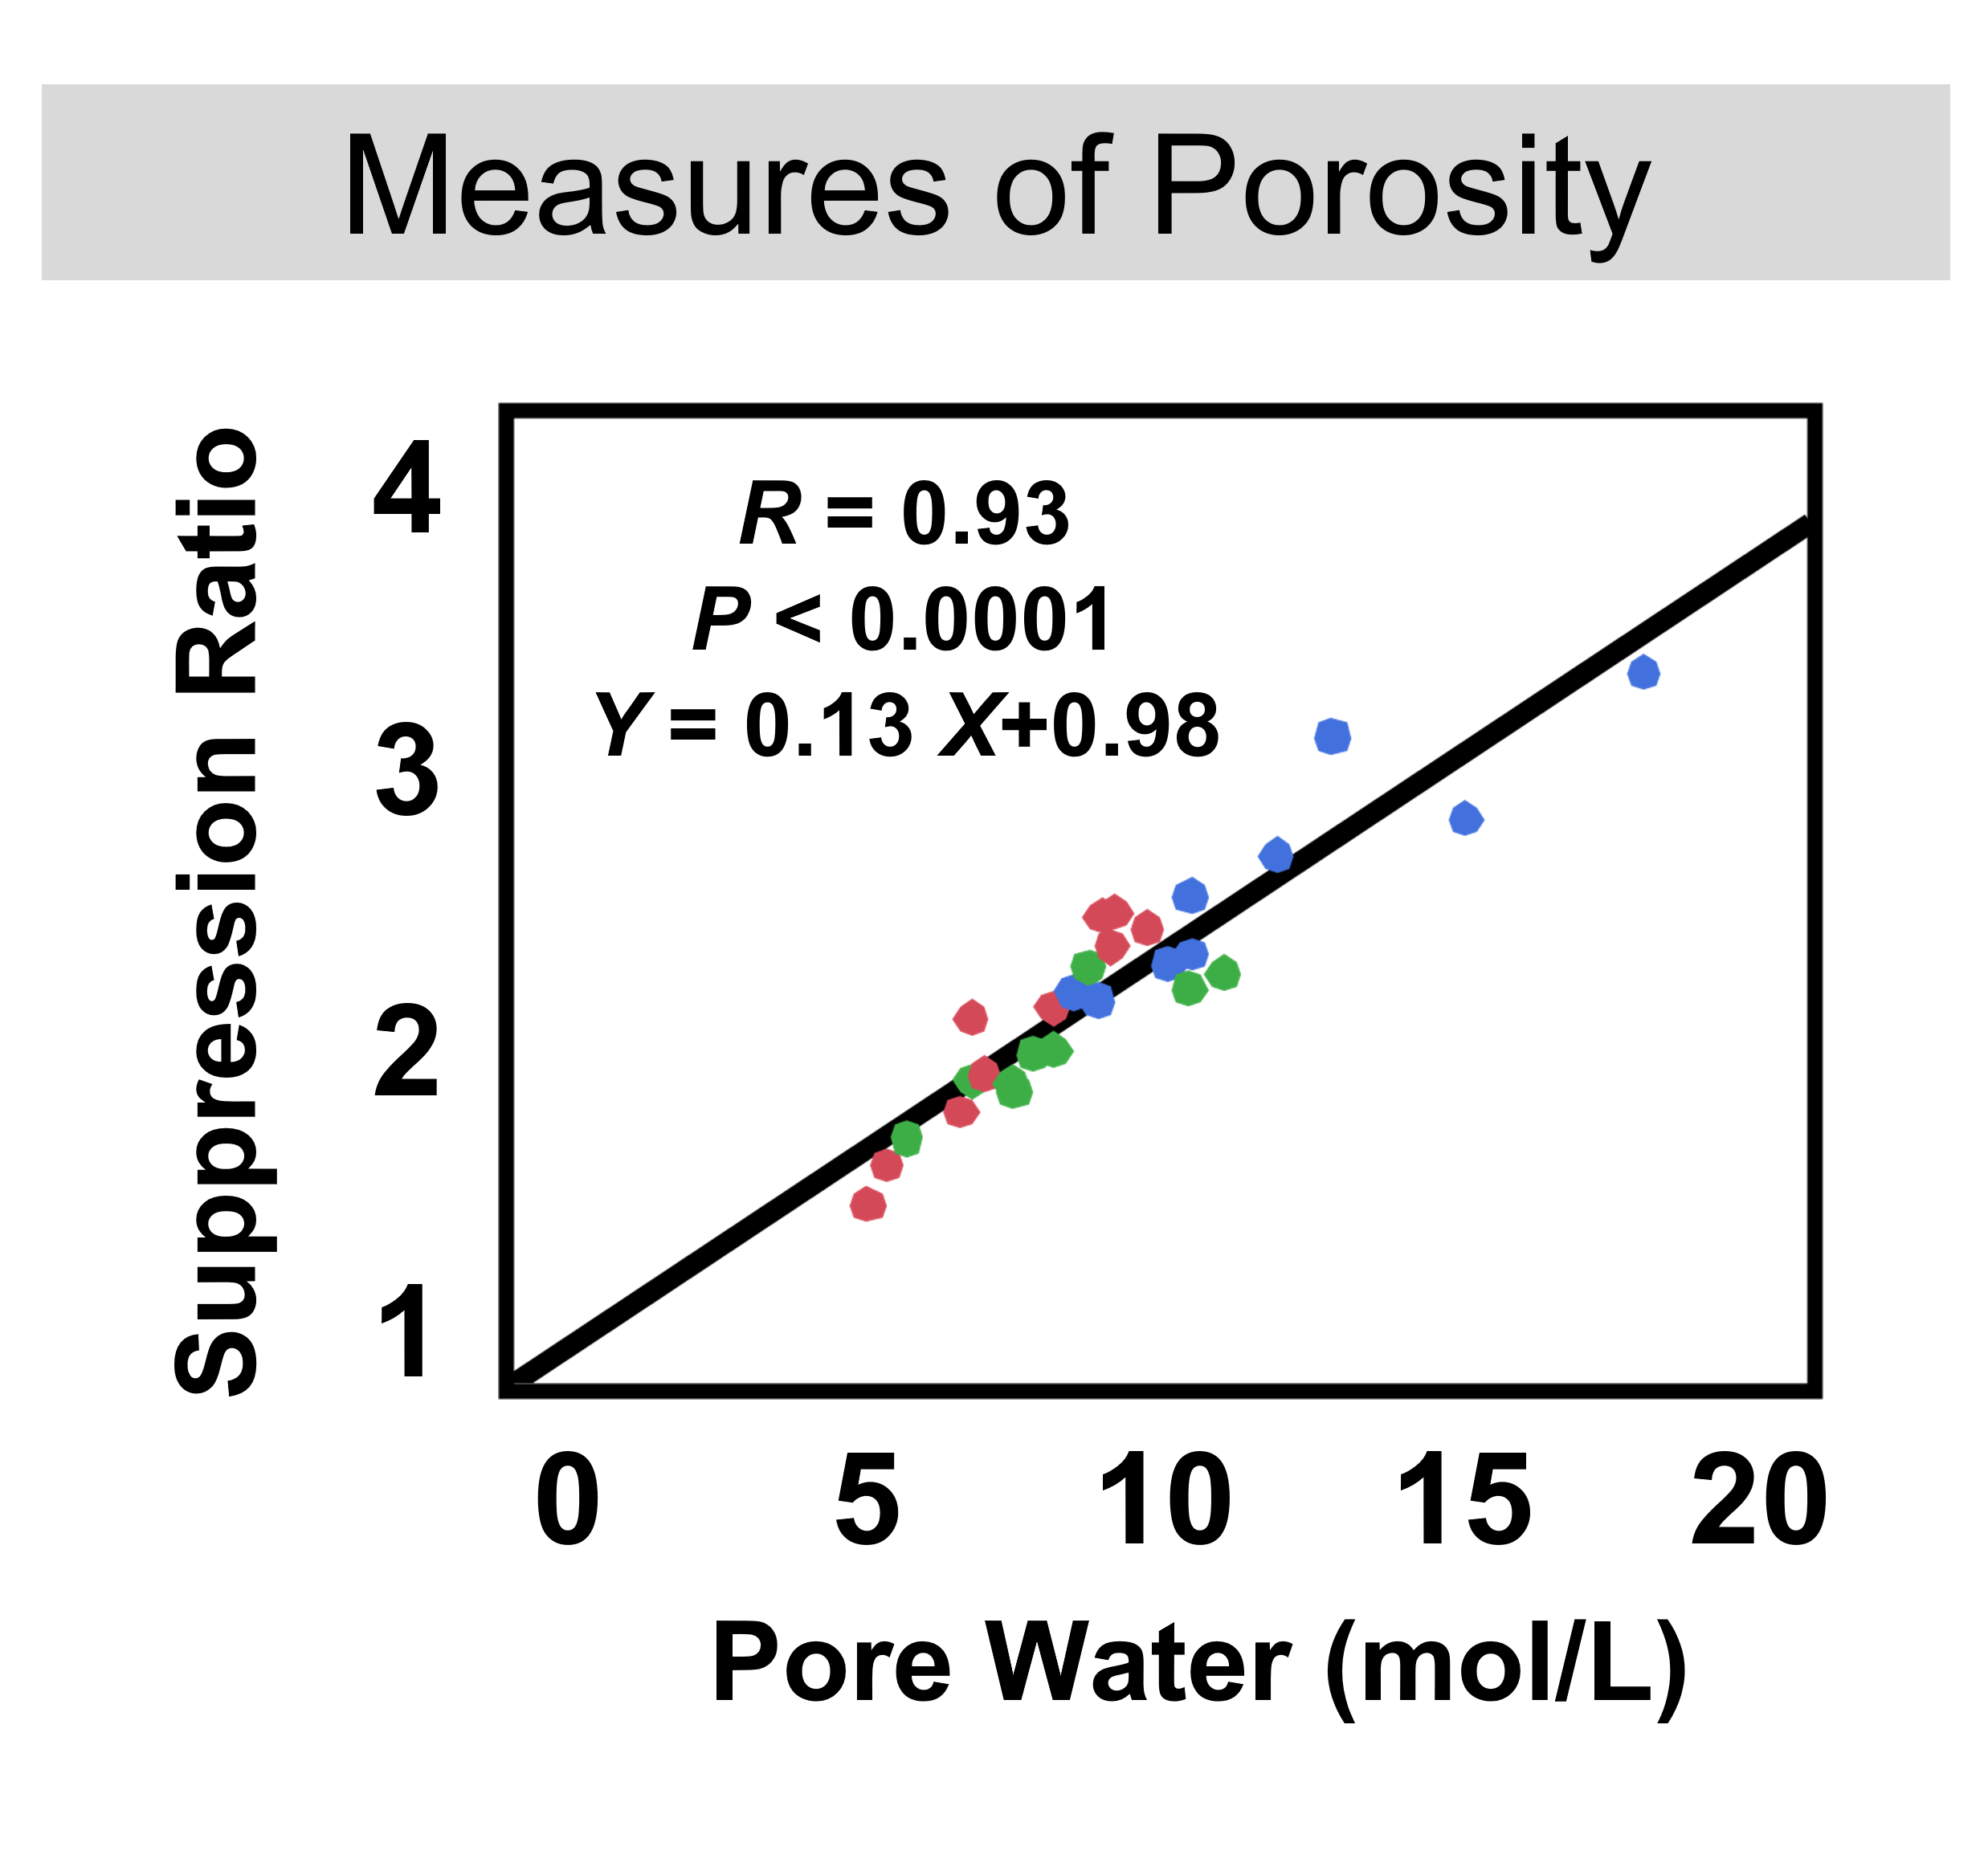
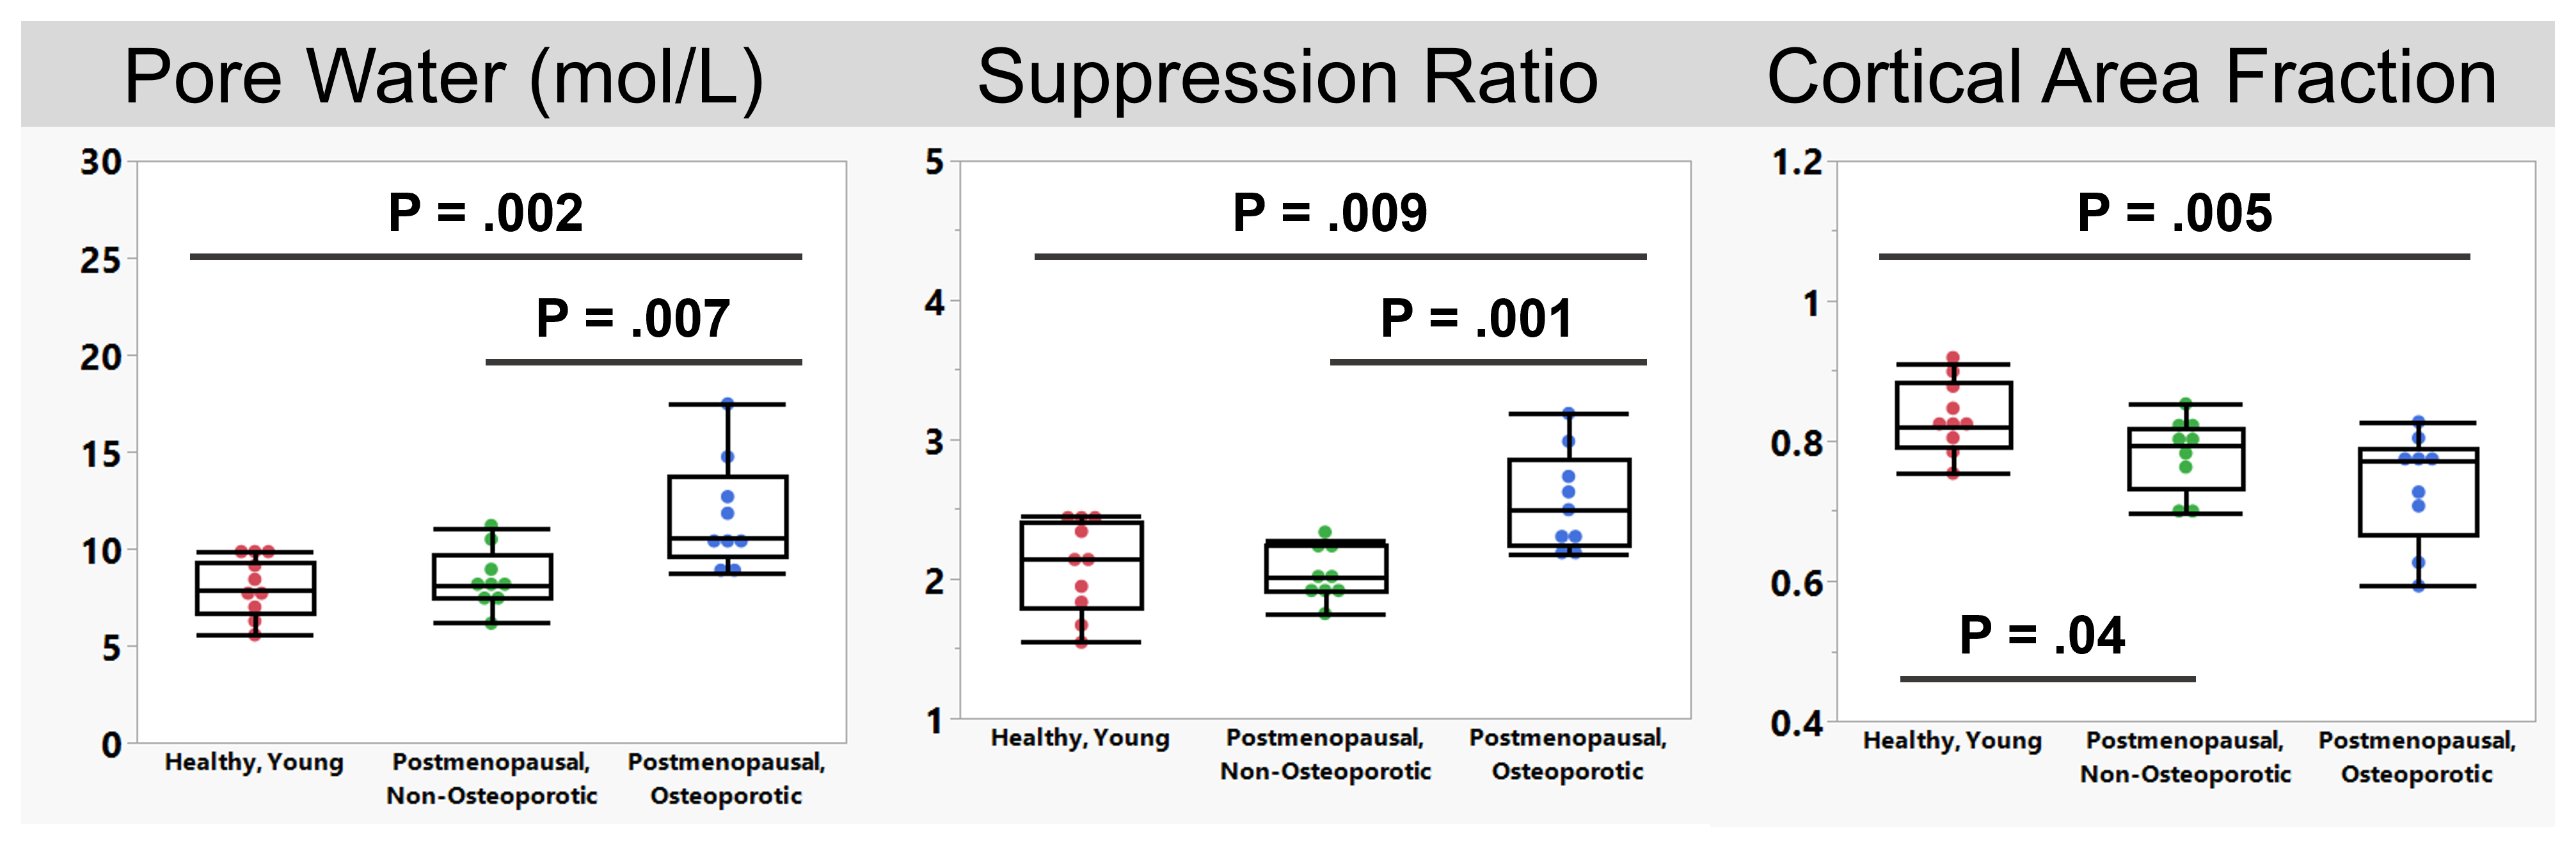
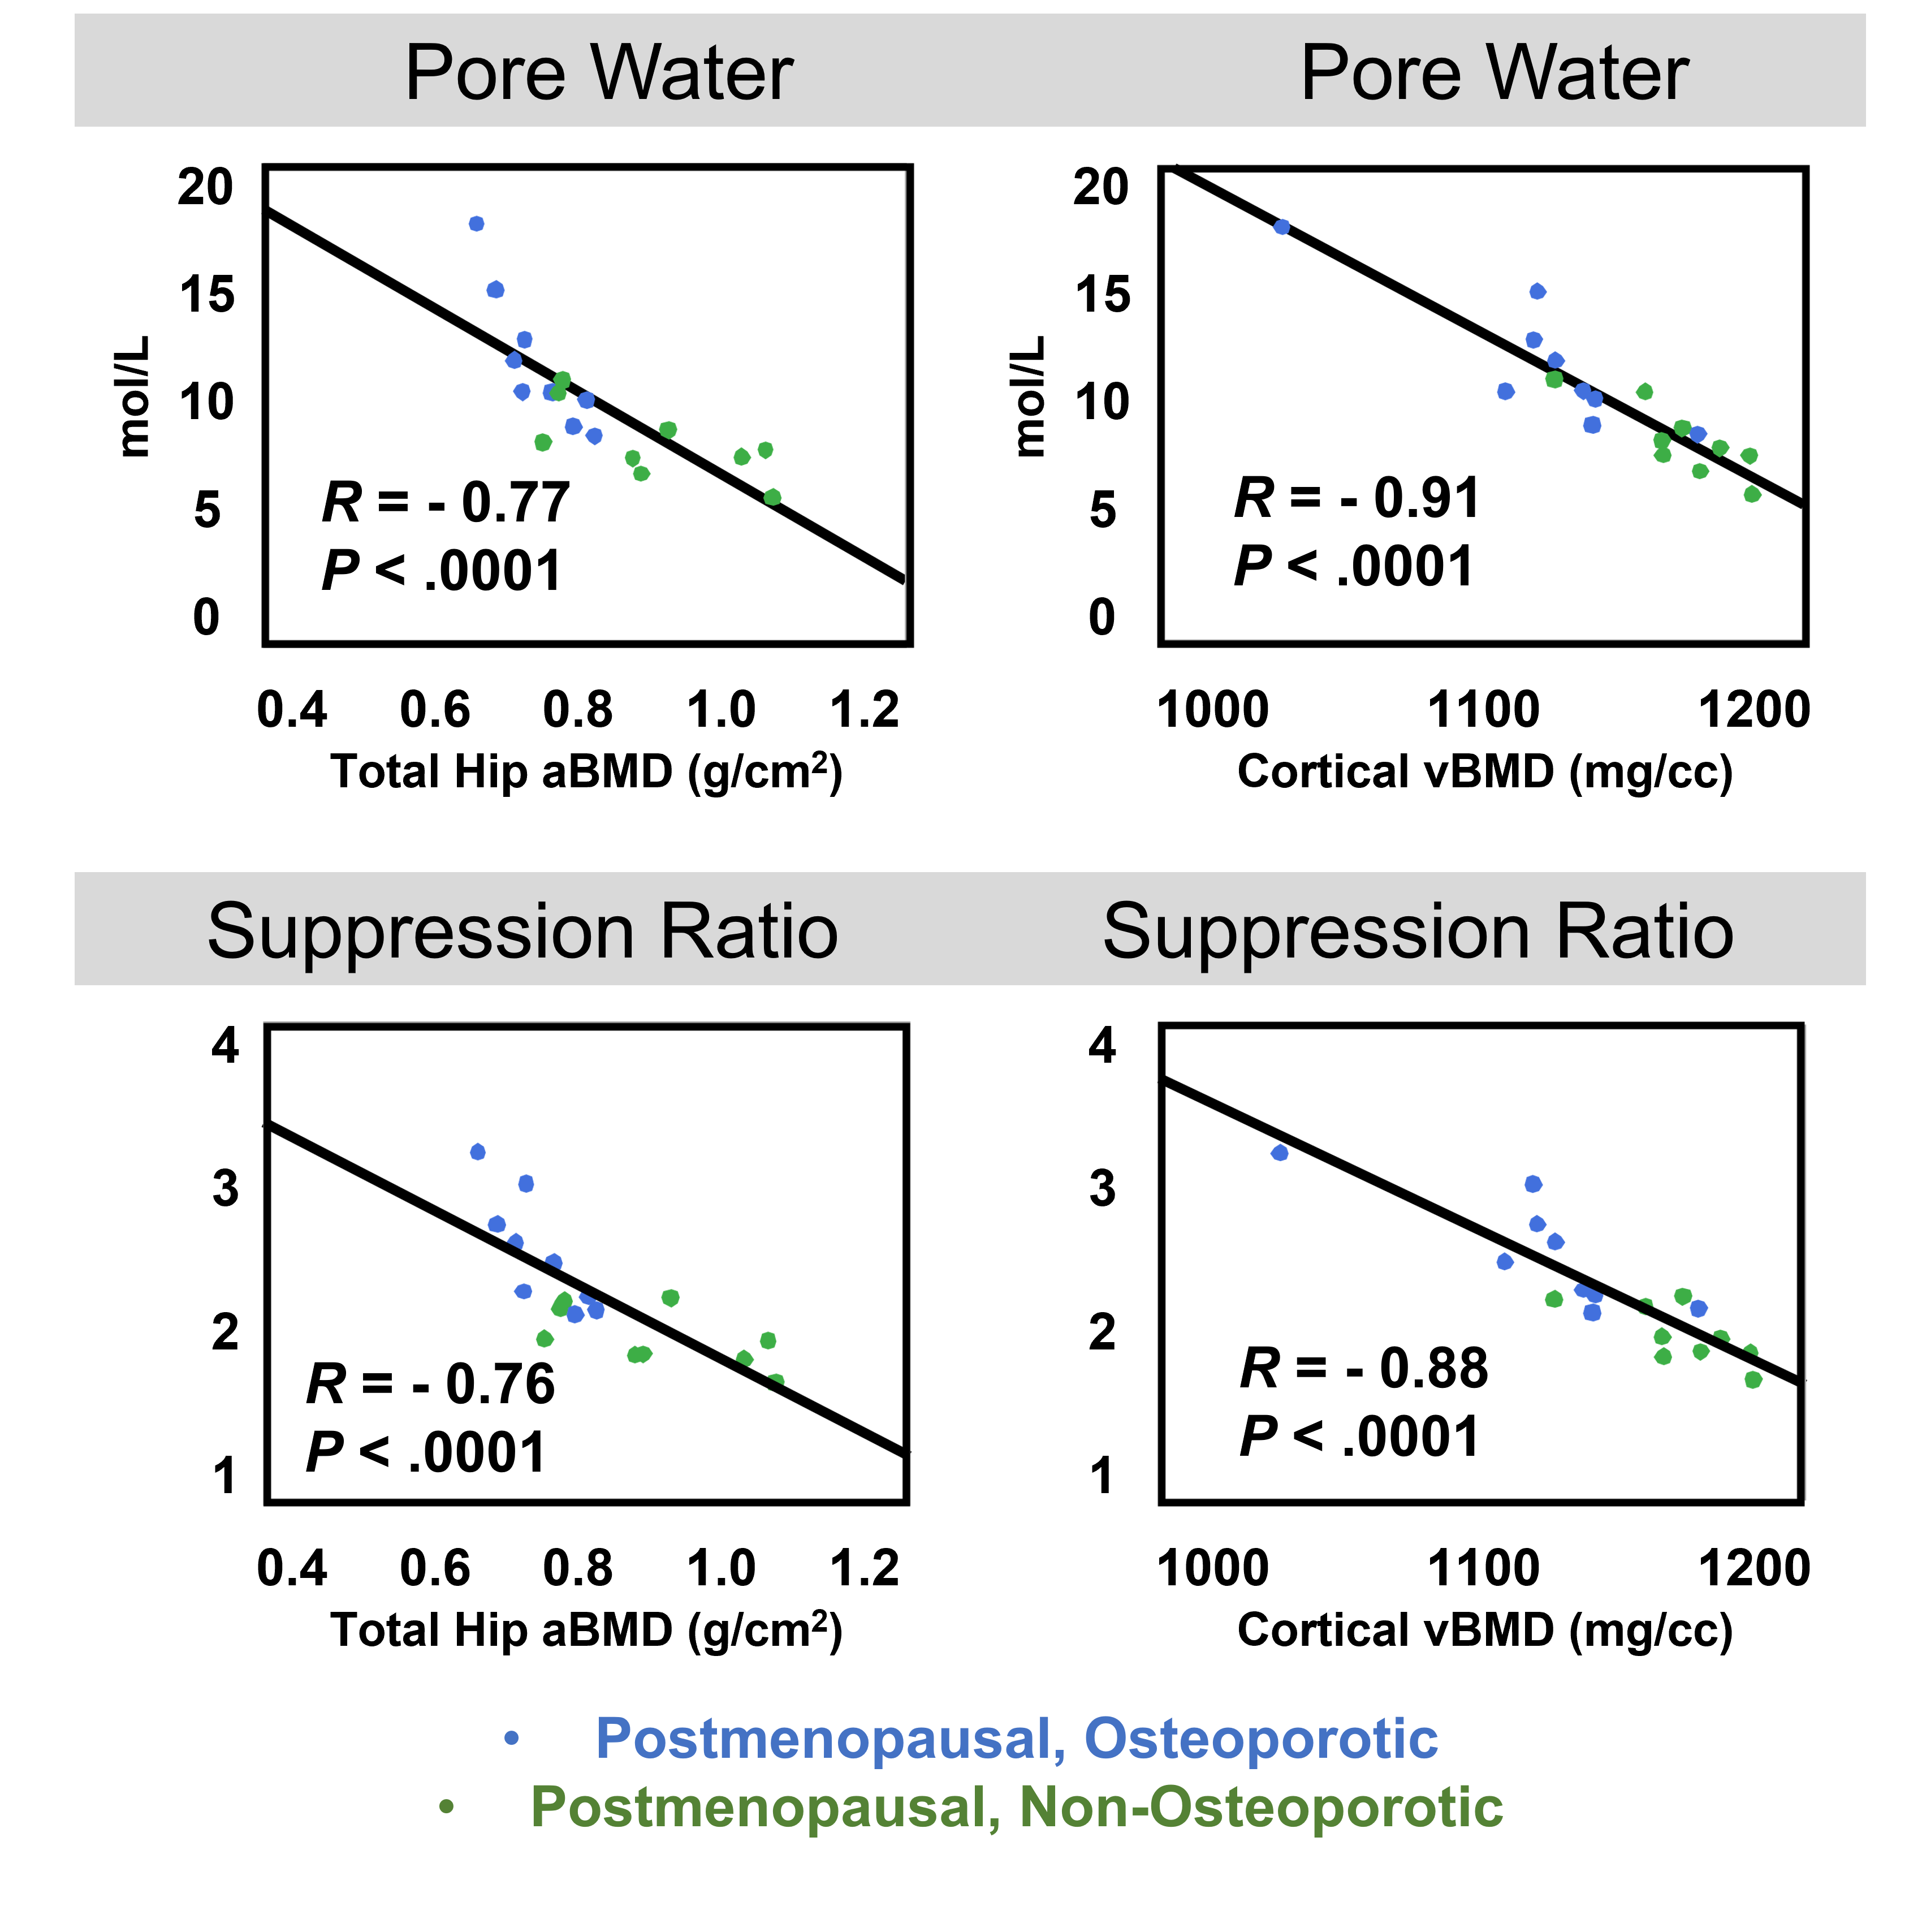
Representative images and automated segmentations are shown in Figure 1 for each group. The VFA-IR-UTE images (Ssuppressed) show consistent long-T2 tissue suppression, with the remaining signal arising from the short T2 species in the tibia, fibula, and reference sample. The dice score and intersection-over-union for all 28 test dataset scans were 0.95±0.01 and 0.93±0.07, respectively and the automated segmentations appeared similar to manual ones. The porosity colormaps displayed in Figure 2 show similar spatial trends between the SR and PW maps. The SR derived from automated segmentations was strongly associated with PW (R=0.93, Figure 3) and had a Y-intercept of 0.98, close to the theoretical limit of 1 as PW approaches 0. SR was elevated in the osteoporotic group compared to the healthy (P=0.009) and the postmenopausal groups (P=0.001) (Figure 4). Furthermore, SR was inversely correlated with pQCT BMD (R=-0.88) and DXA total hip BMD (R=-0.76) (Figure 5), confirming that it can reliably measure porosity in vivo. Similarly, PW derived from automated segmentations were elevated in the osteoporotic group compared to the healthy (P=0.002) and the postmenopausal groups (P=0.007) and were inversely associated with pQCT BMD (R=-0.91) and DXA total hip BMD (R=-0.77). Finally, the CAF derived from automated segmentations was larger in the young group compared to the postmenopausal (P=0.04) and the osteoporotic (P=0.005) groups.DISCUSSION
This retrospective study showed that automated, reference-free assessment of cortical bone porosity and morphology is achievable in clinically feasible acquisition times. The SR biomarker detected impairments in CB porosity associated with postmenopausal osteoporosis and demonstrated strong inverse correlations with pQCT BMD. SR is, therefore, easier to implement in multi-center studies. Additionally, CAF detected impairments in bone size associated with aging, suggesting that deep learning segmentations allows for reliable quantification of CB morphology in vivo.CONCLUSION
Automated UTE MRI assessment of cortical bone porosity and morphology could provide new insights into the pathogenesis of degenerative bone disease.Acknowledgements
NIH R01-AR50068, T32-EB020087, F31-AR079925References
1. Bouxsein, M.L., Technology insight: noninvasive assessment of bone strength in osteoporosis. Nat Clin Pract Rheumatol, 2008. 4(6): p. 310-8.
2. Seeman, E. and P.D. Delmas, Bone quality--the material and structural basis of bone strength and fragility. N Engl J Med, 2006. 354(21): p. 2250-61.
3. Hansen, S., E.M. Hauge, J.E. Jensen, and K. Brixen, Differing effects of PTH 1-34, PTH 1-84 and zoledronic acid on bone microarchitecture and estimated strength in postmenopausal women with osteoporosis. An 18 month open-labeled observational study using HR-pQCT. J Bone Miner Res, 2012.
4. Kanis, J.A., C. Cooper, R. Rizzoli, and J.Y. Reginster, European guidance for the diagnosis and management of osteoporosis in postmenopausal women. Osteoporos Int, 2019. 30(1): p. 3-44.
5. Tsai, J.N., K.K. Nishiyama, D. Lin, A. Yuan, H. Lee, M.L. Bouxsein, and B.Z. Leder, Effects of Denosumab and Teriparatide Transitions on Bone Microarchitecture and Estimated Strength: the DATA-Switch HR-pQCT study. J Bone Miner Res, 2017. 32(10): p. 2001-2009.
6. Samelson, E.J., K.E. Broe, H. Xu, L. Yang, S. Boyd, E. Biver, P. Szulc, J. Adachi, S. Amin, E. Atkinson, C. Berger, L. Burt, R. Chapurlat, T. Chevalley, S. Ferrari, D. Goltzman, D.A. Hanley, M.T. Hannan, S. Khosla, C.T. Liu, M. Lorentzon, D. Mellstrom, B. Merle, M. Nethander, R. Rizzoli, E. Sornay-Rendu, B. Van Rietbergen, D. Sundh, A.K.O. Wong, C. Ohlsson, S. Demissie, D.P. Kiel, and M.L. Bouxsein, Cortical and trabecular bone microarchitecture as an independent predictor of incident fracture risk in older women and men in the Bone Microarchitecture International Consortium (BoMIC): a prospective study. Lancet Diabetes Endocrinol, 2019. 7(1): p. 34-43.
7. Meunier, P.J. and G. Boivin, Bone mineral density reflects bone mass but also the degree of mineralization of bone: therapeutic implications. Bone, 1997. 21(5): p. 373-7.
8. Kral, R., M. Osima, T.T. Borgen, R. Vestgaard, E. Richardsen, and Å. Bjørnerem, Increased cortical porosity and reduced cortical thickness of the proximal femur are associated with nonvertebral fracture independent of Fracture Risk Assessment Tool and Garvan estimates in postmenopausal women. PLOS ONE, 2017. 12(9): p. e0185363.
9. Mikolajewicz, N., N. Bishop, A.J. Burghardt, L. Folkestad, A. Hall, K.M. Kozloff, P.T. Lukey, M. Molloy-Bland, S.N. Morin, A.C. Offiah, J. Shapiro, B. van Rietbergen, K. Wager, B.M. Willie, S.V. Komarova, and F.H. Glorieux, HR-pQCT Measures of Bone Microarchitecture Predict Fracture: Systematic Review and Meta-Analysis. Journal of Bone and Mineral Research, 2020. 35(3): p. 446-459.
10. Rajapakse, C.S., M. Bashoor-Zadeh, C. Li, W. Sun, A.C. Wright, and F.W. Wehrli, Volumetric Cortical Bone Porosity Assessment with MR Imaging: Validation and Clinical Feasibility. Radiology, 2015. 276(2): p. 526-35.
11. Biswas, R., W. Bae, E. Diaz, K. Masuda, C.B. Chung, G.M. Bydder, and J. Du, Ultrashort echo time (UTE) imaging with bi-component analysis: bound and free water evaluation of bovine cortical bone subject to sequential drying. Bone, 2012. 50(3): p. 749-55.
12. Manhard, M.K., R.A. Horch, K.D. Harkins, D.F. Gochberg, J.S. Nyman, and M.D. Does, Validation of quantitative bound- and pore-water imaging in cortical bone. Magn Reson Med, 2014. 71(6): p. 2166-71.
13. Horch, R.A., D.F. Gochberg, J.S. Nyman, and M.D. Does, Clinically compatible MRI strategies for discriminating bound and pore water in cortical bone. Magn Reson Med, 2012.
14. Zhao, X., H.K. Song, A.C. Seifert, C. Li, and F.W. Wehrli, Feasibility of assessing bone matrix and mineral properties in vivo by combined solid-state 1H and 31P MRI. PLoS One, 2017. 12(3): p. e0173995.
15. Jerban, S., Y. Ma, L. Li, H. Jang, L. Wan, T. Guo, A. Searleman, E.Y. Chang, and J. Du, Volumetric mapping of bound and pore water as well as collagen protons in cortical bone using 3D ultrashort echo time cones MR imaging techniques. Bone, 2019. 127: p. 120-128.
16. Manhard, M.K., S. Uppuganti, M. Granke, D.F. Gochberg, J.S. Nyman, and M.D. Does, MRI-derived bound and pore water concentrations as predictors of fracture resistance. Bone, 2016. 87: p. 1-10.
17. Bae, W.C., P.C. Chen, C.B. Chung, K. Masuda, D. D'Lima, and J. Du, Quantitative ultrashort echo time (UTE) MRI of human cortical bone: Correlation with porosity and biomechanical properties. J Bone Miner Res, 2012. 27(4): p. 848-57.
18. Jones, B., C. Cheng, X. Zhao, H. Lee, M. Al Mukaddam, P.J. Snyder, C.S. Rajapakse, H.K. Song, and F.W. Wehrli, Solid-state MR based quantitative assessment of bone water and 31P differentiates between postmenopausal women with and without osteoporosis. Proceedings of the International Society of Magnetic Resonance in Medicine, 2022(2022 Annual Meeting in London, England).
19. Li, C., A.C. Seifert, H.S. Rad, Y.A. Bhagat, C.S. Rajapakse, W. Sun, S.C. Lam, and F.W. Wehrli, Cortical bone water concentration: dependence of MR imaging measures on age and pore volume fraction. Radiology, 2014. 272(3): p. 796-806.
20. Li, C., J.F. Magland, X. Zhao, A.C. Seifert, and F.W. Wehrli, Selective in vivo bone imaging with long-T2 suppressed PETRA MRI. Magn Reson Med, 2016.
21. Ronneberger, O., P. Fischer, and T. Brox. U-Net: Convolutional Networks for Biomedical Image Segmentation. in Medical Image Computing and Computer-Assisted Intervention – MICCAI 2015. 2015. Cham: Springer International Publishing.
Figures