0085
Differentiation of Malignant and Benign Musculoskeletal Tumors Using IVIM-DWI Versus DCE-MRI
Miaomiao Cheng1, Hua Zhang1, Jixian Li1, Zhiyan Xie1, Jiufa Cui1, and Xuejun Liu1
1The Affiliated Hospital of Qingdao University, Qing Dao, China
1The Affiliated Hospital of Qingdao University, Qing Dao, China
Synopsis
Keywords: Bone, Diffusion/other diffusion imaging techniques, diagnostic value
This study aimed to investigate the diagnostic value of IVIM-DWI and DCE-MRI in differentiating benign and malignant musculoskeletal tumors. IVIM parameters (FP, D, and DP) were statistically compared with ADC and DCE-MRI (Ktrans, Kep, Ve, and iAUC) within two groups. D, Ktrans and Kep have good diagnostic performance in identification of benign and malignant musculoskeletal tumors, DCE-MRI and IVIM have similar diagnostic efficacy, and combining these two methods can further improve the diagnostic performance. IVIM-DWI may be an alternative to DCE-MRI in patients with contrast contraindications.Introduction/Purpose
To evaluate the diagnostic performance of intravoxel incoherent motion diffusion-weighted imaging (IVIM-DWI) imaging and dynamic contrast-enhanced magnetic resonance imaging (DCE-MRI) for differentiation between benign and malignant musculoskeletal tumors.Methods
IVIM-DWI and DCE-MRI images of 36 patients(histologically proven 22 benign and 14 malignant cases) with treatment-naive musculoskeletal tumors were analyzed. IVIM data with b-values of 0, 10, 20, 30, 40, 50, 70, 100,150, 200, 400, 700s/mm2 and DCE on a 3T MR scanner (MAGNETOM Prisma, Siemens Healthcare, Erlangen, Germany). Before the DCE scan, a three-flip-angle (2o, 8o, and 15°) VIBE sequence was used for T1 mapping. The pharmacokinetic parameters (Ktrans, kep, Ve, iAUC) were calculated from DCE data using Tissue 4D software (syngo.via, Siemens Healthcare, Erlangen, Germany). The IVIM parameters were calculated using prototype software (MR Body Diffusion Toolbox, Siemens Healthcare, Erlangen, Germany). Statistical analysis was performed using SPSS 21.0 software (SPSS, Chicago, IL,USA)and Med Calc version 13.0.(Med Calc Software, Mariakerke, Belgium).The independent sample t-test was for data with normal distribution and Mann-Whitney U-test was for those with non-normal distribution. Receiver operating characteristic (ROC) curves were plotted to evaluate the diagnostic performance of the different parameters and union parameters. Statistical significance was accepted for P <0.05.Results
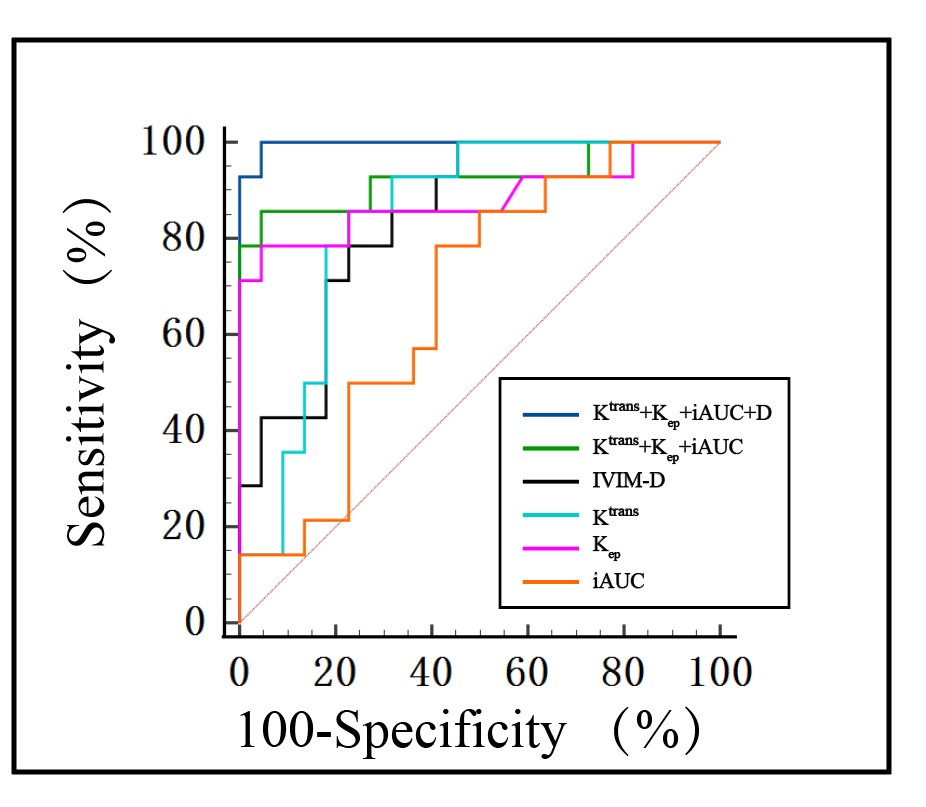
As demonstrated in the Table 1, ADC, D, Ktrans and Kep, iAUC of benign and malignant groups were significantly different (p<0.05), while no statistically significant differences in D*, fP and Ve values between two groups. Two examples with anatomical images and functional maps in one patient with benign and malignant musculoskeletal tumor are shown in Figure.1a–f and Figure.2a–f, respectively. ROC curves analyses of AUC, sensitivity, specificity, cut-off value and Youden index, PPV, NPV for the MRI parameters and parameters combination were summarized in Table 2,AUC values of D, Ktrans, Kep, iAUC, Ktrans+Kep + iAUC were 0.84, 0.88, 0.84, 0.68 and 0.93, respectively, and AUC values for the identification of benign and malignant musculoskeletal tumors between IVIM derived D and DCE-MRI union parameters (Ktrans + Kep + iAUC) was not statistically significant (Z=1.655, P=0.098). ROC curves of IVIM-DWI parameters and DCE-MRI quantitative parameters and the combined model were shown in Figure 3, AUC value of the combination of D value and DCE-MRI union parameters was 0.99, which was higher than that of IVIM-DWI and DCE-MRI alone , respectively (P<0.05).Discussions/Conclusion
The diagnosis of musculoskeletal tumors is difficult due to overlapping imaging features between benign and malignant tumor. Hence, quantitative analysis of IVIM and DCE based on functional MRI revealed a significant correlation with pathological grading in musculoskeletal tumors. We observed that the Ktrans、Kep and iAUC were higher in malignant group compared to benign musculoskeletal tumors(P<0.05), but there were no significant statistical difference regarding Ve(P=0.4535) . One possible reason for our findings is sample size and the heterogeneity of tumor cells[1]. A significant difference was observed for both ADC from mono-exponential model and D from IVIM model, consistent with the findings of Lim.et.al[2].IVIM-derived D value could reflect the motion of water molecules more factually than ADC value for excluding the impact of perfusion effect[3]. Therefore, D values may be used as one of the biomarkers to predict the benignity and malignancy of tumors. In our study, joint indicator (D+ Ktrans + Kep+ iAUC) of ROC curve with an AUC value of 0.99 and a sensitivity of 100%, and its diagnostic efficacy was further improved compared with IVIM-DWI or DCE-MRI alone. The difference between these two methods is not statistically significant under the Z test (P>0.05, respectively), suggesting the similar diagnostic value in identifying benign and malignant musculoskeletal tumors. In conclusion, D, Ktrans and Kep have excellent diagnostic performance in differentiating benign and malignant musculoskeletal tumors, and the diagnostic performance of IVIM-DWI and quantitative DCE-MRI is similar, combining of those can significantly improve the diagnostic efficiency.Acknowledgements
No acknowledgement foundReferences
[1] Oh E, Yoon YC, Kim JH, et al. Multiparametric approach with diffusion-weighted imaging and dynamic contrast-enhanced MRI: a comparison study for differentiating between benign and malignant bone lesions in adults.[J]. Clinical radiology, 2017, 72(7): 552-559. [2] Lim H K , Jee W H ,Jung J Y , et al. Intravoxel incoherent motion diffusion-weighted MR imaging for differentiation of benign and malignant musculoskeletal tumours at 3 T[J]. Br J Radiol, 2018, 91(1082): 20170636. [3] van Rijswijk C, Kunz P, Hogendoorn P , et al. Diffusion-weighted MRI in the characterization of soft-tissue tumors[J]. Journal of Magnetic Resonance Imaging, 2002, 15(3): 302-307.Figures
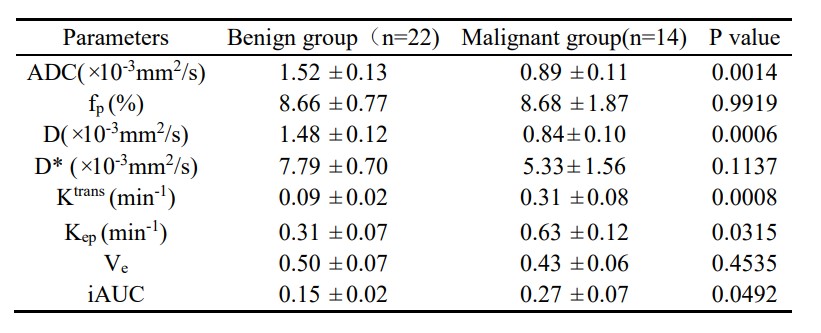
Comparison between IVIM imaging and
DCE-MRI derived indices between the two groups.
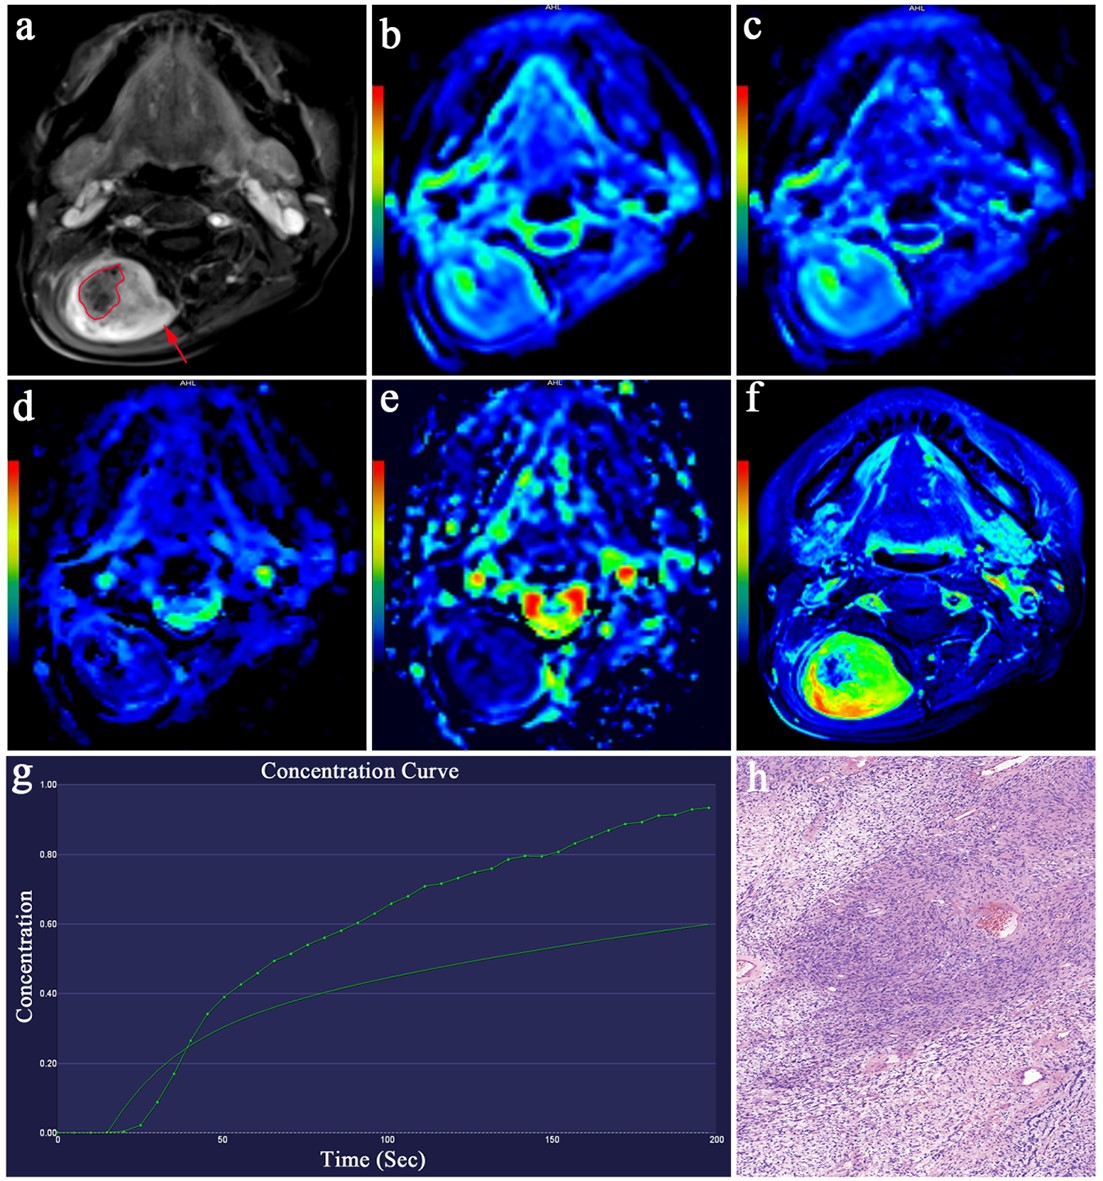
Female, 50 years old, pathologically confirmed right cervical nerve benign schwannoma. a) contrast-enhanced T1W image showed remarkable enhancement (red arrow) with necrosis (red irregular selection); b) Functional maps of ADC; c-e) Functional maps of IVIM-DWI quantitative parameters D, D* and fp, respectively; f) DCE-MRI mapping image showed a lesion with high perfusion (yellow-green color) and a central necrotic area (blue color); g) showed a slow-in, slow-out dynamic enhancement curve; h) Hematoxylin-eosin-stained slice (original magnifications of h ×100).
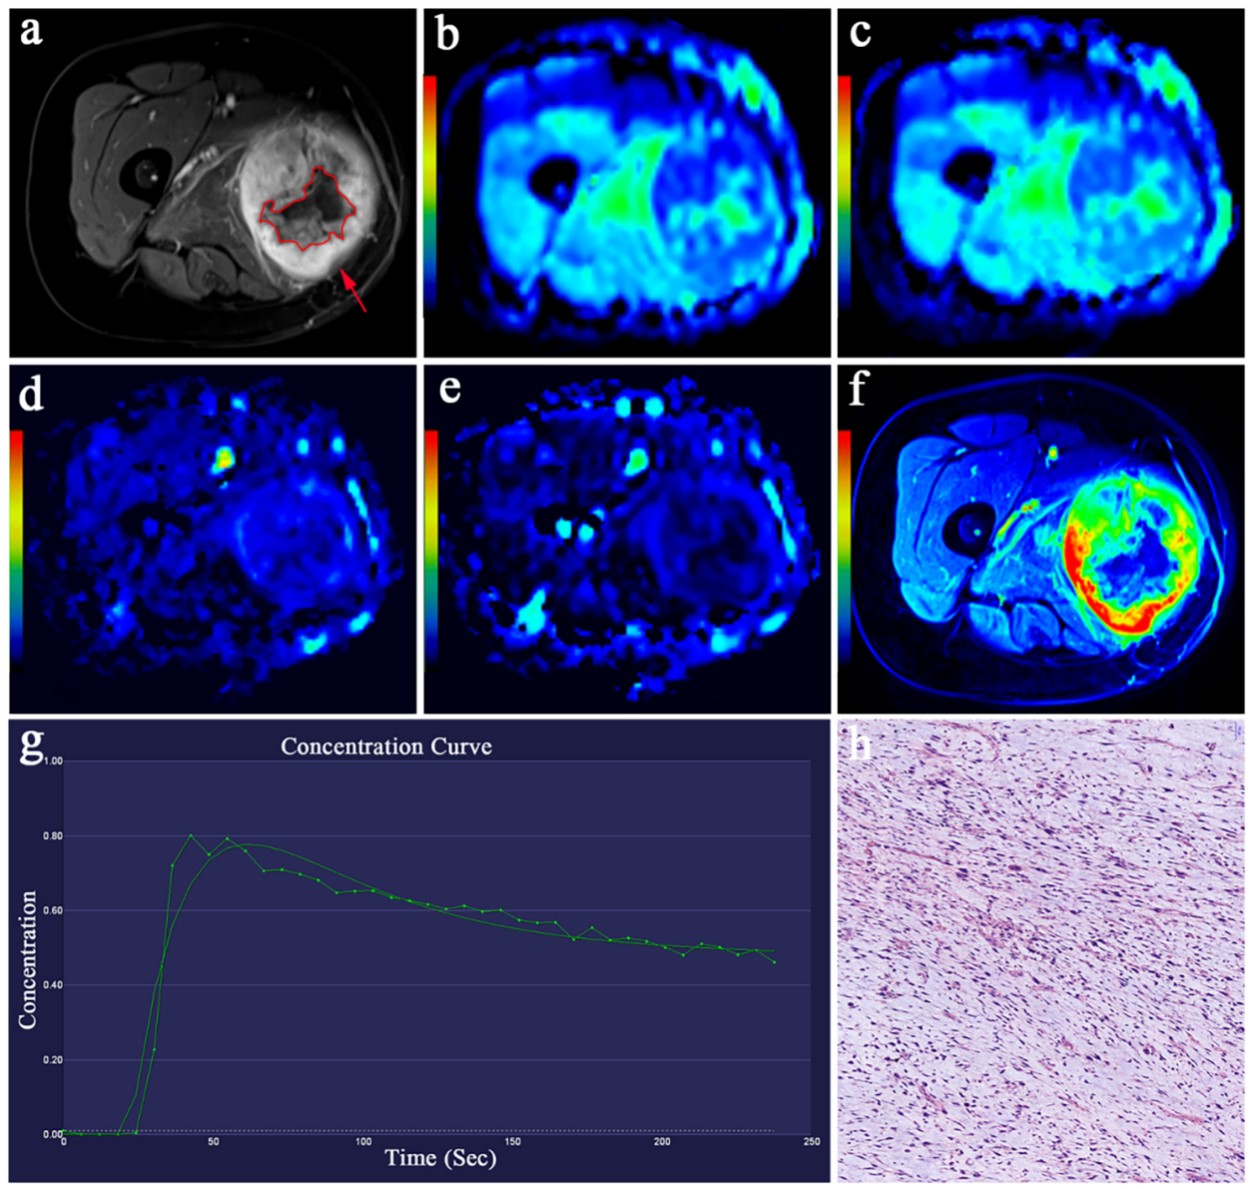
Female, 60 years old, pathologically confirmed malignant
sarcoma. a) contrast-enhanced T1W image showed remarkable enhancement (red arrow) with
necrosis (red irregular selection);
b) Functional
maps of ADC; c-e) Functional
maps of IVIM-DWI
quantitative parameters D, D* and fp, respectively; f) DCE-MRI mapping
showed
a lesion with high perfusion
(red-yellow-green color ) with a central necrotic area (blue); (g) perfusion
curve showed a fast-in, fast-out
dynamic enhancement curve; h) h) Hematoxylin-eosin-stained slice (original
magnifications of h ×100).
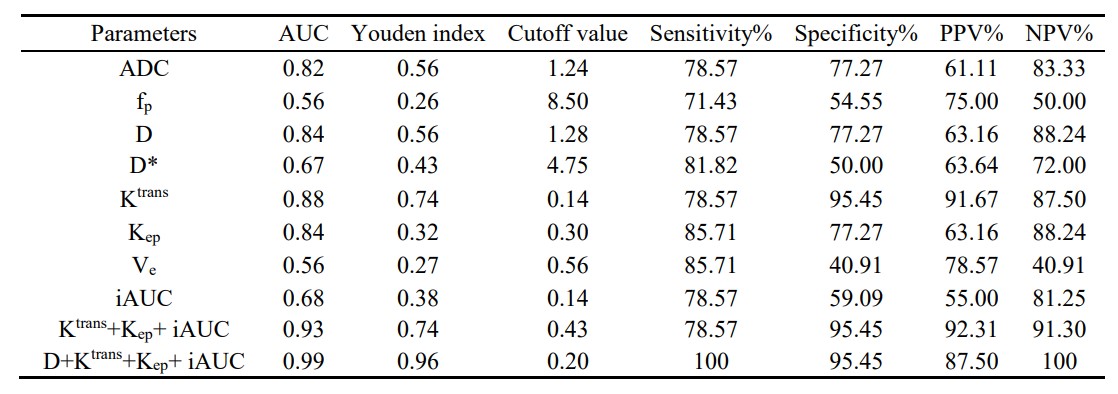
ROC curve analyses of ADC,IVIM-DWI and DCE-MRI
parameters to identify benign and malignant musculoskeletal tumors.
Diagnostic performance of IVIM-DWI
and DCE-MRI alone and combination model.
DOI: https://doi.org/10.58530/2023/0085