0084
Repeatability of in vivo T2 Relaxation Times Regional and Cluster Analysis in the Loaded Knee1Department of Mechanical Engineering, University of Saskatchewan, Saskatoon, SK, Canada, 2Siemens Healthcare Limited, Burnaby, BC, Canada, 3Department of Mechanical Engineering, University of Victoria, Victoria, BC, Canada, 4Department of Biomedical Engineering, University of Saskatchewan, Saskatoon, SK, Canada
Synopsis
Keywords: Cartilage, Cartilage
T2 relaxation time mapping of articular cartilage is most often assessed in relaxed knees; however, it’s primary function is resisting and distributing forces. Further, most work has focused on regional analysis rather than local changes. The aim of this work was to assess the repeatability of T2 relaxation time in the loaded knees of five healthy participants using both regional and local (cluster-based) approaches. We show that regional and local assessments are sufficiently repeatable for in vivo studies.Introduction
In day to day living the knee experiences a variety of different loads, many of which are applied while the knee is in flexion. Therefore, it is important to see how results from MRI scans are impacted when the knee is imaged under loaded flexion. T2 relaxation time is an MRI parameter that has previously been shown to relate to the collagen structure and water content of articular cartilage1,2. As well, it decreases in tibial and femoral cartilage in vivo with load3. Cluster analysis is a method used to find focal areas of change in T2 relaxation time that might otherwise be obscured by averaging across entire cartilage plates or even anatomical regions within those plates4. However, to understand how focal metrics have been used in in vivo studies, repeatability must be assessed. Therefore, the purpose of this study is to assess the repeatability of regional and focal changes in T2 relaxation time of tibial and femoral cartilage with time and load.Methods
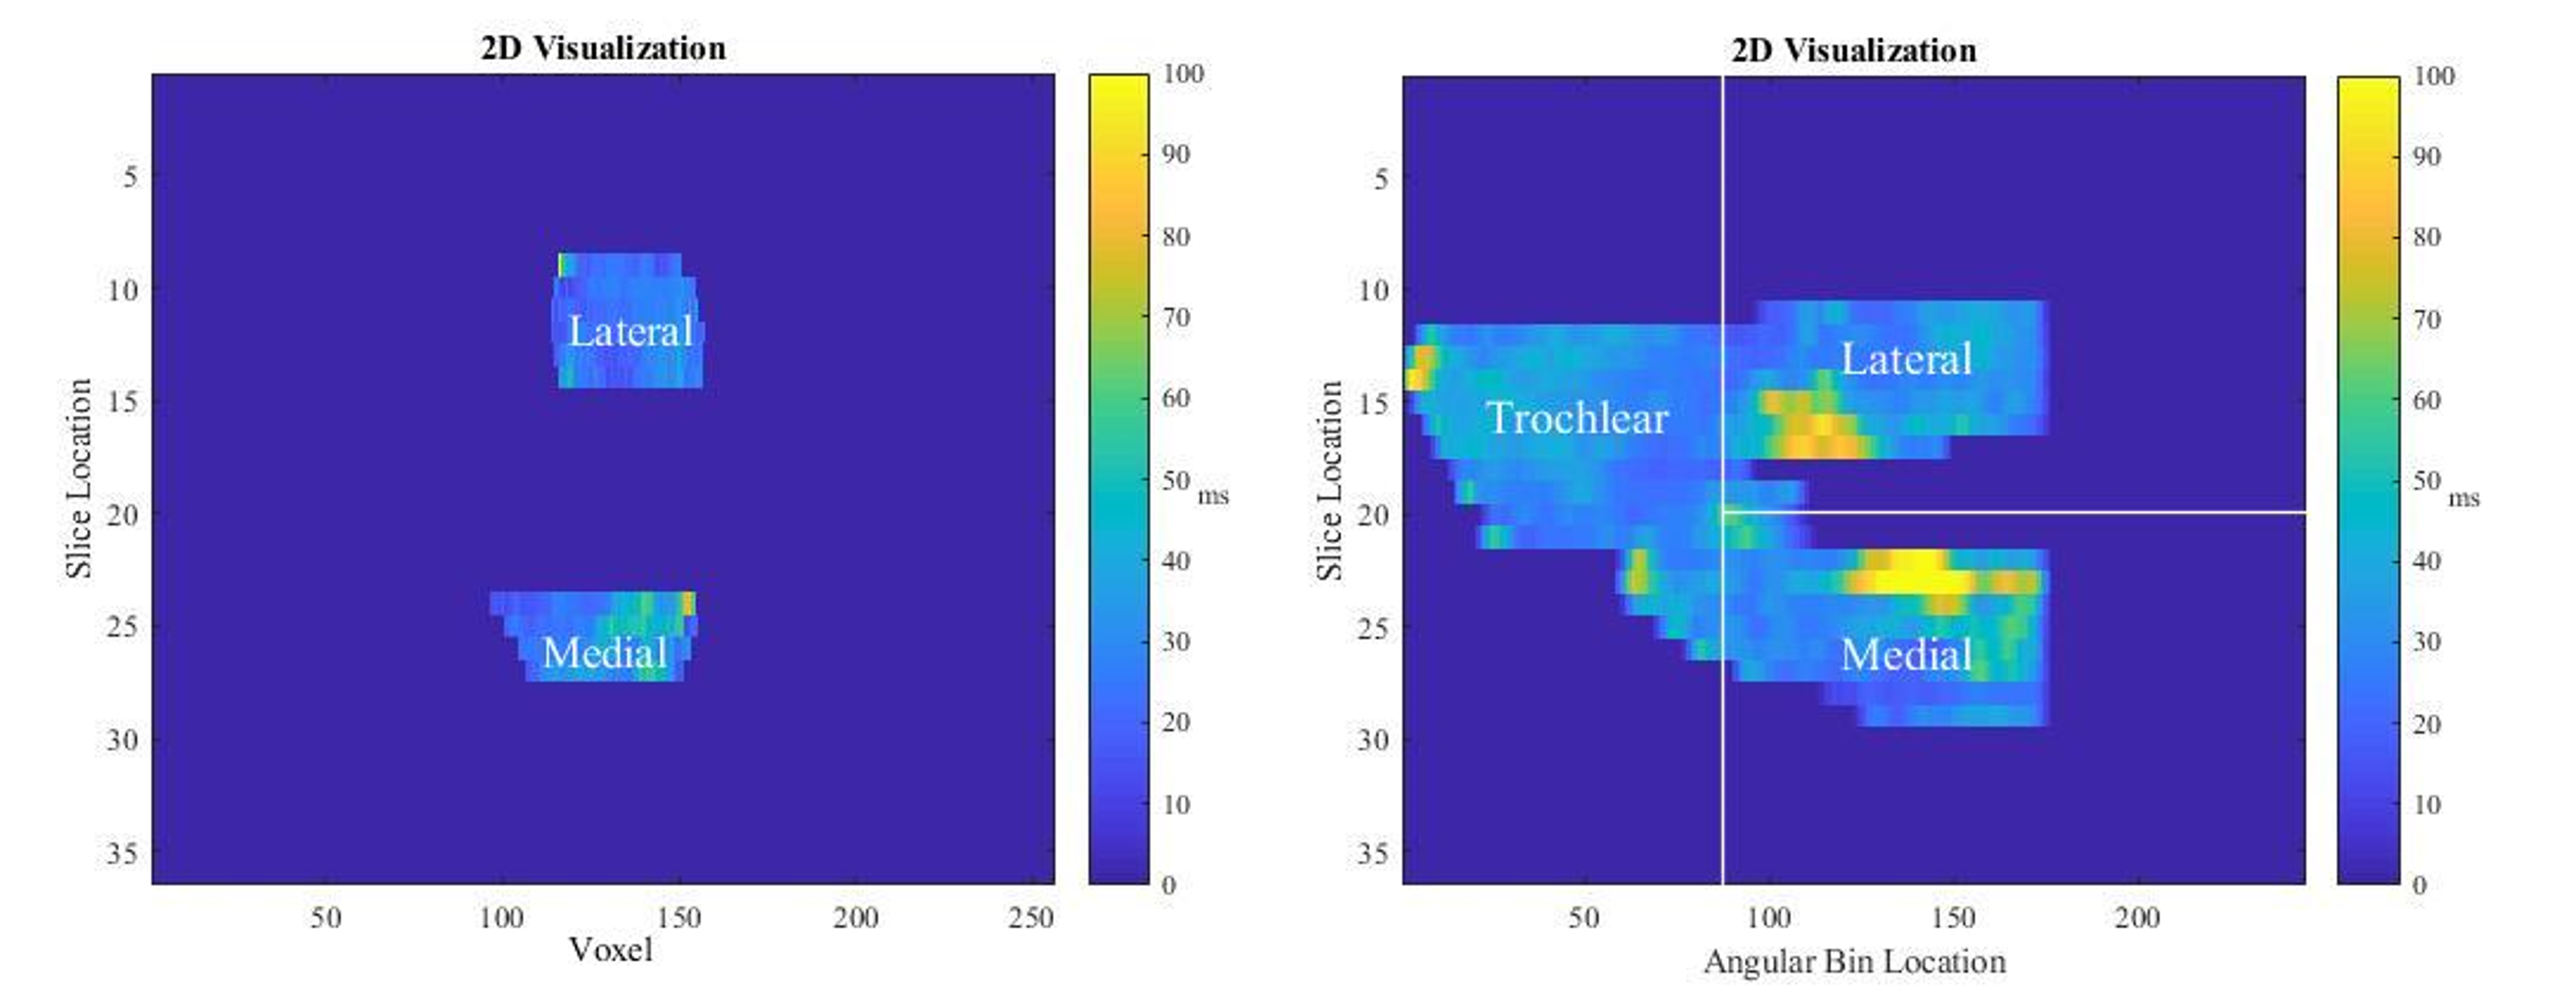
Five healthy participants (22.8±2.5yrs) were scanned on three days within one week using an in-house quantitative Double Echo at Steady State (qDESS) sequence (TR/TE1/TE2 = 22ms/6ms/38ms), a 3T MRI Scanner (MAGNETOM Skyra, Siemens Healthineers, Erlangen, Germany) and two flexible 18-channel Rx coils (Body-18, Siemens Healthcare, Erlangen, Germany). Two scans were taken in feet first supine orientation during each session: one with the knee in the relaxed, unloaded position and one with the knee in loaded flexion using an MRI-safe loading rig. The average load applied was 20% bodyweight. T2 maps were created using an extended phase graph (EPG) lookup table approach5. Tibial and femoral cartilage were manually segmented using packaged software (Analyze 14.0, AnalyzeDirect, Overland Park, USA). Binary masks of these segmentations were applied to T2 maps and projection maps of the tibial and femoral cartilage were created using in-house custom software (Matlab, The Mathworks, Natick, USA)4. For the tibia, T2 values were projected normal to the bone-cartilage interface and, for the femur, cylinders were fit to the condyles and T2 values were assigned to angular bins. For changes with time, scans from sessions 2 and 3 were registered to scans from session 1 using the Elastix package in Matlab6,7. Similarly, for changes with load, loaded scans were registered to unloaded scans. Next, difference maps were created for the registered data. Clusters of change with time or load that met area (1% of difference map area) and intensity (10 ms) thresholds were identified. Clusters were described as the percent area (%CA) and could indicate increases (positive) or decreases (negative) change with time or load. The intra-participant repeatability, expressed as root-mean-square standard deviation (SDrms), was assessed for: a) regional T2 relaxation time over time (unloaded and loaded scans (Figure 1)); b) clusters of T2 relaxation time change over time (unloaded and loaded scan sets assessed separately; session 2 and 3 compared to session 1 for each region); and c) clusters of change with load.Results
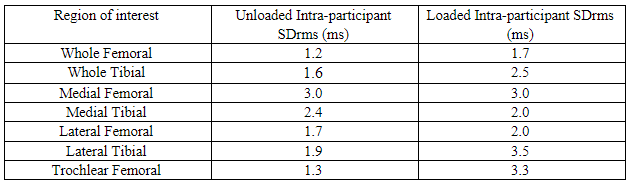
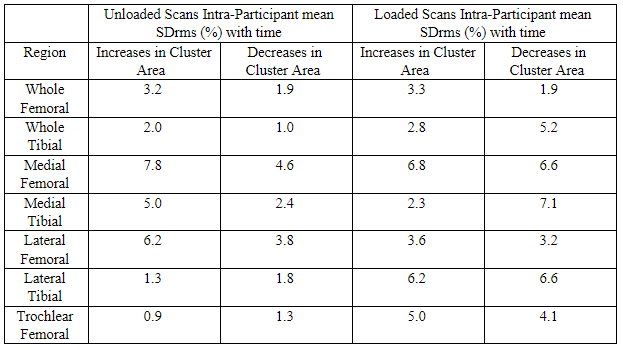
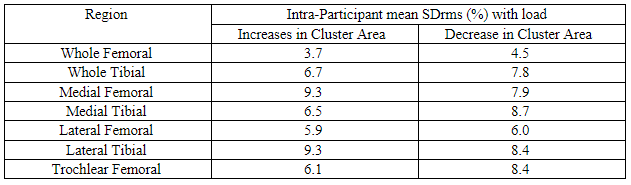
The repeatability of mean T2 relaxation times across all regions was less than 3ms for the unloaded scans and less than 3.5ms for the loaded scans (Table I). The unloaded scans had repeatability less than 7.8% for cluster areas of increased T2 over time and less than 4.6% for cluster areas of decreased T2 over time (Table II). The loaded scans had repeatability less than 6.8% for cluster areas of increased T2 over time and less than 6.6% for cluster areas of decreased T2 over time (Table II). Finally, over time repeatability was less than 9.3% for cluster areas of increased T2 with load and less than 8.4% for cluster areas of decreased T2 with load (Table III).Discussion
Repeatability of regional mean T2 relaxation times was similar to those reported previously in unloaded knees8. Loaded scans were generally less repeatable than unloaded scans. This difference in repeatability is likely due to the difficulty in repositioning the knee to the same angle at subsequent scans. Although care was taken to re-create the position by marking the centre of the knee and points on the upper and lower leg with indelible marker and using a goniometer, an assessment of three dimensional pose showed differences in knee angle of up to 24 degrees between scans. Another source of error might be the lower signal to noise ratio as a result of scanning off-isocentre loaded flexion scans. However, the repeatability is still reasonable for both. Repeatability of cluster areas for changes with time was better than for changes with load, likely due similarities between scan position for unloaded time points. Qualitatively, clusters were not consistently in the same location over time; this is likely due to differences in changes in water distribution between scans.Conclusions
Regional and clusters-based assessments of T2 relaxation time are sufficiently repeatable to be used in in vivo knee loading studies.Acknowledgements
No acknowledgement found.References
1. J.G. Raya, U. Ferizi, A. Ruiz, S.B. Abramson, J. Bencardino, S. Krasnokutsky Samuels. Changes in collagen and proteoglycan in cartilage with OA severity. ISMRM. (2017) 5087.
2. M.T. Nieminen, J. Rieppo, J. Töyräs, J.M. Hakumäki, J. Silvennoinen, M.M. Hyttinen, H.J. Helminen, J.S. Jurvelin. T2 relaxation reveals spatial collagen architecture in articular cartilage: a comparative quantitative MRI and polarized light microscopic study. Magn. Reason. Med. 46 (2001) 487-493. https://doi.org/10.1002/mrm.1218.
3. K. Subburaj, R.B. Souza, C. Stehling, B.T. Wyman, M.P. Le Graverand-Gastineau, T.M. Link, X. Li, S. Majumdar. Association of MR relaxation and cartilage deformation in knee osteoarthritis. J. Orthop. Res. 30 (2012) 919-926. https://doi.org/10.1002/jor.22031.
4. U.D. Monu, C.D. Jordan, B.L. Samuelson, B.A. Hargreaves, G.E. Gold, E.J. McWalter. Cluster analysis of quantitative MRI T2 and T1r relaxation times of cartilage identifies differences between healthy and ACL-injured individuals at 3T. Osteoarthr. Cartil. 25 (2017) 513-520. https://doi.org/10.1016/j.joca.2016.09.015.
5. E. Staroswiecki, K.L. Granlund, M.T. Alley, G.E. Gold, B.A. Hargreaves. Simultaneous estimation of T-2 and apparent diffusion coefficient in human articular cartilage in vivo with a modified three-dimensional double echo steady state (DESS) sequence at 3 T. Magn. Reason. Med. 67 (2012) 1086-1096. https://doi.org/10.1002/mrm.23090
6. S. Klein, M. Staring, K. Murphy, M.A. Viergever, J.P.W. Pluim. elastix: a toolbox for intensity based medical image registration, IEEE Trans. Med. Imaging. 29 (2010) 196-205. https://doi.org/10.1109/TMI.2009.2035616
7. D.P. Shamonin, E.E. Bron, B.P.F. Lelieveldt, M. Smits, S. Klein, M. Staring. Fast Parallel Image Registration on CPU and GPU for Diagnostic Classification of Alzheimer's Disease. Front. Neuroinform. 7 (2014) 1-15. https://doi.org/10.3389/fninf.2013.00050.
8. Jordan CD, McWalter EJ, Monu UD, Watkins RD, Chen W, Bangerter NK, Hargreaves BA, Gold GE. Variability of CubeQuant T-1 rho, quantitative DESS T-2, and cones sodium MRI in knee cartilage. Osteoarthritis and Cartilage (2014) 1559-1567. 10.1016/j.joca.2014.06.001.
Figures