0083
Characterising Magnetic Field Drift in Rosette-MRSI Data in-vivo
Sneha Vaishali Senthil1,2, Brenden Toshihide Kadota1, Peter Truong1, and Jamie Patrick Near1
1Medical Biophysics, Sunnybrook Research Institute, Toronto, ON, Canada, 2Integrated Program in Neuroscience, McGill University, Montreal, QC, Canada
1Medical Biophysics, Sunnybrook Research Institute, Toronto, ON, Canada, 2Integrated Program in Neuroscience, McGill University, Montreal, QC, Canada
Synopsis
Keywords: Data Processing, Spectroscopy, Frequency drift correction, MRSI
Field drift correction is an important post-processing step in MRS and MRSI that yields considerable improvements in spectral quality and metabolite quantification. While several drift correction methods have been proposed in single-voxel MRS, drift correction in MRSI is more challenging due to the application of phase encoding gradients. In such cases, separately acquired navigator echoes are needed. Here, we demonstrate the use of self-navigating Rosette-MRSI trajectories for characterising scanner magnetic field drift using time-domain spectral registration in-vivo. Results from the study showed substantial increases in SNR and spectral quality of the acquired data.Introduction
MRS/MRSI data are subject to spectral peak broadening, lineshape distortions and spectral misalignment errors owing to the shot-to-shot accrual of frequency and phase variations induced by B0 field distortions caused by gradient heating [1]. In single voxel MRS, several methods have been proposed for B0 field drift correction, including spectral registration [2], residual water peak correction [3] and Lorentzian lineshape fitting [4]. However, drift correction in MRSI proves to be more challenging as multiple repetitions do not share common k-space points that can be used for estimating drifts. Techniques using separately acquired navigator echoes have been proposed to address this issue, however, this in turn extends acquisition times, thereby limiting the clinical potential of MRSI. A Rosette-MRSI acquisition overcomes these shortcomings by capturing the center of k-space during every repetition thus acting as a self-navigator for estimating the frequency and phase drift at each scan [5]. Here we demonstrate the characterisation of this field drift in-vivo and the application of time-domain spectral registration to correct for the resulting frequency and phase variations.Methodology
Data acquisition: A two-dimensional (2D) PRESS-localised Rosette-MRSI sequence (Figure 1(A)) was implemented on a 3T Prisma MR scanner (Siemens, Erlangen, Germany) at Sunnybrook Research Institute, Toronto, Canada with a 20-channel phased array head coil and, the following in-vivo scan parameters: spectral width=1587Hz, FOV=240mm, FA (flip angle) =72°, 48x48 matrix size, 8 averages, TR/TE=1200/30ms, nominal voxel size 5x5x15mm3, WET water suppression consisting of three frequency selective pulses each with a duration of 25.6ms and a bandwidth of 80Hz, and total scan time ~9min. Four OVS (outer volume suppression) bands of 30mm thickness each were manually placed around the edges of the PRESS localization region to suppress extracranial lipid signals. Rosette MRSI data were acquired in five healthy volunteers (4 males, 1 female; age: 29±6 years) with no history of brain disease. Prior to the Rosette-MRSI scan, a 3D T1-weighted, MP-RAGE (Magnetization Prepared RApid Gradient Echo) image was acquired for localisation purposes [6].Data processing and field drift characterization: Data processing and reconstruction were performed using the FID-A toolkit in MATLAB [7]. To correct for field drift, FIDs from the centre of k-space were isolated from each repetition. Next, using the first k=0 FID as a reference, frequency and phase offsets for each subsequent repetition were estimated using spectral registration [2,5], which uses non-linear least squares minimization to optimally align each FID signal to the reference spectrum. Once the frequency and phase offsets for each k=0 FID were estimated, the corresponding corrections were applied to full ADC signals, to achieve field drift correction across the entire k-space. This was performed independently for each RF channel. SNR (amplitude of the NAA peak divided by the standard deviation of the noise) and NAA linewidths of the water suppressed spectra were compared before and after drift correction to assess improvements in spectral quality.
Results and Discussion
Results of the in-vivo Rosette-MRSI acquisition and frequency drift measurement are shown in Figure 2(A). The resonant frequency drifted approximately linearly by a total of 5.7Hz across all scans during the 9-minute acquisition duration for the representative dataset. Since none of the scans in this study were preceded by gradient-heavy EPI or Diffusion imaging sequences, the observed frequency drift is likely due to gradient heating induced by the rosette gradients themselves. The mean frequency drift measured across all datasets was 5.8Hz. Figure 2(B) shows water suppressed spectra from an arbitrarily chosen 3x3 voxel array from the reconstructed MRSI grid. Spectral registration resulted in a noticeable improvement in SNR, spectral linewidths and the lineshape of metabolite peaks. Figure 3 shows NAA SNR and NAA linewidth maps measured before and after drift correction in a representative subject. Across all voxels in all subjects, the average values of SNR increased by ~12.92% [t(528)=-16.05,p<0.001] and the NAA linewidths decreased by ~18.51% [t(530)=29.99,p<0.001] (Table 1). Figure 4 gives the box plot representation of improvement in SNR and linewidth post-drift correction for each individual subject as well as for the study cohort as a whole. Future work will involve the assessment of improvement in the quantification of metabolite concentrations post spectral registration.Conclusion
This study demonstrated the use of the self-navigating Rosette-MRSI trajectories to retrospectively eliminate the adverse effect of frequency and phase drifts in the acquired in-vivo MRSI data. Since rapid high-resolution MRSI sequences are gradient-intensive, correction of gradient-induced field drift is an important consideration, and the proposed method allows these drifts to be easily measured and corrected.Acknowledgements
This research was supported by the Canadian Institutes of Health Research (PJT-165869, J.N.) and the Natural Sciences and Engineering Research Council (RGPIN-2020-05917, J.N.).References
- Rowland BC, Liao H, Adan F, Mariano L, Irvine J, Lin AP. Correcting for Frequency Drift in Clinical Brain MR Spectroscopy. J Neuroimaging. 2017;27(1):23-28. doi:10.1111/jon.12388
- Near J, Edden R, Evans CJ, Paquin R, Harris A, Jezzard P. Frequency and phase drift correction of magnetic resonance spectroscopy data by spectral registration in the time domain. Magn Reson Med. 2015;73(1):44-50. doi:10.1002/mrm.25094
- Helms G, Piringer A. Restoration of motion-related signal loss and line-shape deterioration of proton MR spectra using the residual water as intrinsic reference. Magn Reson Med. 2001;46(2):395-400. doi:10.1002/mrm.1203
- Waddell KW, Avison MJ, Joers JM, Gore JC. A practical guide to robust detection of GABA in human brain by J-difference spectroscopy at 3 T using a standard volume coil. Magn Reson Imaging. 2007;25(7):1032-1038. doi:10.1016/j.mri.2006.11.026
- Senthil S, Kadota B, Near J. Frequency and Phase Drift Correction of Rosette MRSI data using Spectral Registration. ISMRM 2022
- Marques JP, Kober T, Krueger G, van der Zwaag W, Van de Moortele PF, Gruetter R. MP2RAGE, a self bias-field corrected sequence for improved segmentation and T1-mapping at high field. Neuroimage. 2010;49(2):1271-1281. doi:10.1016/j.neuroimage.2009.10.002
- Simpson R, Devenyi GA, Jezzard P, Hennessy TJ, Near J. Advanced processing and simulation of MRS data using the FID appliance (FID-A)-An open source, MATLAB-based toolkit. Magn Reson Med. 2017;77(1):23-33. doi:10.1002/mrm.26091
Figures
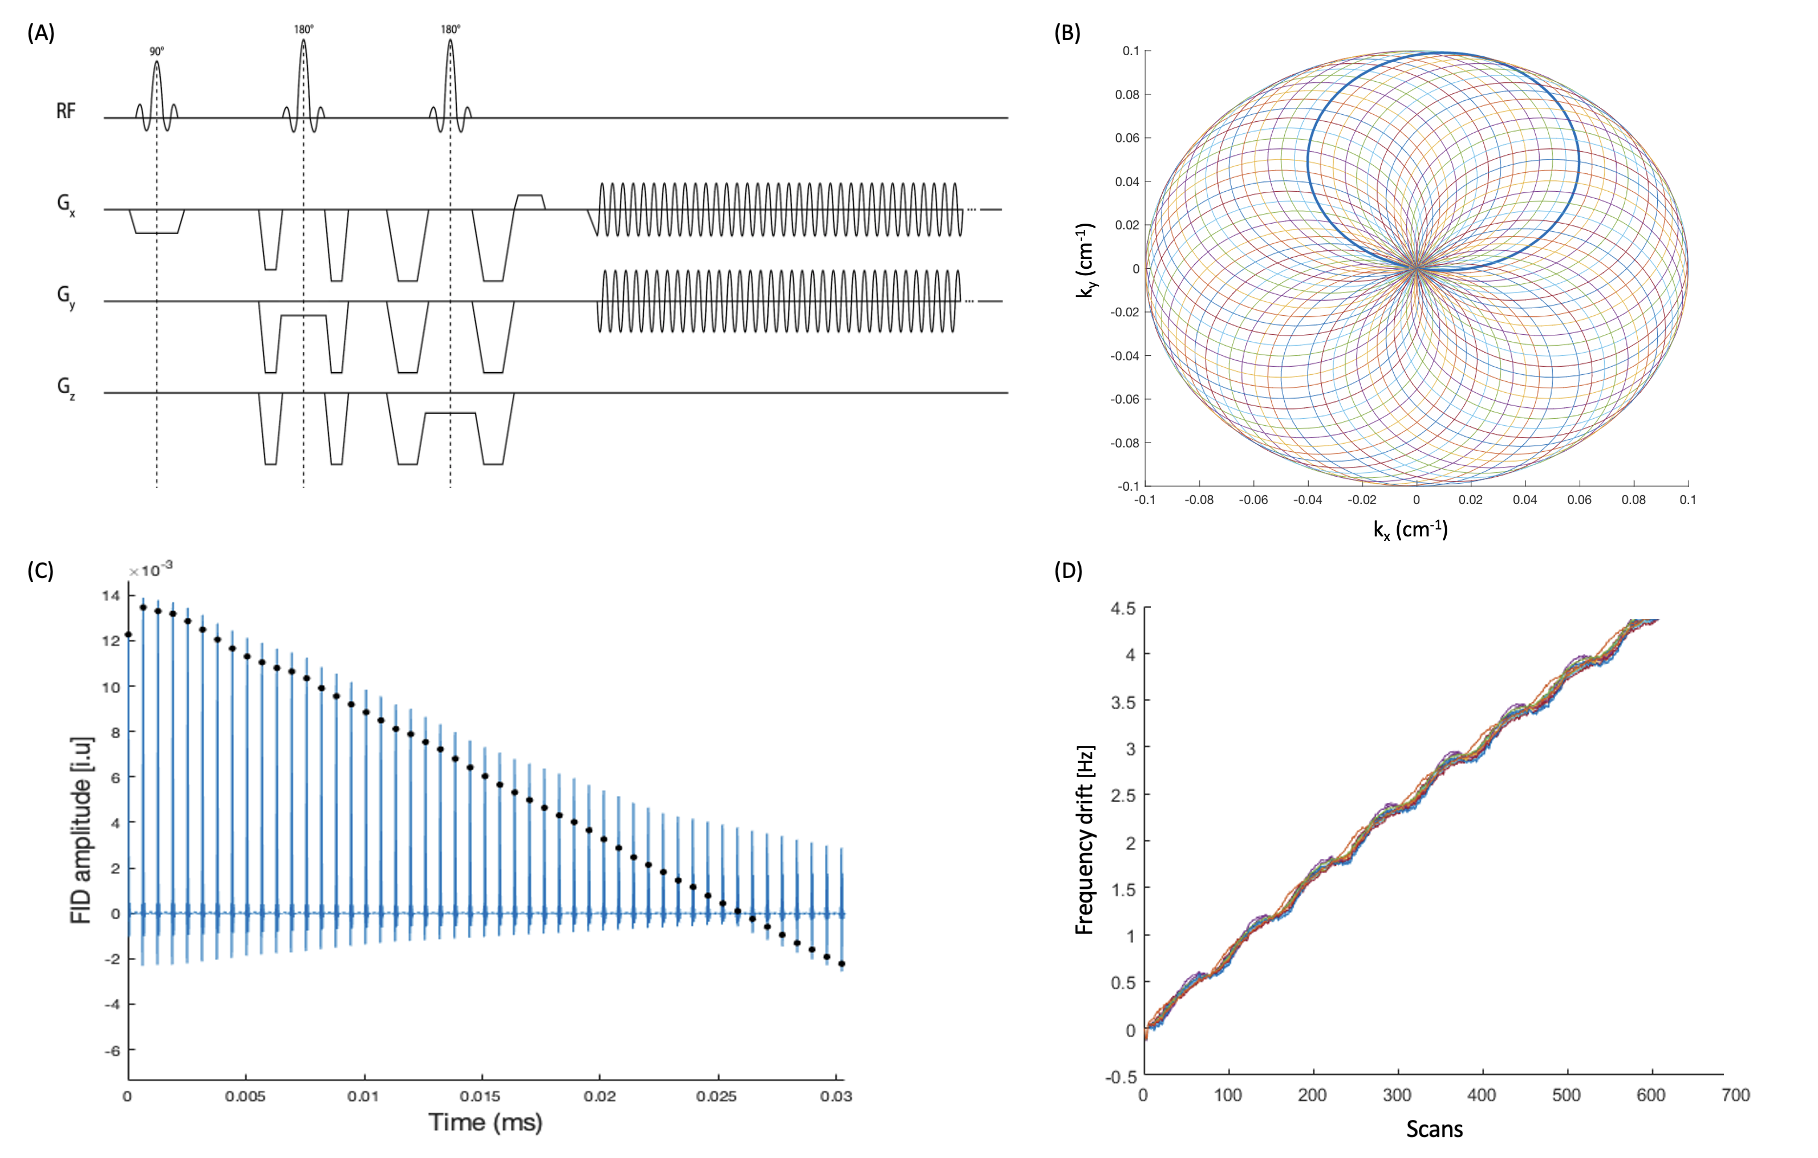
Figure 1: (A) Pulse sequence diagram for spin-echo based Rosette-MRSI sequence (B) Rosette k-space trajectory (C) Time domain signal for a single shot and first coil channel (D) Depiction of frequency drift measurement employing the self-navigating properties of Rosette-MRSI.
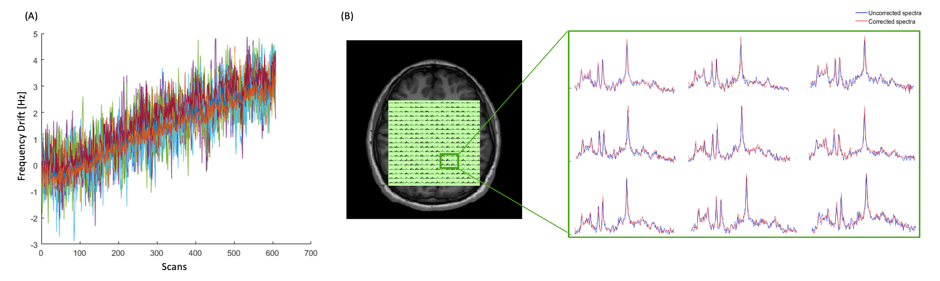
Figure 2: (A) Plot of frequency drift measured for each coil channel and shot over 608 scans (76 shots x 8 averages). The scanner frequency drift for this scan was estimated to be 0.63Hz/min, with a total drift of 5.7Hz. (B) Water-suppressed spectra from an arbitrarily chosen 3x3 voxel array in the reconstructed MRSI grid before (blue line) and after (red line) drift correction.
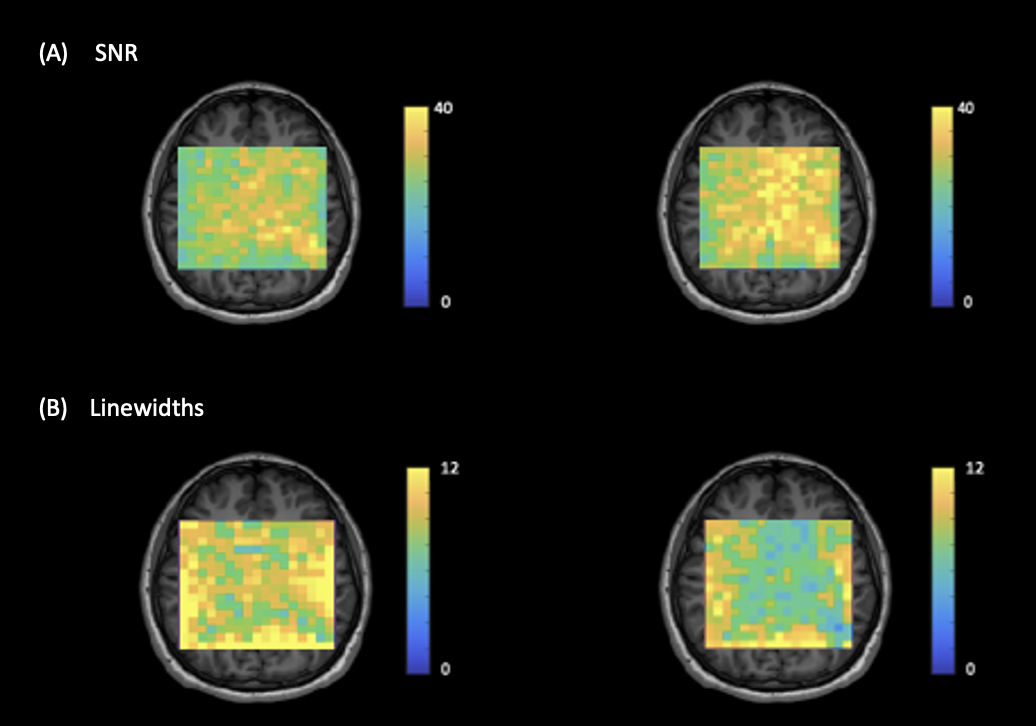
Figure 3: Illustration of (A) NAA SNR and (B) NAA linewidth maps generated using FID-A, pre- and post-field drift correction in a representative subject. The SNR increased by 14.83% and the linewidth decreased by 14.42%.
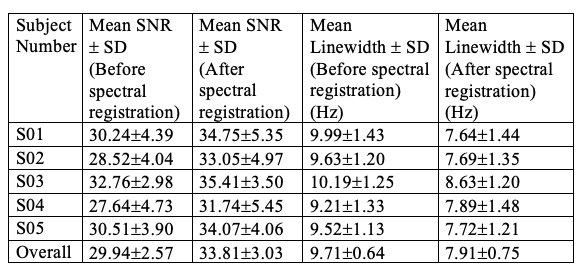
Table 1: Mean values of SNR and NAA linewidth measured for each individual subject as well as for the study cohort as a whole, before and after spectral registration.
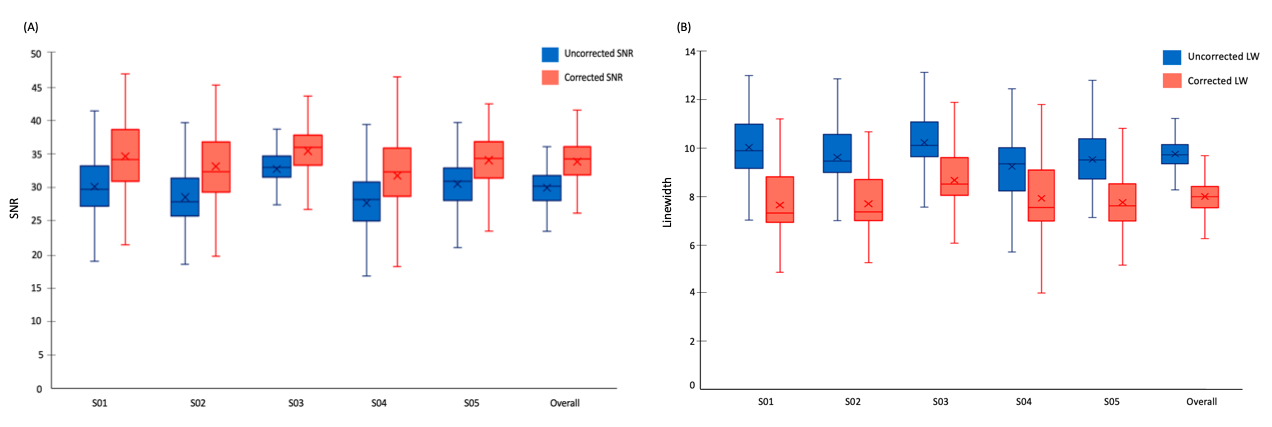
Figure 4: Box plot representation of improvement in (A) SNR and (B) Linewidth for each individual subject as well as for the study cohort as a whole, post-drift correction.
DOI: https://doi.org/10.58530/2023/0083