0081
Multimodal anatomical mapping of subcortical regions in Marmoset monkeys using ultra-high resolution MAP-MRI and multiple histological stains1Section on Quantitative Imaging and Tissue Sciences (SQITS), Eunice Kennedy Shriver National Institute of Child Health and Human Development (NICHD-NIH), Bethesda, MD, United States, 2Scientific and Statistical Computing Core, National Institute of Mental Health (NIMH-NIH), Bethesda, MD, United States, 3Neuroimaging core, National Institute of Neurological Disorders and Stroke (NINDS-NIH), Bethesda, MD, United States, 4Microscopy and Imaging Core (MIC), Eunice Kennedy Shriver National Institute of Child Health and Human Development (NICHD-NIH), Bethesda, MD, United States
Synopsis
Keywords: Visualization, Ex-Vivo Applications, MAP-MRI, subcortical, histology, Marmoset, and diffusion MRI
Despite its importance as a model for human brain development and neurological disorders, the marmoset lacks a comprehensive MRI-histology-based parcellation of subcortical regions. Here, we mapped the subcortical areas of the marmoset brain in three dimensions (3D) using ultra-high resolution MAP-MRI, T2w, and MTR imaging at 7T, combined with histological stains of the same brain. Our results demonstrate that MAP-MRI can delineate cytoarchitectonic subregions of many deep brain structures observed with histology. Tracing and validating these important brain regions in 3D are imperative for neurosurgical planning, navigation of deep brain stimulation probes, and establishing brain structure-function relationships.INTRODUCTION
Subcortical nuclei and other deep brain structures play essential roles in regulating high-level functions in the central and peripheral nervous systems. Many of these nuclei and their subregions are challenging to identify in conventional MRI due to their small size, buried location, and often subtle contrast compared to neighboring regions. To address this problem, we combined an advanced ultra-high resolution diffusion MRI method, called mean apparent propagator (MAP)-MRI1,2, T2w, and MTR imaging with various histological stains derived from the same marmoset brain to delineate the subcortical nuclei and associated white matter pathways in 3D.METHODS
We scanned two adult perfusion-fixed marmoset brains on a 7T scanner using MAP-MRI with 150μm resolution. We acquired a total of 112 or 256 diffusion-weighted images with multiple b-values (bmax=10000s/mm2), pulse duration δ=6 or 8 ms, and diffusion time Δ=28 or 20 ms. In each voxel, we estimated the MAP and computed microstructural DTI/MAP parameters: fractional anisotropy (FA); mean, axial, and radial diffusivities (MD, AD, and RD, respectively); propagator anisotropy (PA), non-gaussianity (NG), return-to-origin probability (RTOP), return-to-axis probability (RTAP), and return-to-plane probability (RTPP), along with the fiber orientation distribution functions (fODFs)3. The MT ratio (MTR) was computed from images acquired with and without MT preparation.Following MRI acquisition, we prepared the brain specimens for histological processing with multiple stains4. An alternating series of 50μm thick coronal sections were processed with Nissl, Acetylcholinesterase (AchE), and Prussian blue (iron stain), or immunohistochemically with antibodies against parvalbumin, neurofilament protein (SMI-32), neuronal nuclear protein (NeuN), and choline acetyltransferase (ChAT). The scanned high-resolution images of these different cell bodies and fiber-stained sections were manually registered to corresponding maps of MAP-MRI parameters images to allow analysis in histologically-defined regions in the thalamus, basal ganglia, hypothalamus, amygdala, brainstem, and cerebellum.
RESULTS
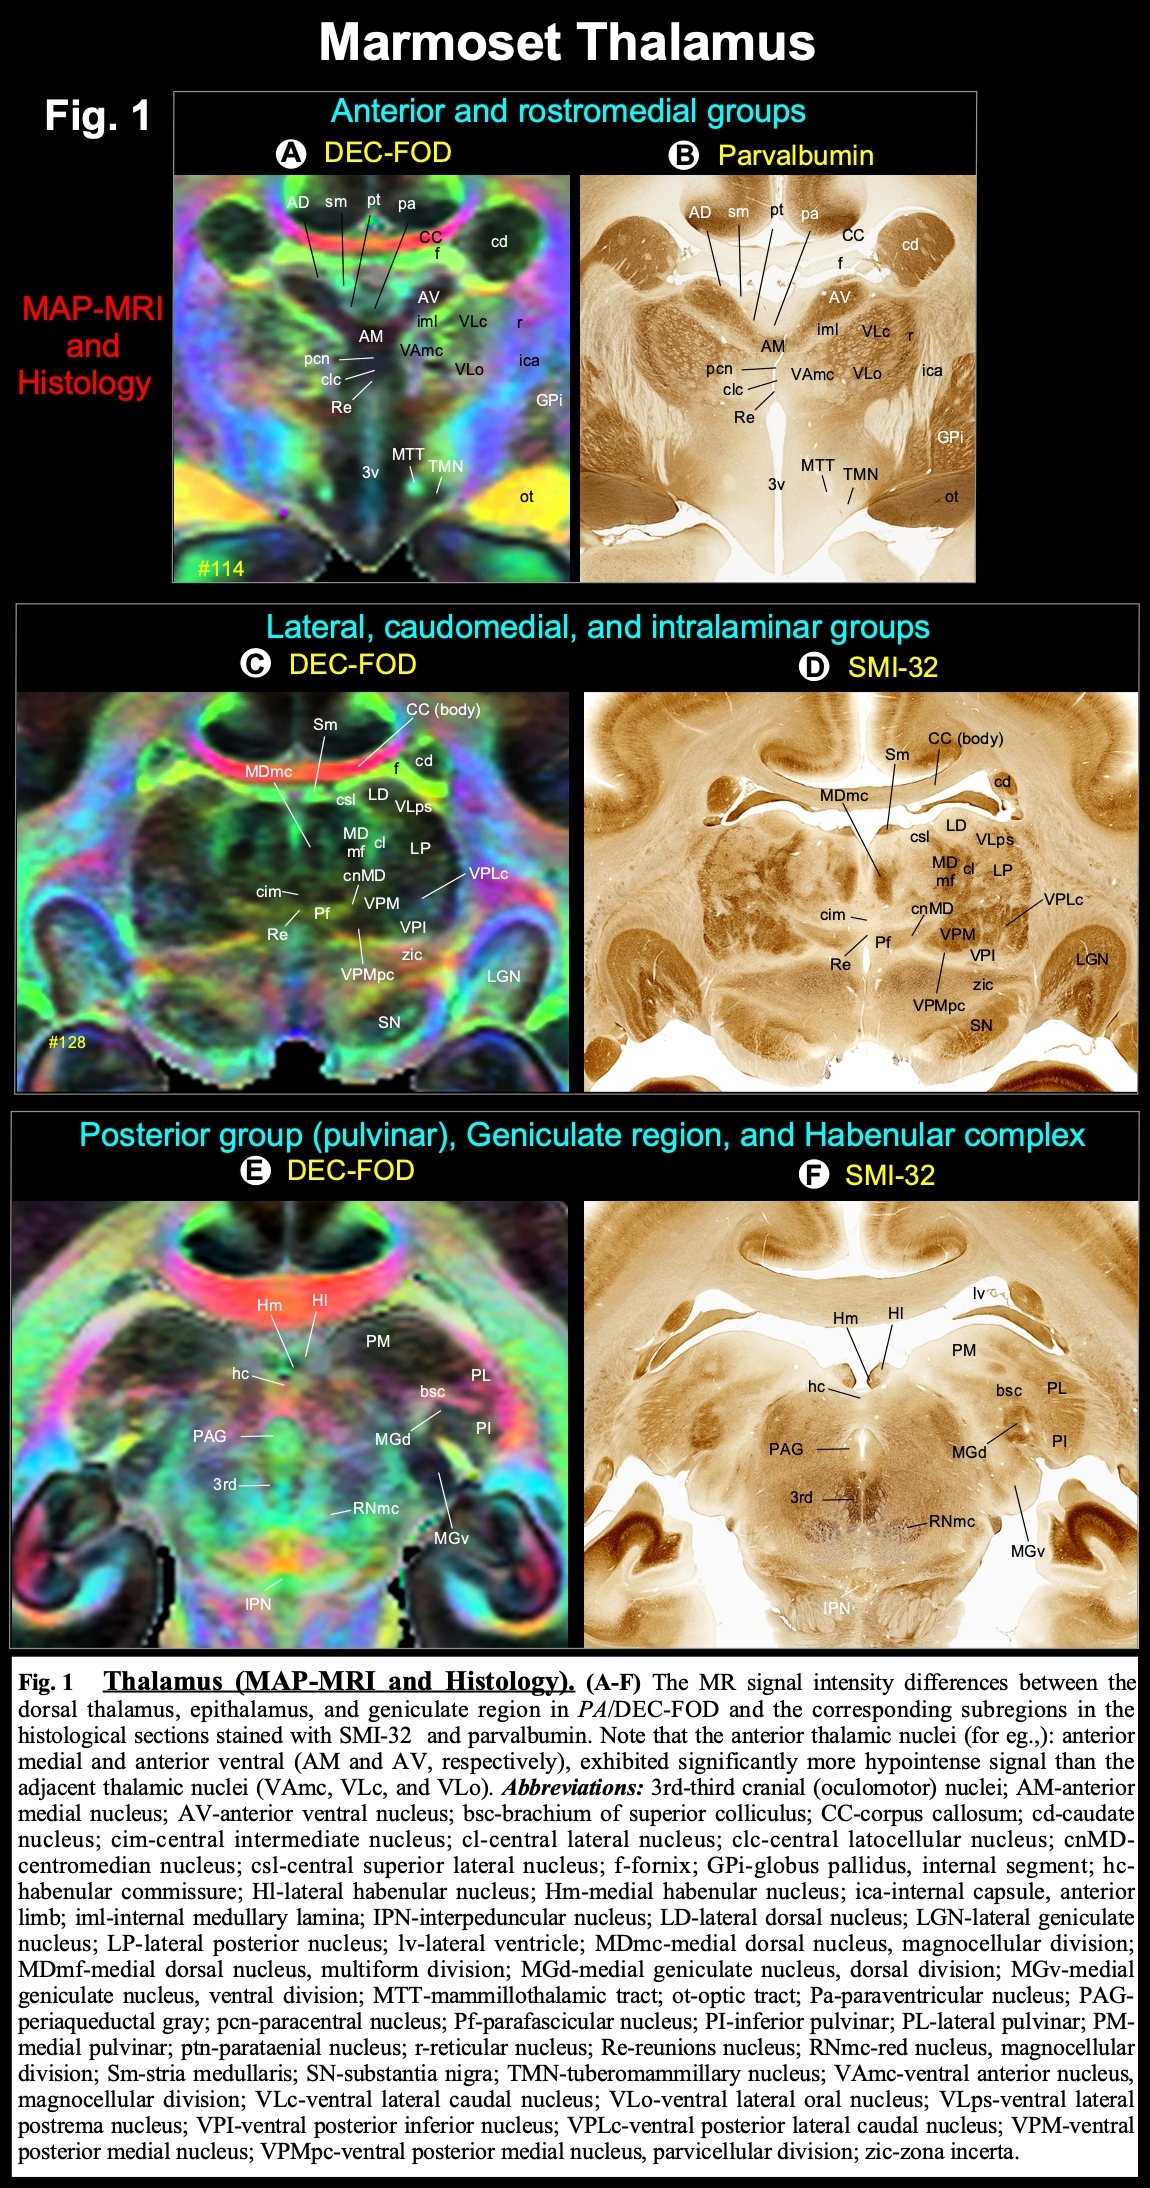
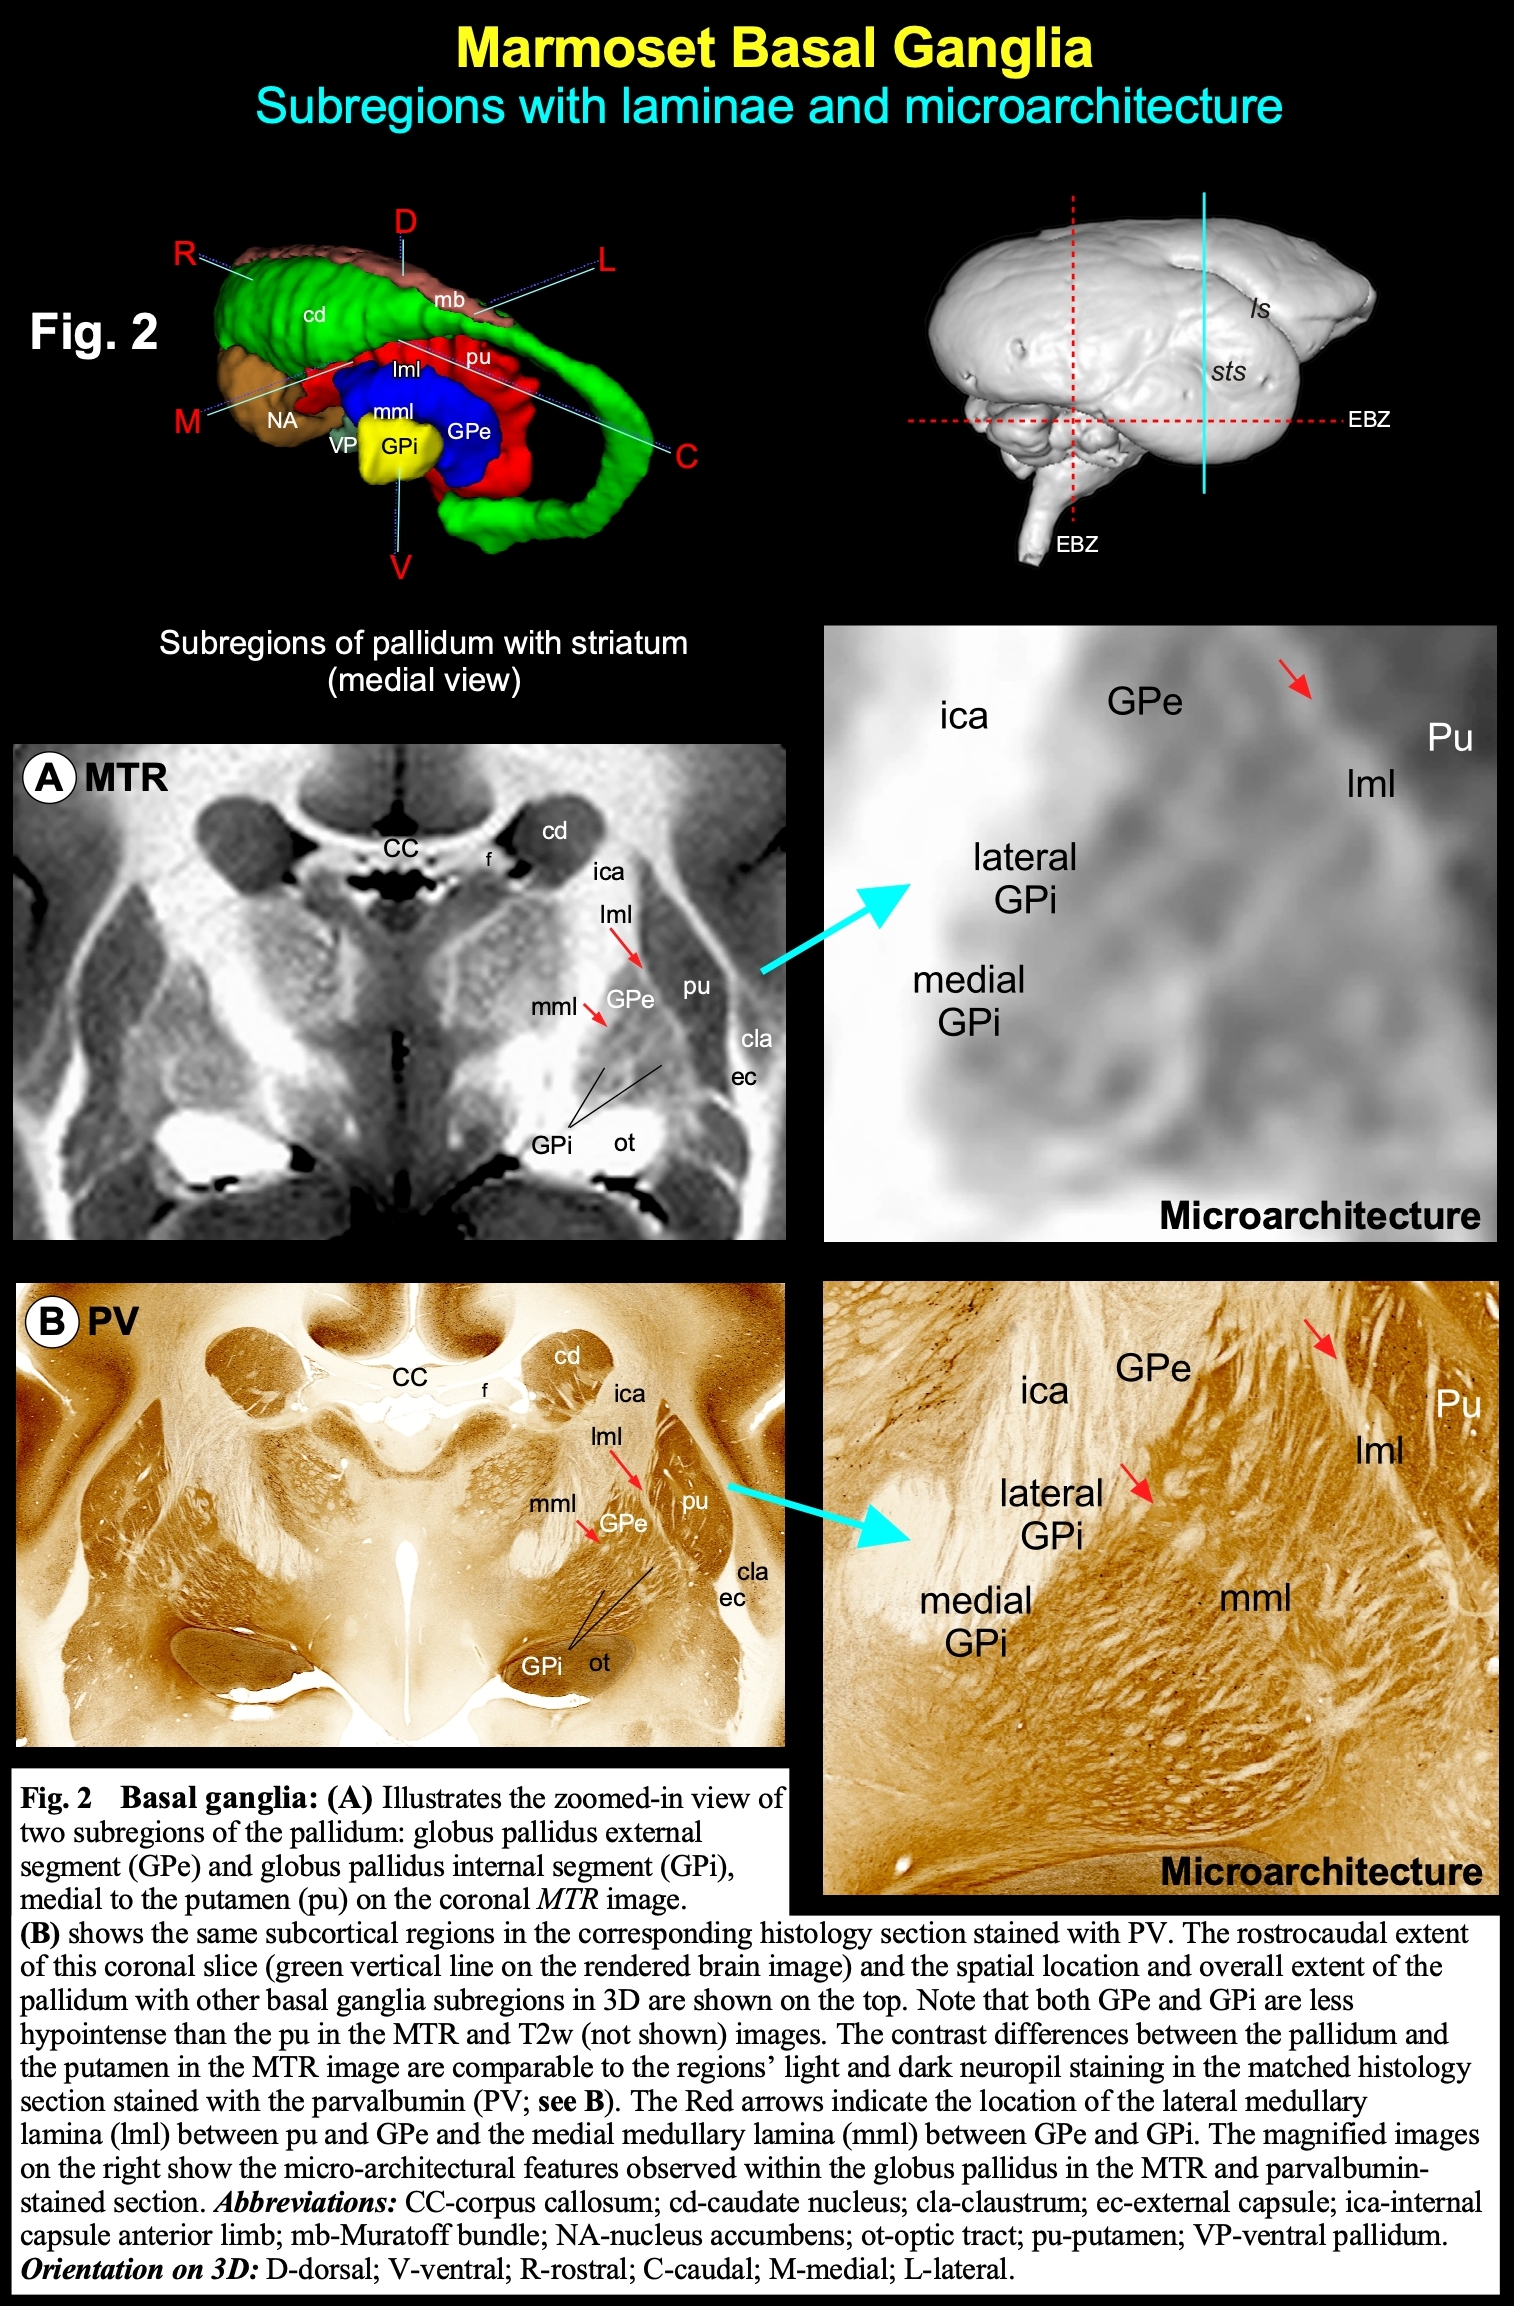
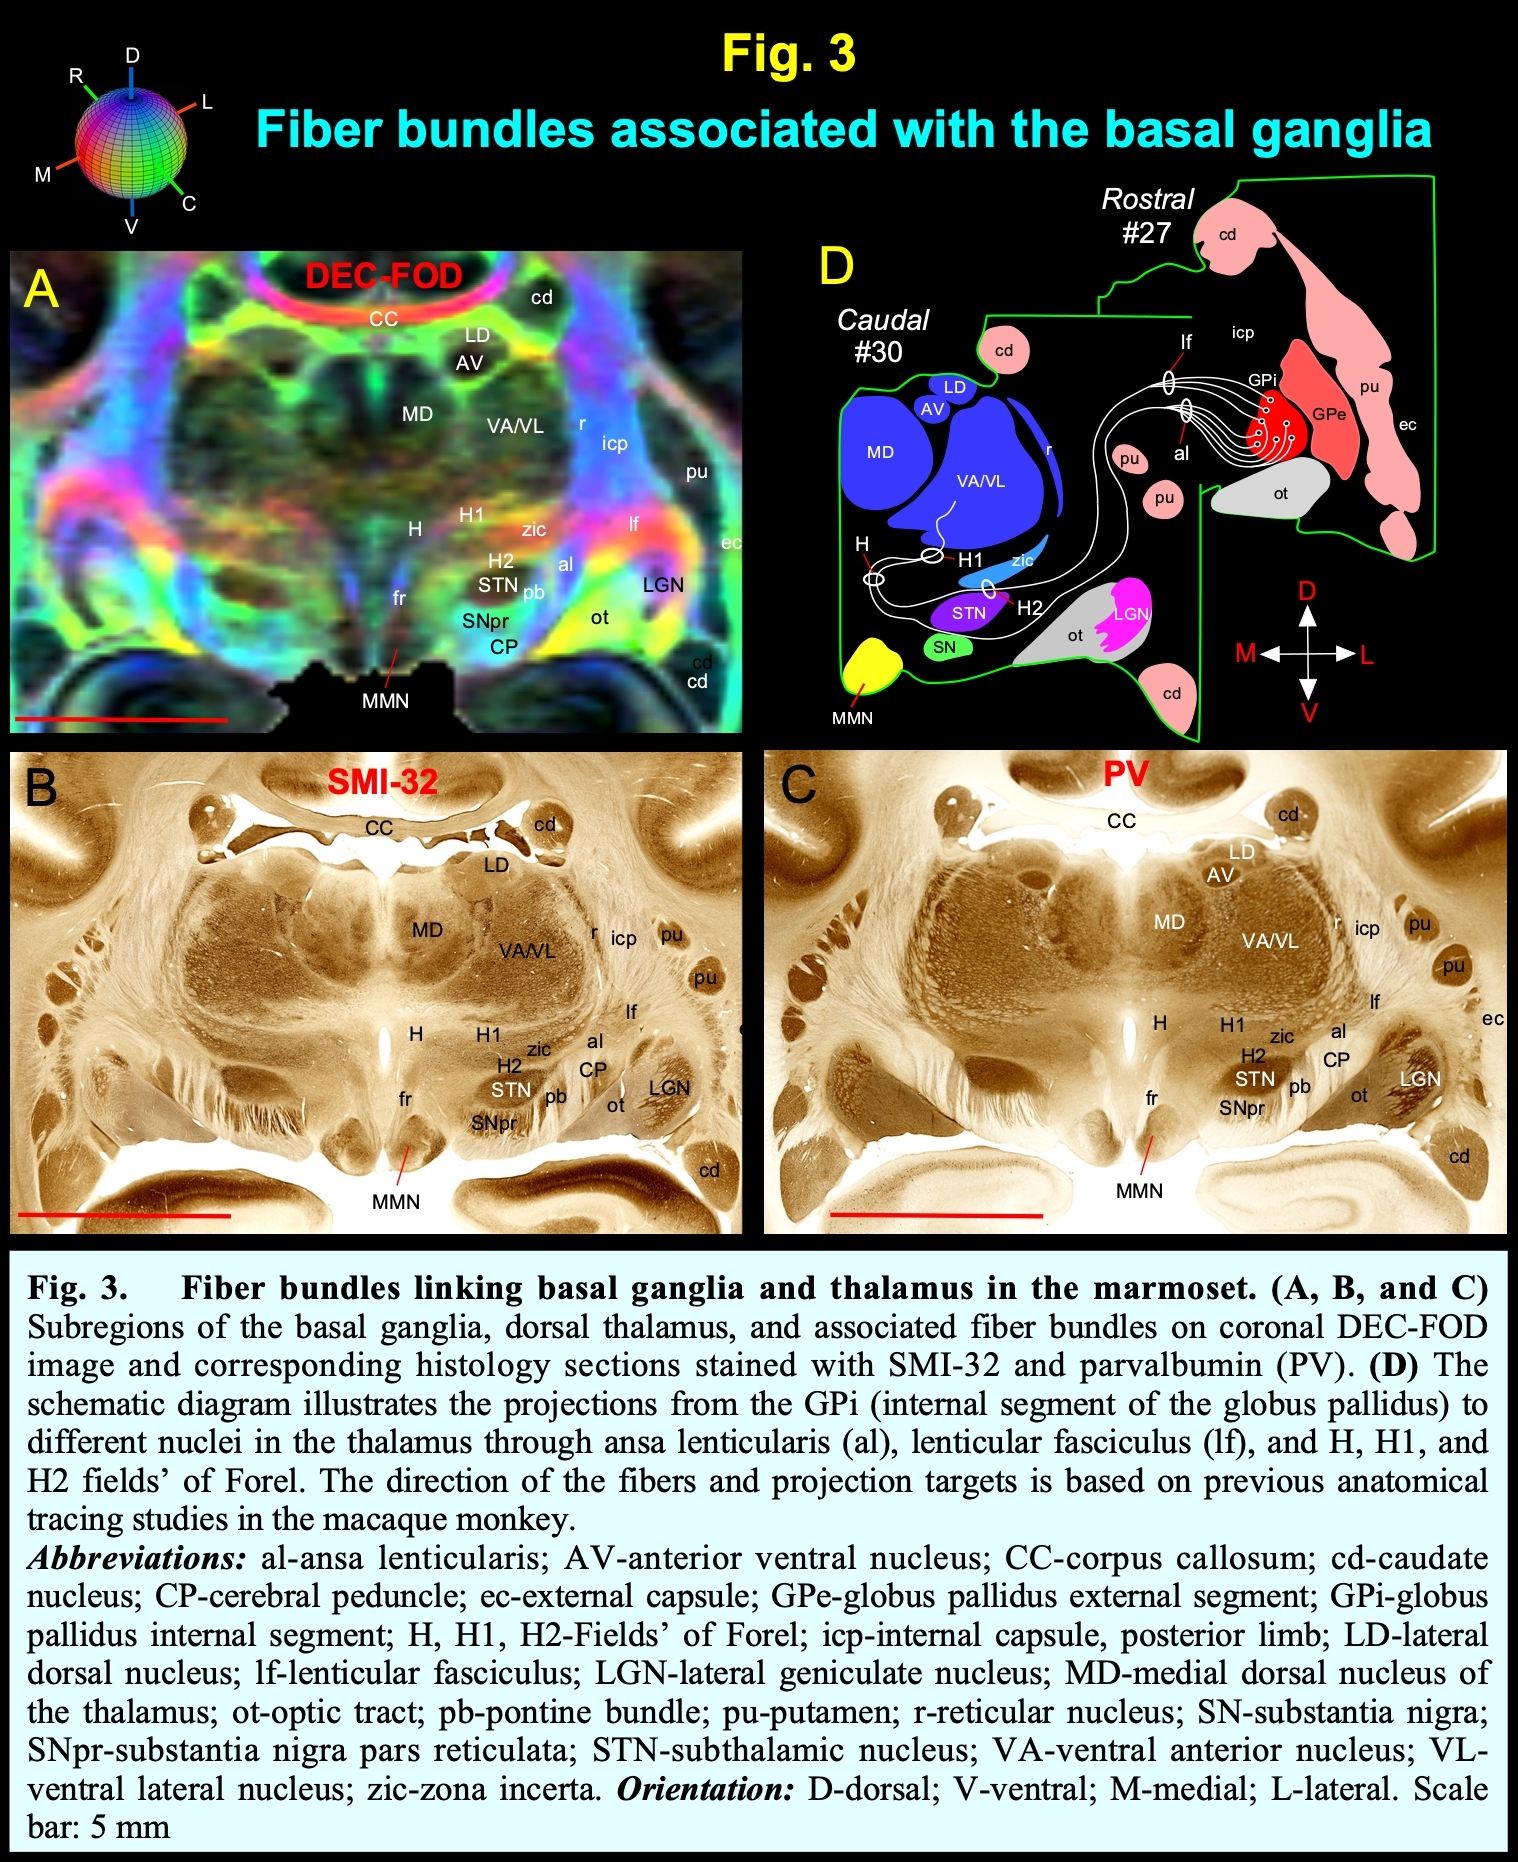
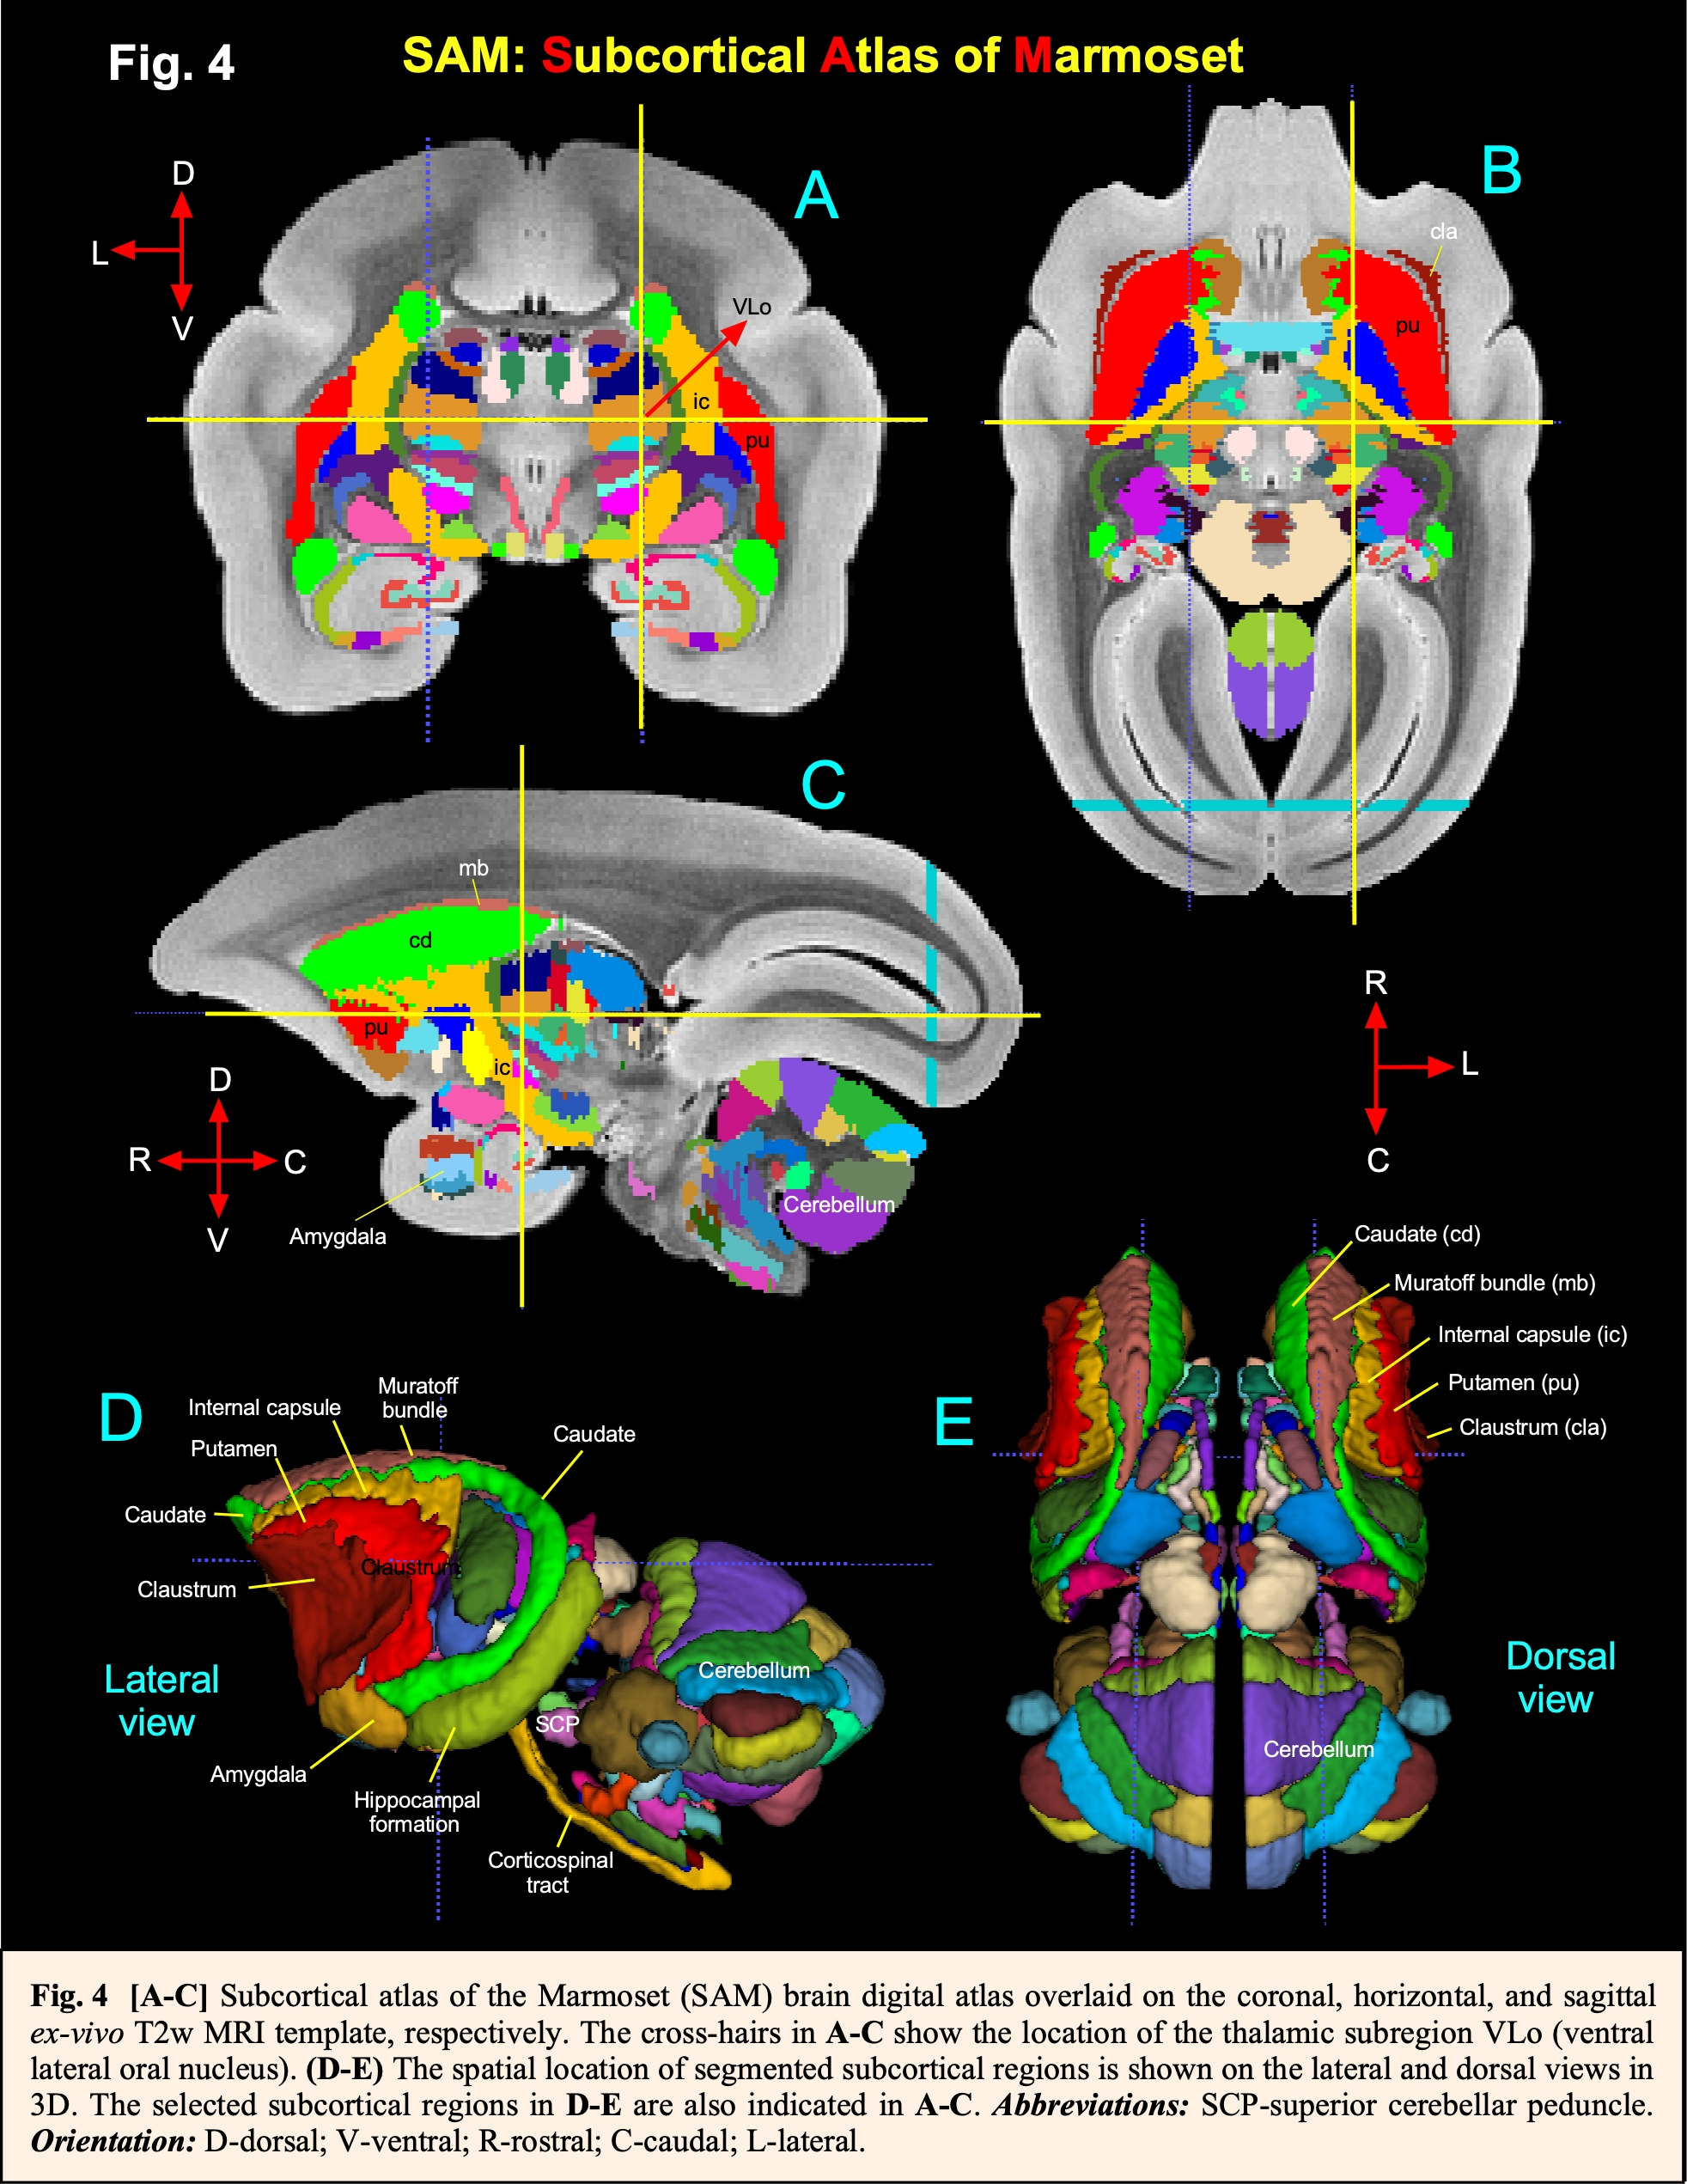
The MAP-MRI and other MRI parameters showed different gray and white matter contrast outside the cerebral cortex. In particular, the PA or the PA-weighted direction encoded color (DEC) map5 derived from the fiber orientation distribution functions (fODFs), RTAP, as well as T2-weighted and MTR images revealed sharp boundaries and high contrast in the deep brain structures, resulting in a clear demarcation of nuclei, and fiber tracts in subcortical regions. We delineate many sub-nuclei in the dorsal thalamus, epithalamus, and geniculate region (e.g., Fig. 1; AV/AM-anterior ventral and anterior medial, LD-lateral dorsal, MD-mediodorsal, VPI/VPM-ventral posterior inferior/medial, cnMD-centromedian, PL/PM-lateral and medial pulvinar, MGd/v-medial geniculate regions, Hm/Hl-habenular nuclei); subregions of basal ganglia (Fig. 2; cd-caudate, pu-putamen, GP-globus pallidus with microarchitectural features, and laminae), and associated fiber tracts (Fig. 3; al-ansa lenticularis, lf-lenticular fasciculus, and Forel’s H Field) that link basal ganglia with specific sub-nuclei in the thalamus. All qualitative findings observed in MRI were confirmed using matched histological sections with multiple stains. Moreover, the anatomical details revealed using MAP-MRI parameters are invisible in conventional T1-weighted MRI.We also generated a Subcortical Atlas of the Marmoset (SAM) brain from 249 segmented subcortical regions on the MRI sections and registered this atlas to a multi-subject in vivo T1w template6, thereby integrating the segmentation of these subcortical areas into a standard 3D volume (Fig. 4). This new digital atlas provides a practical standard template for neuroanatomical, functional (fMRI), clinical, and connectional imaging studies. Finally, we estimate the atlas-based areal boundaries of subcortical areas by registering the SAM template to multiple in vivo marmoset MRI datasets of different age groups (control/adults) using a novel pipeline developed within AFNI and SUMA. The user scripts for aligning individual subjects to the SAM template are publicly available.
DISCUSSION
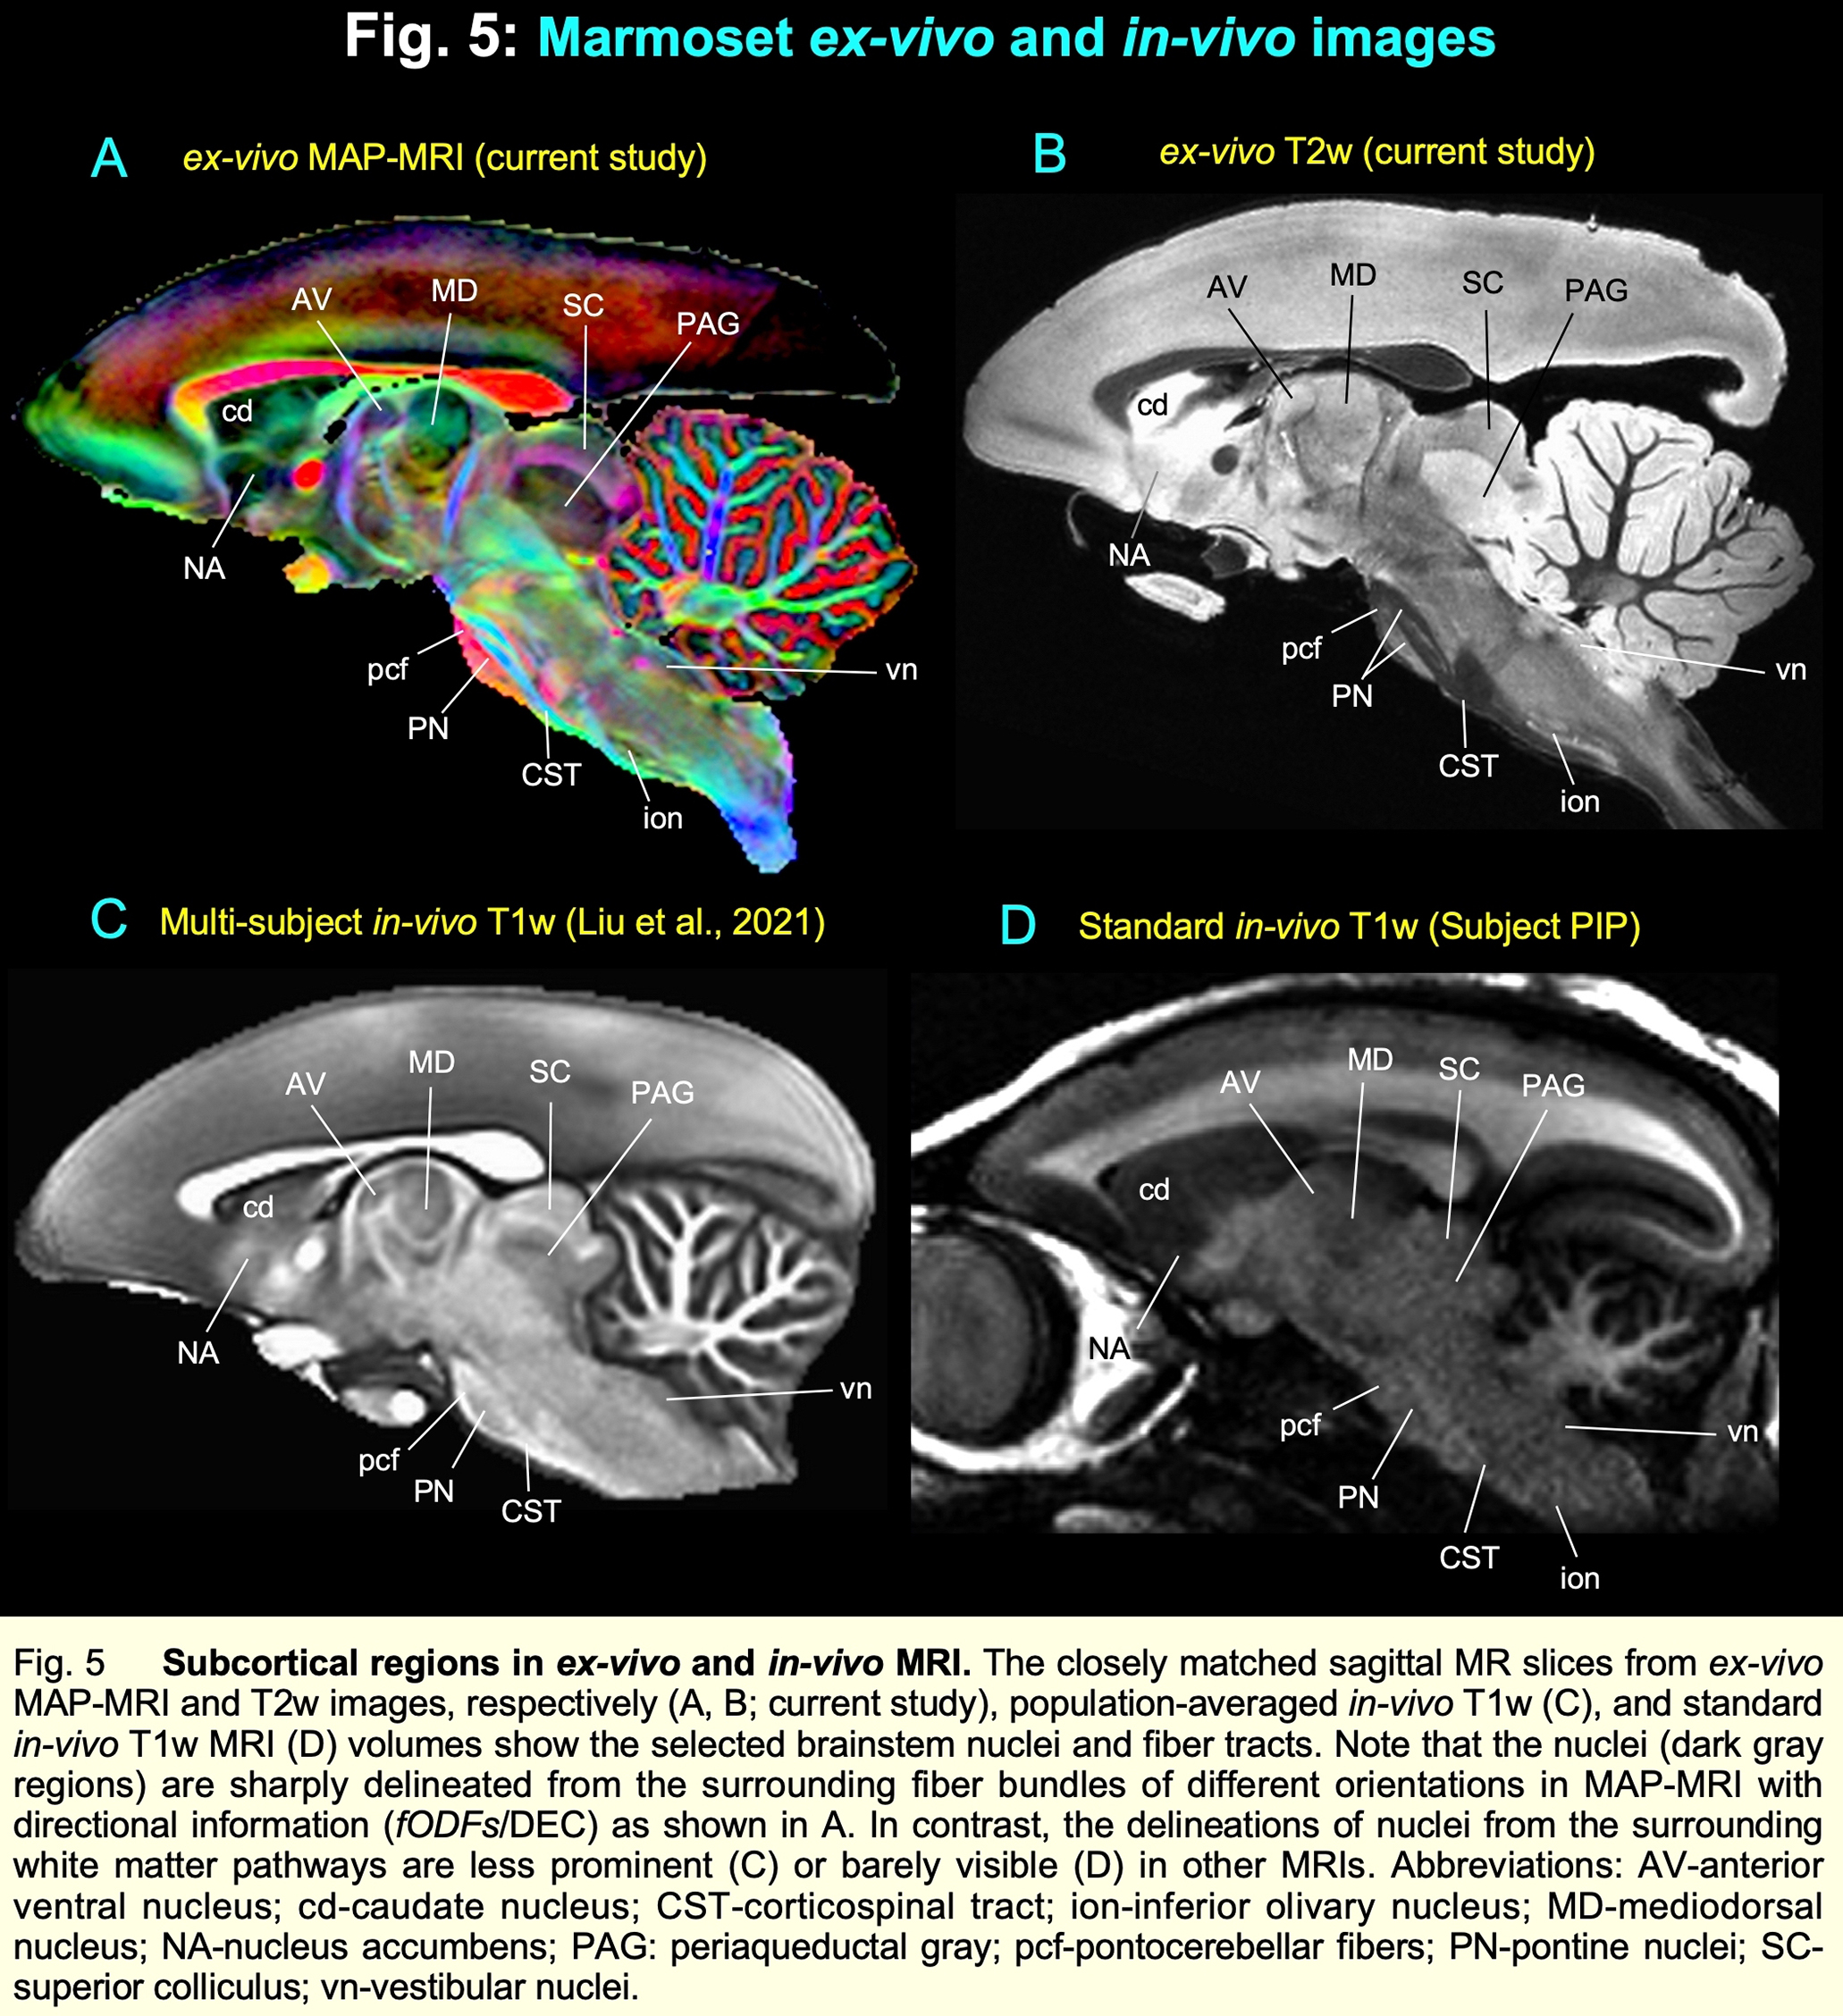
High-resolution MAP-MRI provides microstructural parameters and directional information (fODFs/DEC) that can complement multiple histological stains. These are crucial in delineating nuclei and fiber tracts of different sizes and orientations in the subcortical regions4 (e.g., pontocerebellar fibers, pyramidal tract, and brainstem nuclei; Fig. 5) and cortical laminae7. The location and direction of the fiber tracts and many deep brain nuclei are less prominent or spatially not distinguishable from neighboring structures in a conventional MRI parameter like T1w images (Fig. 5). This study's most important unique feature is the strict adherence to an MRI scan with adjacent and matched histology sections with multiple stains from the same brain. As a result, the alignment accuracy between the areal boundaries and the gross anatomical features is optimized for identifying regions of interest in this brain specimen (e.g., Figs. 1-3). Our high-dimensional DTI/MAP-MRI and MTR images also revealed microarchitectural details in the basal ganglia, thalamus, and other deep brain structures comparable to the neurochemically defined architectonic features identified with the histological stains. The locations of some of the gray and white matter regions in marmoset monkeys are similar to those in macaques and humans4,8,9. Taken together, MAP-MRI enables the construction of high-resolution atlases of deep brain structures that could improve neurosurgical navigation and electrode placement in DBS studies with marmoset models of psychiatric or neurological disorders.CONCLUSION
The high-resolution mapping of subcortical regions using MAP-MRI combined and correlated with histology can elucidate structures that were previously invisible radiologically, providing a readily usable anatomical standard for region definition of subcortical targets in human and non-human primates. This multi-modal mapping offers a roadmap toward identifying salient brain areas in vivo in future neuroradiological studies.Acknowledgements
This work was supported by the Intramural Research Program (IRP) of the Eunice Kennedy Shriver National Institute of Child Health and Human Development, the IRP of the National Institute of Neurological Disorders and Stroke, and Connectome 2.0: Developing the next generation human MRI scanner for bridging studies of the micro-, meso- and macro-connectome (NIH BRAIN Initiative1U01EB026996-01). We thank the Microscope Imaging Core (MIC) at NICHD for help with scanning the high-resolution images of histology sections.References
1. Özarslan E, Koay CG, Shepherd TM, Komlosh ME, İrfanoğlu MO, Pierpaoli C, Basser PJ (2013). Mean apparent propagator (MAP) MRI: a novel diffusion imaging method for mapping tissue microstructure. Neuroimage 78:16-32.
2. Avram A, Sarlls JE, Barnett AS, Özarslan E, Thomas C, Irfanoglu MO, Hutchinson E, Pierpaoli C, Basser PJ (2016). Clinical feasibility of using mean apparent propagator (MAP) MRI to characterize brain tissue microstructure. Neuroimage 127:422-434.
3. Tournier JD, Calamante F, Connelly, A (2012). MRtrix: diffusion tractography in crossing fiber regions. International journal of imaging systems and technology 22:53-66.
4. Saleem KS, Avram AV, Glen D, Yen CC, Ye FQ, Komlosh M, Basser PJ (2021). High resolution mapping and digital atlas of subcortical regions in the macaque monkey based on matched MAP-MRI and histology. Neuroimage 245:118759.
5. Pajevic S, Pierpaoli C (1999). Color schemes to represent the orientation of anisotropic tissues from diffusion tensor data: application to white matter fiber tract mapping in the human brain. Magn Reson Med 42:526-540.
6. Liu, C., Yen, CC, Szczupak, D., Tian, X., Glen, D., Silva, AC (2021). Marmoset Brain Mapping V3: Population multi-modal standard volumetric and surface-based templates. Neuroimage 226, 117620.
7. Avram AV, Saleem KS, Komlosh ME, Yen CC, Ye FQ, Basser PJ (2022). High-resolution cortical MAP-MRI reveals areal borders and laminar substructures observed with histological staining Neuroimage 119653.
8. Straub S, Benjamin R, Knowles BR, Flassbeck S, Steiger R, Ladd ME, Gizewski ER (2019). Mapping the human brainstem: Brain nuclei and fiber tracts at 3 T and 7 T. NMR in Biomedicine 32:e4118.
9. Tang Y, Sun W, Toga AW, Ringman JM, Shi Y (2018). A probabilistic atlas of human brainstem pathways based on connectome imaging data. Neuroimage 169:227-239.
Figures