0078
Optimized 7 T Cortical Magnetization Transfer Saturation Imaging: Application to Cortical Myelin Imaging in Multiple Sclerosis1Department of Biological and Biomedical Engineering, McGill University, Montreal, QC, Canada, 2McConnell Brain Imaging Centre, Montreal Neurological Institute and Hospital, Montreal, QC, Canada, 3Department of Neurology and Neurosurgery, McGill University, Montreal, QC, Canada, 4Siemens Healthcare Limited, Montreal, QC, Canada
Synopsis
Keywords: Data Processing, High-Field MRI, Quantitative MRI
We designed an MRI protocol for rapid, high-resolution human cortical MTsat (csMTsat) imaging at 7 T. Our approach leveraged the PTx capability of the 7 T Siemens Terra MRI system. Further, we developed a post-processing scheme that reduces residual B1+ field bias and noise in csMTsat maps for imaging cortical myelin in the human cortex at high-resolution, which can be applied to study cortical demyelination in Multiple Sclerosis.Introduction and Motivation
Magnetization Transfer Saturation (MTsat) is a quantitative MRI metric that is sensitive to myelin in the human brain and includes inherent correction for MRI radiofrequency (RF) transmit field (B1+) inhomogeneity, as well as T1 relaxation1. However, at 7 T, the inherent compensation for B1+ inhomogeneity in the MTsat formalism is insufficient2. Parallel RF transmission (PTx) and post-processing approaches for B1+ field modeling are necessary to reduce signal intensity bias in 7T MTsat images.The present work demonstrates two novel contributions. First, we designed an MRI protocol for rapid, high-resolution human cortical MTsat (csMTsat) imaging at 7 T. Our approach leveraged the PTx capability of the 7 T Siemens Terra MRI system. Second, we applied a post-processing scheme that reduces residual B1+ field bias and noise in csMTsat maps. Our improved 7 T MTsat method was applied for csMTsat imaging of the neocortical layers in relapsing and progressive multiple sclerosis patients, as well as matched controls
Methods
Ten MS subjects (EDSS score range: 2-6) and seven age-matched healthy volunteers underwent imaging using a Siemens MAGNETOM 7 T Terra MRI System. The MTsat acquisition employed 0.7 mm3 spatial resolution. The coil used for the acquisition was an 8-channel Tx, 32 Rx Nova head coil. For RF shimming using the PTx capabilities of the Terra, a spoiled gradient echo (SPGE)-based MT sequence was developed in-house. The SPGE-based MT sequence used 3D segmented imaging in the Phase-Encoding 1 direction to accelerate k-space acquisition. A linear k-space reordering was applied prior to reconstruction. Three specific high resolution images of the cortex were acquired to reconstruct cortical MTsat: (i) a proton density-weighted (PDw) image (TR = 95ms, FA = 5o), (ii) a T1-weighted (T1w) image (TR = 40ms, FA = 25o) and (iii) a MT-weighted (MTw) image (MT pulse width = 50ms, offset frequency = -2.0kHz, MT pulse FA = 900o, MT pulse waveform = Hanning, TR = 95ms, FA = 5o,). The MT pulse parameters were chosen to augment specificity of the imaging signal to myelin phospholipid signals in the cortex1, while keeping the acquisition under 9 minutes. Shared imaging parameters were TE/Tes = 3.80/8.2ms, IPAT = 3 for GRAPPA, pPF = sPF= 6/8, and 3 segments (PE1 k-space lines) acquired per cycle. A 0.7 mm3 resolution, 3D sagittal MP2RAGE volume was also acquired to perform image registration and cortical surface reconstruction.To minimize B1+ inhomogeneity, the RF transmit shimming capability of the MAGNETOM Terra system was leveraged. The “patient-specific” B1+shimming mode was chosen to consider the entire FOV (patient head) while optimizing the RF shim weights and phases. This setting offered consistency when imaging participants with varying head shapes and sizes, while also improving the homogeneity of the RF transmit field profile.
Post-processing of the MTsat images was carried out in three main steps. First, the PDw, T1w and MTw images were separately corrected for B1+ bias using UNICORT3 (SPM12, UCL). Given that UNICORT models the bias field by the exponential of a linear combination of cosines, the kernel size used for bias field estimation was specified to be 20mm FWHM. The regularization parameter for model fitting was set to ‘extremely light’ (10-6). The bias-corrected images were subsequently denoised using an Adaptive Optimized Non-Local Means (AONLM) filter4 (MRI denoising package, P. Coupé and J.V. Manjon), with following settings for patch-based denoising: Patch size = 3x3x3 voxels, Search size = 7x7x7 voxels, and Beta = 1.0 (Assuming Gaussian noise model for removing GRAPPA-affiliated noise). Finally, the images were non-linearly registered to the 3D MP2RAGE using NiftyReg5 (CMIC, UCL). Following this, the PDw, T1w and MTw images were used to compute cortical MTsat in MATLAB (R2020b, Mathworks)1. The entire post-processing scheme is depicted in Figure 1 and takes around 40-60 minutes.
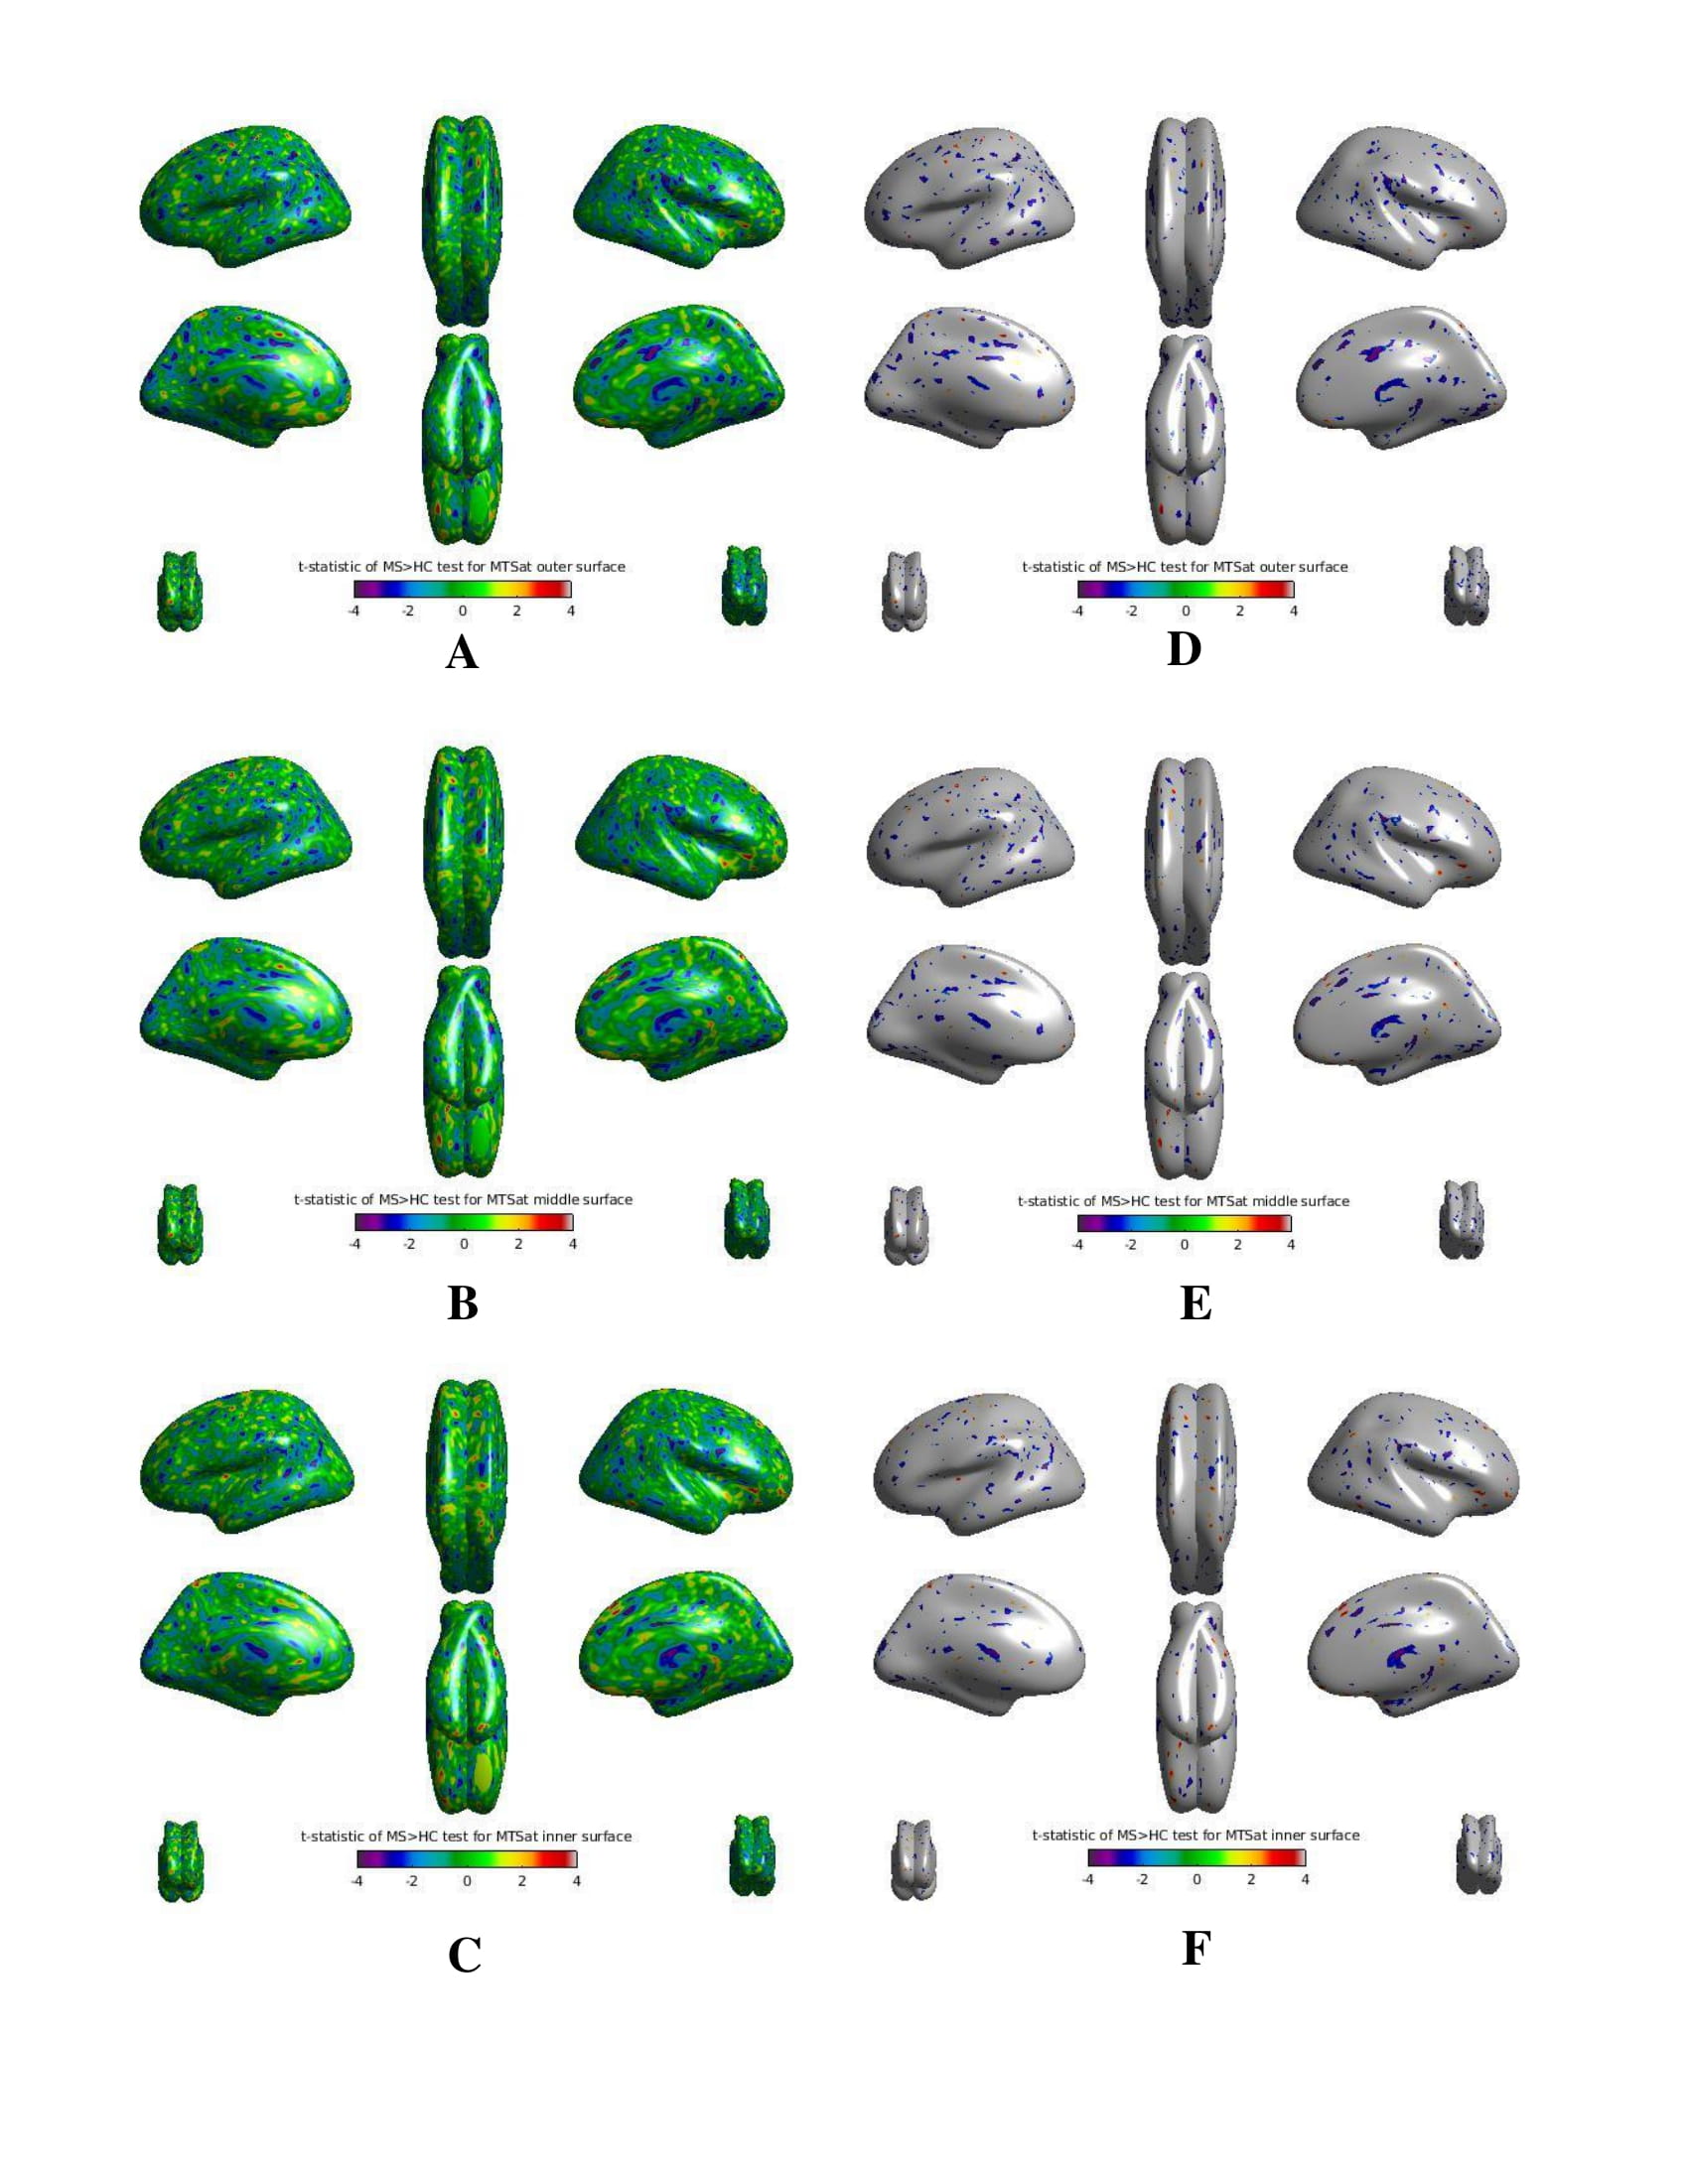
Using CAT12 (SPM12, UCL), pial and white cortical surfaces were reconstructed from the 3D MP2RAGE UNIDEN volume. Surface-based MTsat data was extracted at cortical depths of 25%, 50% and 75% from the pial surface. The MTsat surfaces were non-linearly resampled to the Freesurfer average template for group analysis. Both processing steps were conducted using CAT12 tools. Differences in csMTsat between MS patients and healthy controls on the cortical surfaces were examined at vertex level using a generalized linear mixed effects model with SurfStat6. Age, sex, and group (MS or controls) were included as fixed effects terms. The comparison t-statistic surface-based maps are provided in Figure 3.
Results and Discussion
As demonstrated in Figure 2, our post-processing scheme recovers signal from the cerebellum and temporal lobes that is typically lost due to residual B1+ field inhomogeneity and noise bias. Figure 3 reveals csMTsat reductions in MS patients, relative to healthy controls, were most evident along the outermost cortical layer (25% cortical depth from pia). This reflects a gradient of cortical demyelination with myelin loss being more pronounced in vicinity of the meninges. Such an observation is consistent with MS cortical tissue studies that suggest meningeal inflammatory infiltrates diffuse into the cortex and contribute to activation of microglia implicated in cortical lesion formation7, 8.Future work will involve building on the csMTsat imaging sequence to perform cortical inhomogeneous magnetization transfer (IhMT) imaging for increased specificity to MS-associated cortical demyelination.
Acknowledgements
Funding for this project was provided by the United States Department of Defense MSRP Grant and the National Sciences and Engineering Research Council of Canada (NSERC) Discovery Grant (RGPIN-2018-05047) of Dr. David Rudko, and a Doctoral Research Award (CGS-D) provided by the Canadian Institutes of Health Research (CIHR) to Risavarshni Thevakumaran.
References
1. Helms G, Dathe H, Kallenberg K, et al. High-resolution maps of magnetization transfer with inherent correction for RF inhomogeneity and T1 relaxation obtained from 3D FLASH MRI. Magn Reson Med. 2008;60(6):1396-1407.
2. Olsson H, Andersen M, Wirestam R, et al. Mapping magnetization transfer saturation (MTsat) in human brain at 7T: Protocol optimization under specific absorption rate constraints. Magnetic Resonance in Medicine. 2021;n/a(n/a).
3. Weiskopf N, Lutti A, Helms G, et al. Unified segmentation based correction of R1 brain maps for RF transmit field inhomogeneities (UNICORT). NeuroImage. 2011;54(3):2116-2124.
4. Manjón J, V., Coupé P, Martí-Bonmatí L, et al. Adaptive non-local means denoising of MR images with spatially varying noise levels: Spatially Adaptive Non-Local Denoising. Journal of Magnetic Resonance Imaging. 2010;31(1):192-203.
5. Modat M, Ridgway GR, Taylor ZA, et al. Fast free-form deformation using graphics processing units. Computer Methods and Programs in Biomedicine. 2010;98(3):278-284.
6. Worsley K, Taylor J, Carbonell F. SurfStat: a Matlab toolbox for the statistical analysis of univariate and multivariate surface and volumetric data using linear mixed effects models and random field theory. NeuroImage Organization for Human Brain Mapping 2009 Annual Meeting. 2009:47-S102.
7. Magliozzi R, Howell O, Vora A, et al. Meningeal B-cell follicles in secondary progressive multiple sclerosis associate with early onset of disease and severe cortical pathology. Brain. 2007;130(4):1089-1104.
8. Pardini M, Brown JWL, Magliozzi R, et al. Surface-in pathology in multiple sclerosis: a new view on pathogenesis? Brain. 2021;144(6):1646-1654.
Figures
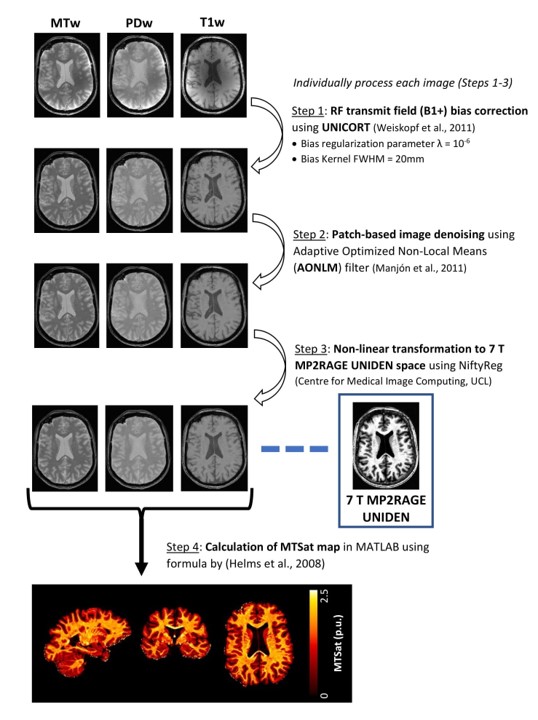
Figure 1: Post-processing of 7 T high-resolution proton density-weighted, T1-weighted and MT-weighted images used for cortical MTsat computation in MATLAB. This scheme consists of correction of residual B1+ bias, followed by patch-based denoising for removal of GRAPPA-affiliated noise and non-linear registration to the 7T MP2RAGE UNIDEN image volume. The processed images are finally used to compute 7 T csMTsat minimized of RF transmit and noise bias.
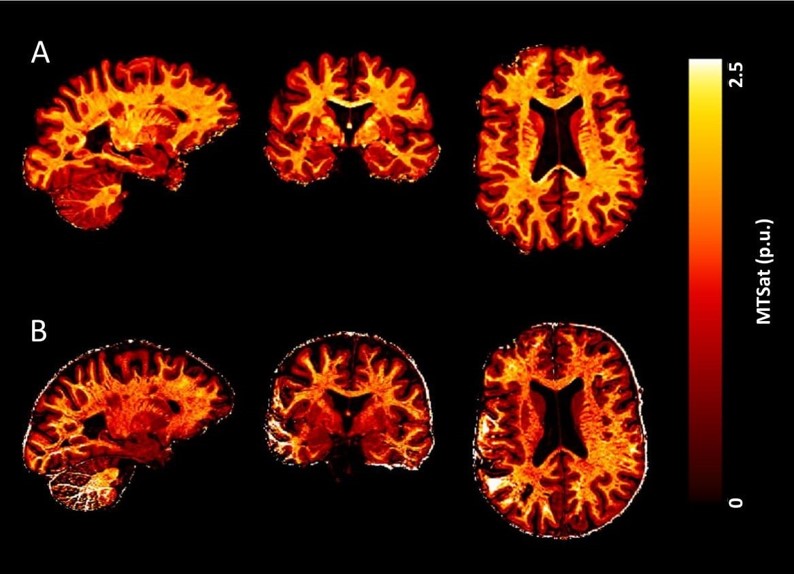
Figure 2: 7 T cortical MTsat maps computed for an example healthy control (A) with the post-processing scheme applied and (B) without no post-processing, following high-resolution image acquisition using the PTx capabilities of the Siemens Terra system. The csMTsat map in (B) shows (i) substantial intensity bias, arising from insufficient B1+ bias correction in the MTsat formalism, and (ii) signal loss in the temporal lobes and cerebellum, caused by spatially-varying noise arising from GRAPPA acceleration.