0076
Confidence Maps for Reliable Proton Density Fat-Fraction and R2* Estimation1Radiology, University of Wisconsin-Madison, Madison, WI, United States, 2Medical Physics, University of Wisconsin-Madison, Madison, WI, United States, 3Electrical and Computer Engineering, University of Wisconsin-Madison, Madison, WI, United States, 4Biomedical Engineering, University of Wisconsin-Madison, Madison, WI, United States, 5Medicine, University of Wisconsin-Madison, Madison, WI, United States, 6Emergency, University of Wisconsin-Madison, Madison, WI, United States
Synopsis
Keywords: Data Processing, Artifacts, CSE-MRI
In this work we develop a confidence map algorithm to identify reliable estimates of PDFF and R2* for CSE-MRI in the liver. Reliability of estimates is evaluated based on a normalized root-mean-square-error (NRMSE) between measured and model signals. Threshold values of the NRMSE are determined by using the Cramér–Rao Lower Bound. Monte-Carlo simulations and clinical CSE-MRI successfully validate the proposed method.Introduction
Proton density fat-fraction(PDFF) and transverse relaxivity rate(R2*) acquired using quantitative chemical shift-encoded MRI(CSE-MRI)1,2 are well-established biomarkers of diffuse liver disease. Unbiased estimation of PDFF and R2* is essential for accurate diagnosis, staging and treatment monitoring.However, reliable PDFF and R2* estimation remains challenging due to confounding factors such as low SNR3,4, high iron(high R2*)5, inhomogeneous magnetic field(B0) and phase errors6-8. In addition, water-fat swaps9 commonly occur in water- or fat-dominant pixels. Further, severe magnetic field inhomogeneities can lead to focally elevated and unreliable R2* estimates.
A reconstructed quantitative PDFF/R2* map may not clearly show the regions with inadequate or corrupted measurements, and there is a lack of guidance in current CSE-MRI methods, for objective identification of invalid regions of the maps.
In this study, we aim to develop an automated algorithm to generate confidence maps that automatically identify regions on PDFF/R2* maps that are valid for analysis.
Theory
CSE-MRIMulti-echo spoiled gradient echo imaging with signal modeling provides simultaneous estimation of PDFF and R2*. In this study, we adopt the multi-peak model by Yu that includes multiple fat peaks as well as R2* decay2,10.
Confidence Map
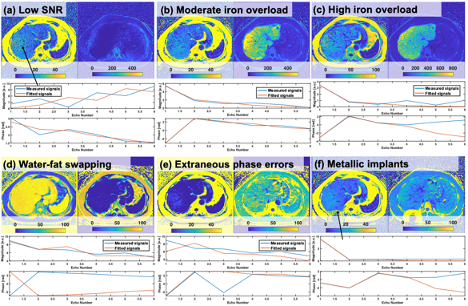
We consider 6 possible scenarios that can lead to inaccurate estimation of PDFF/R2* as summarized in Figure 1(a-f). To address and exclude these scenarios, we introduce a confidence map approach.
The reliability of PDFF/R2* can be evaluated based on the normalized root-mean-square-error(NRMSE) between measured and fitting signals of CSE-MRI. The calculated NRMSE provide a confidence threshold which is determined using a Cramér–Rao Lower Bound(CRLB)11. A measurement lower than the threshold is regarded as reliable.
The estimation of PDFF/R2* may be biased due to incorrect estimation of the field map, leading to water-fat swapping. To identify the swapping, a set of calculations of water-fat separation with fixed off-resonance shifts of +3.3/-3.3ppm relative to the estimated frequency is performed. Areas with the swapping have larger NRMSE compared to that with fixed off-resonance shifts9.
Strong off-resonance effects often result from susceptibility effects, resulting in additional R2* signal decay. To detect R2* decay, a point spread function approach12 can be used. Areas with a high B0 gradient can then be excluded.
Cramér–Rao Lower Bound (CRLB)
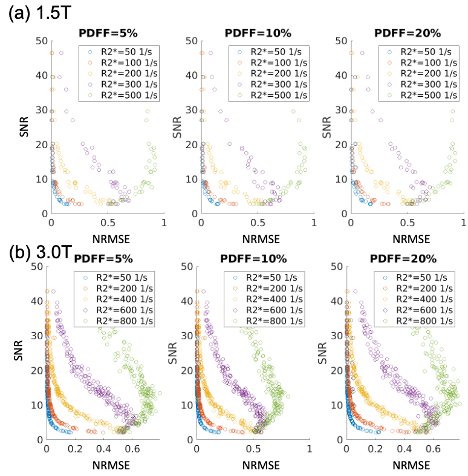
The CRLB5,11, derived from the equation for CSE-MRI2, is used to determine lower theoretical bounds on PDFF/R2* variance. For PDFF/R2* measurements, the minimum SNR to achieve certain standard errors (SE) (1% of PDFF, and either 3% of R2* or 5 1/s whichever is larger, determined based on known variable coefficients13,14) is calculated. Maximum NRMSE can be estimated from SNR by using a relationship between them derived from Monte-Carlo simulations as shown in Figure 2.
Methods
NRMSE thresholds for PDFF/R2* measurements with variable first TE(TE0), echo spacing(ΔTE), PDFF, and R2* were calculated for 1.5 and 3.0T using the CRLB. The following experiments were conducted.Monte-Carlo
SimulationsMonte-Carlo simulations using the signal model were performed to validate thresholds calculated using CRLB. Physiologically reasonable ranges of R2*(50-1500 1/s), PDFF(0-50%), TE0(0.9-1.7 ms), ΔTE(0.59-2.1 ms), and SNR(2-50) were used.
In-vivo Experiments
An IRB-approved prospective study included 59 consecutive patients who underwent PDFF/R2* mapping in the liver on 1.5/3.0T MR systems(GE Healthcare, Waukesha, WI) between May-September 2022. A nonlinear optimization15 was used for reconstruction.
A board-certified radiologist delineated ROIs for each 9 liver segments, blinded to the confidence maps. We calculated the percent area of the ROIs in inappropriate areas that were identified by the confidence map. In this way, we aimed to determine the impact of confidence maps on clinical analysis.
Results
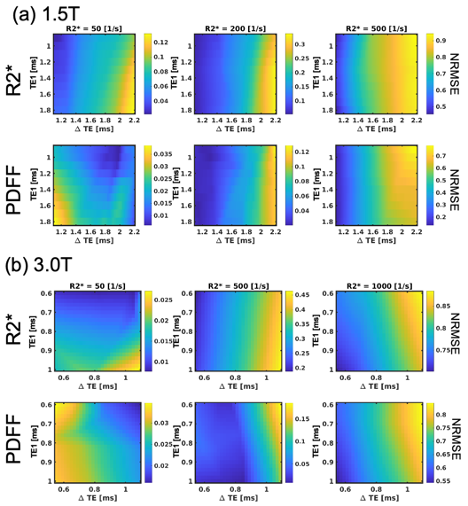
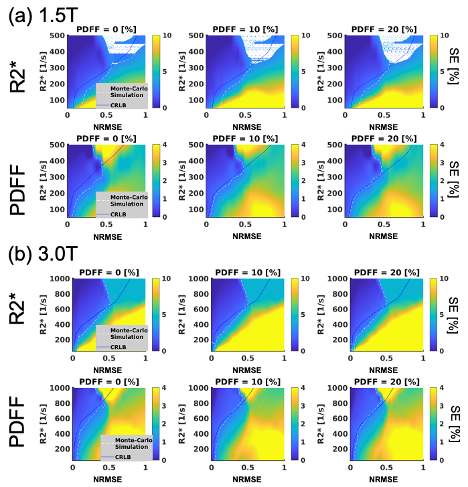
Plots of maximum NRMSE with PDFF of 0% as a function of TE1and ΔTE are shown in Figure 3. The results indicated that required NRMSE values vary depending on PDFF, R2*, TE1and ΔTE.Figure 4 shows plots of SEs as a function of NRMSE and R2* for PDFF of 0, 10, and 20% calculated using Monte-Carlo simulations for typical TE1and ΔTE at 1.5 and 3.0T. The estimated NRMSE thresholds roughly agreed with those suggested by the confidence maps.
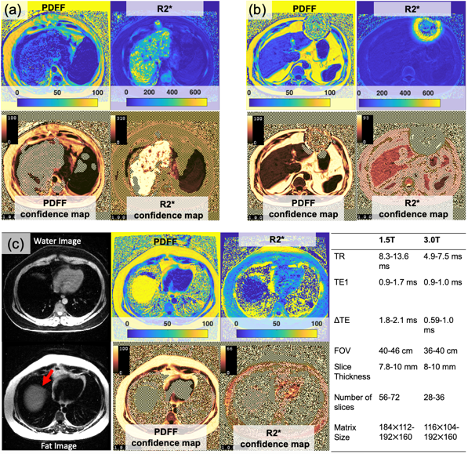
Figure 5 shows examples of PDFF/R2* and corresponding confidence maps. Failure of PDFF measurement due to high R2* can be successfully detected as shown in Figure 5(a). Regions containing metal artifact(Figure 5(b)) and fat-water swapping(Figure 5(c)) were also removed. ROI analysis revealed that 4% and 21% of the ROIs in PDFF and R2* maps were placed inside unreliable areas identified by confidence maps.
Discussion
We have successfully developed an algorithm for generating confidence maps for PDFF and R2* estimation based on NRMSE. Thresholds for NRMSE were determined using CRLB. Monte-Carlo simulations and in vivo experiments demonstrated the validity of the proposed algorithm.Automation of quantitative map analysis has become increasingly important in recent years. For MR elastography in the liver region, several automated algorithms16-19 have been proposed. Automated analysis can avoid costly “call-backs” by ensuring quality measurements while the patient is still present20. While this work doesn't provide automated segmentation, confidence maps will be essential for automated segmentation algorithms to exclude invalid pixels.
There are limitations to this study. Reconstruction algorithms and acquisition parameters may impact the threshold values, and the proposed method is currently computationally expensive.
In conclusion, a confidence map algorithm, which provides reliable areas of PDFF/R2* measurement, was successfully developed.
Acknowledgements
We appreciate the helpful suggestions and source code for confidence map graphics provided by Dr. Roger C. Grimm from the Mayo Clinic, Rochester, MN. We acknowledge support from the NIH (R01EB031886). We wish to acknowledge support from Bracco Diagnostics who provide research support to the University of Wisconsin.References
1. Reeder SB, Wen Z, Yu H, Pineda AR, Gold GE, Markl M, Pelc NJJMRiMAOJotISfMRiM. Multicoil Dixon chemical species separation with an iterative least‐squares estimation method. 2004;51(1):35-45.
2. Yu H, Shimakawa A, McKenzie CA, Brodsky E, Brittain JH, Reeder SB. Multiecho water‐fat separation and simultaneous R estimation with multifrequency fat spectrum modeling. Magnetic Resonance in Medicine: An Official Journal of the International Society for Magnetic Resonance in Medicine 2008;60(5):1122-1134.
3. Lawrence EM, Roberts NT, Hernando D, Mao L, Reeder SB. Effect of noise and estimator type on bias for analysis of liver proton density fat fraction. Magnetic resonance imaging 2020;74:244-249.
4. Roberts NT, Hernando D, Holmes JH, Wiens CN, Reeder SB. Noise properties of proton density fat fraction estimated using chemical shift–encoded MRI. Magnetic resonance in medicine 2018;80(2):685-695.
5. Colgan TJ, Zhao R, Roberts NT, Hernando D, Reeder SB. Limits of Fat Quantification in the Presence of Iron Overload. J Magn Reson Imaging 2021;54(4):1166-1174.
6. Colgan TJ, Hernando D, Sharma SD, Reeder SB. The effects of concomitant gradients on chemical shift encoded MRI. Magnetic resonance in medicine 2017;78(2):730-738.
7. Yu H, Shimakawa A, Hines CDG, McKenzie CA, Hamilton G, Sirlin CB, Brittain JH, Reeder SB. Combination of complex-based and magnitude-based multiecho water-fat separation for accurate quantification of fat-fraction. Magnetic Resonance in Medicine 2011;66(1):199-206.
8. Hernando D, Hines CDG, Yu H, Reeder SB. Addressing phase errors in fat-water imaging using a mixed magnitude/complex fitting method. Magnetic Resonance in Medicine 2012;67(3):638-644.
9. Yu H, Reeder SB, Shimakawa A, McKenzie CA, Brittain JH. Robust multipoint water‐fat separation using fat likelihood analysis. Magnetic resonance in medicine 2012;67(4):1065-1076.
10. Yu H, McKenzie CA, Shimakawa A, Vu AT, Brau ACS, Beatty PJ, Pineda AR, Brittain JH, Reeder SB. Multiecho reconstruction for simultaneous water-fat decomposition and T2* estimation. Journal of Magnetic Resonance Imaging 2007;26(4):1153-1161.
11. Pineda AR, Reeder SB, Wen Z, Pelc NJ. Cramer-Rao bounds for three-point decomposition of water and fat. Magn Reson Med 2005;54(3):625-635.
12. Hernando D, Vigen KK, Shimakawa A, Reeder SB. R mapping in the presence of macroscopic B0 field variations. Magnetic Resonance in Medicine 2012;68(3):830-840.
13. Yokoo T, Serai SD, Pirasteh A, Bashir MR, Hamilton G, Hernando D, Hu HH, Hetterich H, Kühn J-P, Kukuk GM. Linearity, bias, and precision of hepatic proton density fat fraction measurements by using MR imaging: a meta-analysis. Radiology 2018;286(2):486-498.
14. Hernando D, Zhao R, Taviani V, Ghasabeh A, Pan L, Yuan Q, Ruschke S, Karampinos DC, Zhong X, Mattison R, Kamel I, Pedrosa I, Vasanawala SS, Yokoo T, Reeder SB. Repeatability and reproducibility of confounder-corrected R2* as a biomarker of liver iron concentration: interim results from a multi-center, multivendor study at 1.5T and 3T. 2019; Montreal, Canada. p 1020.
15. Hernando D. ISMRM Fat-Water Toolbox. 2012.
16. Dzyubak B, Glaser K, Yin M, Talwalkar J, Chen J, Manduca A, Ehman RL. Automated liver stiffness measurements with magnetic resonance elastography. Journal of Magnetic Resonance Imaging 2013;38(2):371-379.
17. Dzyubak B, Venkatesh SK, Manduca A, Glaser KJ, Ehman RL. Automated liver elasticity calculation for MR elastography. Journal of Magnetic Resonance Imaging 2016;43(5):1055-1063.
18. Cunha GM, Delgado T, Middleton MS, Liew S, Henderson WC, Batakis D, Wang K, Loomba R, Huss RS, Myers RP. Automated CNN-Based Analysis Versus Manual Analysis for MR Elastography in Nonalcoholic Fatty Liver Disease: Inter-method Agreement and Fibrosis Stage Discriminative Performance. American Journal of Roentgenology 2022.
19. Aldoj N, Biavati F, Dewey M, Hennemuth A, Asbach P, Sack I. Fully automated quantification of in vivo viscoelasticity of prostate zones using magnetic resonance elastography with Dense U-net segmentation. Scientific reports 2022;12(1):1-13.
20. Tang A, Dzyubak B, Yin M, Schlein A, Henderson WC, Hooker JC, Delgado TI, Middleton MS, Zheng L, Wolfson T. MR elastography in nonalcoholic fatty liver disease: inter-center and inter-analysis-method measurement reproducibility and accuracy at 3T. European radiology 2021:1-12.
Figures