0073
Measurement of tumor heterogeneity with habitats in breast cancer and its application in molecular subtype discrimination1Department of Radiology, Yueyang Hospital of Integrated Traditional Chinese and Western Medicine, Shanghai University of Traditional Chinese Medicine, Shanghai, China, 2Central Research Institute, United Imaging Healthcare, Shanghai, China
Synopsis
Keywords: Data Analysis, Cancer
In this work, multiparametric MRI was applied to reconstruct spatial habitats and validate the association with the molecular subtypes of breast cancer. By combining perfusion and diffusion characteristics, three habitats were constructed and assigned: hypervascular habitat, hypovascular cellular habitat, and nonviable habitat. In triple-negative breast cancer (TNBC), the volume fraction is lower for hypervascular habitat and higher for nonviable habitat, with respect to non-TNBC.
Introduction
Breast cancer is the most common cancer and the leading cause of cancer death in women[1]. The stratification according to the genetic expression of receptors has classified breast cancer into five molecular subtypes, which present different treatment responses and prognoses[2]. The relationship between breast cancer subtypes and quantitative MRI findings has been studied, showing the potential of MRI findings in the non-invasive prediction of breast cancer subtypes[3-5]. On the other hand, the intra-tumor heterogeneity of breast cancer might lead to ineffective therapy due to the non-uniform treatment response and resistance[6, 7]. For this purpose, several methods have been developed to assess the intra-tumor heterogeneity, including histogram and texture analysis[8, 9]. This study aimed to develop multiparametric physiologic MRI-based spatial habitat analysis and validate the association between the habitats and the molecular subtypes.Methods
In this IRB-approved study, 142 patients were imaged with biopsy- and surgery-proven BC(median age, 56 years; range, 25–83 years) with a total of 148 breast lesions (size range: 10mm – 97mm; median: 29mm). The breast MRI was acquired on a 3T MRI system (uMR 780, United Imaging Healthcare, Shanghai, China). The sequences included: a) pre-contrast and b) contrast-enhanced 3D T1 weighted imaging (TR/TE, 4.8/1.99 ms; slice thickness, 0.66mm; FA, 10°; matrix size, 504×504; FOV, 340×340mm), c) diffusion weighted imaging (DWI) acquired with single shot echo planar imaging (TR/TE, 3702/67 ms; slice thickness, 5mm; FA, 90°; matrix size, 96×192; FOV, 190×380mm; b values, 50, 600,1000 s/mm2).The ADC map, wash-in map, and wash-out map were reconstructed for clustering with K-means[10], an iterative unsupervised machine learning algorithm by minimizing the Euclidean distance of each data point and the nearest centroid.
Results
The distribution of three clustering parameters of each habitat is shown in Figure 1, where the indexes 1, 2, and 3 represent hypervascular habitat (high wash-in and high wash-out), hypovascular cellular habitat (low ADC and low wash-in/wash-out), and nonviable habitat(high ADC and wash-in/wash-out). Habitats’ volume fractions for TNBC and non-TNBC are shown in Figure 2. The TNBC was comprised of a lower voxel fraction of Habitat 1 (p<0.002) and a higher voxel fraction of Habitat 3 (p<0.001). The volume fraction of Habitat 1 showed good predictive performance of TNBC (AUC 0.853; 95% CI, 0.786–0.906) at an optimized threshold lower than 20.4% with 84.6% sensitivity and 91.0% specificity. Similarly, the volume fraction of Habitat 3 showed a prediction performance (AUC 0.752; 95% CI, 0.674–0.891) at an optimized threshold greater than 32.9%, with 73.1% sensitivity and 76.2% specificity, as shown in Figure 3.Discussion
This study investigates the spatial substructure of breast tumors and its application in TNBC prediction. It was a cohort study providing more universality than some other studies where the clustering was on a single ROI with a priori knowledge of the complexity.Previous studies have shown that the quantitative DCE features through pharmacokinetic modeling techniques, for instance, kep and ktrans provided discrimination of molecular subtypes[11, 12]. However, these are not universally used in the clinical examination due to acquisition time. Herein the perfusion features are semi-quantitative wash-in and wash-out extracted using the conventional abbreviated DCE-MRI within 9 min. Habitat 1 with higher wash-in and wash-out was defined as hypervascular habitat, while Habitat 2 and 3 with poor perfusion were related to hypoxia and ischemia [13, 14]. The result showed stronger angiogenesis of non-TNBC since all the lesions included in this study were malignant. The necrosis and treatment-related changes were reported with higher ADC[13, 15, 16]. In this work, Habitat 3 with higher ADC was defined as nonviable tissue. Its fraction was significantly greater in TNBC than in non-TNBC, which might be explained by the high rate of necrosis in TNBC.
Conclusion
By applying the habitat approach, this study demonstrated that the volume fractions of hypervascular and non-viable habitats were significant predictors of TNBC.Acknowledgements
No acknowledgement found.References
1. Sung, H., et al., Global Cancer Statistics 2020: GLOBOCAN Estimates of Incidence and Mortality Worldwide for 36 Cancers in 185 Countries. CA Cancer J Clin, 2021. 71(3): p. 209-249.
2. Curigliano, G., et al., De-escalating and escalating treatments for early-stage breast cancer: the St. Gallen International Expert Consensus Conference on the Primary Therapy of Early Breast Cancer 2017. Annals of Oncology, 2017. 28(8): p. 1700-1712.
3. Kim, E.J., et al., Histogram analysis of apparent diffusion coefficient at 3.0t: Correlation with prognostic factors and subtypes of invasive ductal carcinoma. J Magn Reson Imaging, 2015. 42(6): p. 1666-78.
4. Lee, S.H., et al., Correlation between high resolution dynamic MR features and prognostic factors in breast cancer. Korean J Radiol, 2008.9(1): p. 10-8.
5. Chen, J.H., et al., Estrogen receptor and breast MR imaging features: a correlation study. J Magn Reson Imaging, 2008. 27(4): p. 825-33.
6. Reuben, A., et al., Genomic and immune heterogeneity are associated with differential responses to therapy in melanoma. NPJ Genom Med, 2017. 2.
7. Swanton, C., Intratumor heterogeneity: evolution through space and time. Cancer Res, 2012. 72(19): p. 4875-82.
8. Kim, J.H., et al., Breast Cancer Heterogeneity: MR Imaging Texture Analysis and Survival Outcomes. Radiology, 2017. 282(3): p. 665-675.
9. Chitalia, R.D. and D. Kontos, Role of texture analysis in breast MRI as a cancer biomarker: A review. J Magn Reson Imaging, 2019. 49(4): p. 927-938.
10. Kanungo, T., et al., An efficient k-means clustering algorithm: analysis and implementation. IEEE Transactions on Pattern Analysis and Machine Intelligence, 2002. 24(7): p. 881-892.
11. Wu, J., et al., Intratumoral Spatial Heterogeneity at Perfusion MR Imaging Predicts Recurrence-free Survival in Locally Advanced Breast Cancer Treated with Neoadjuvant Chemotherapy. Radiology, 2018. 288(1): p. 26-35.
12. Du, S., et al., Improved discrimination of molecular subtypes in invasive breast cancer: Comparison of multiple quantitative parameters from breast MRI. Magn Reson Imaging, 2021. 77: p. 148-158.
13. Kazerouni, A.S., et al., Quantifying Tumor Heterogeneity via MRI Habitats to Characterize Microenvironmental Alterations in HER2+ Breast Cancer. Cancers (Basel), 2022. 14(7).
14. Lee, D.H., et al., Tumor habitat analysis by magnetic resonance imaging distinguishes tumor progression from radiation necrosis in brain metastases after stereotactic radiosurgery. Eur Radiol, 2022. 32(1): p. 497-507.
15. Park, J.E., et al., Spatiotemporal Heterogeneity in Multiparametric Physiologic MRI Is Associated with Patient Outcomes in IDH-Wildtype Glioblastoma. Clin Cancer Res, 2021. 27(1): p. 237-245.
16. Jardim-Perassi, B.V., et al., Multiparametric MRI and Coregistered Histology Identify Tumor Habitats in Breast Cancer Mouse Models.Cancer Res, 2019. 79(15): p. 3952-3964.
Figures
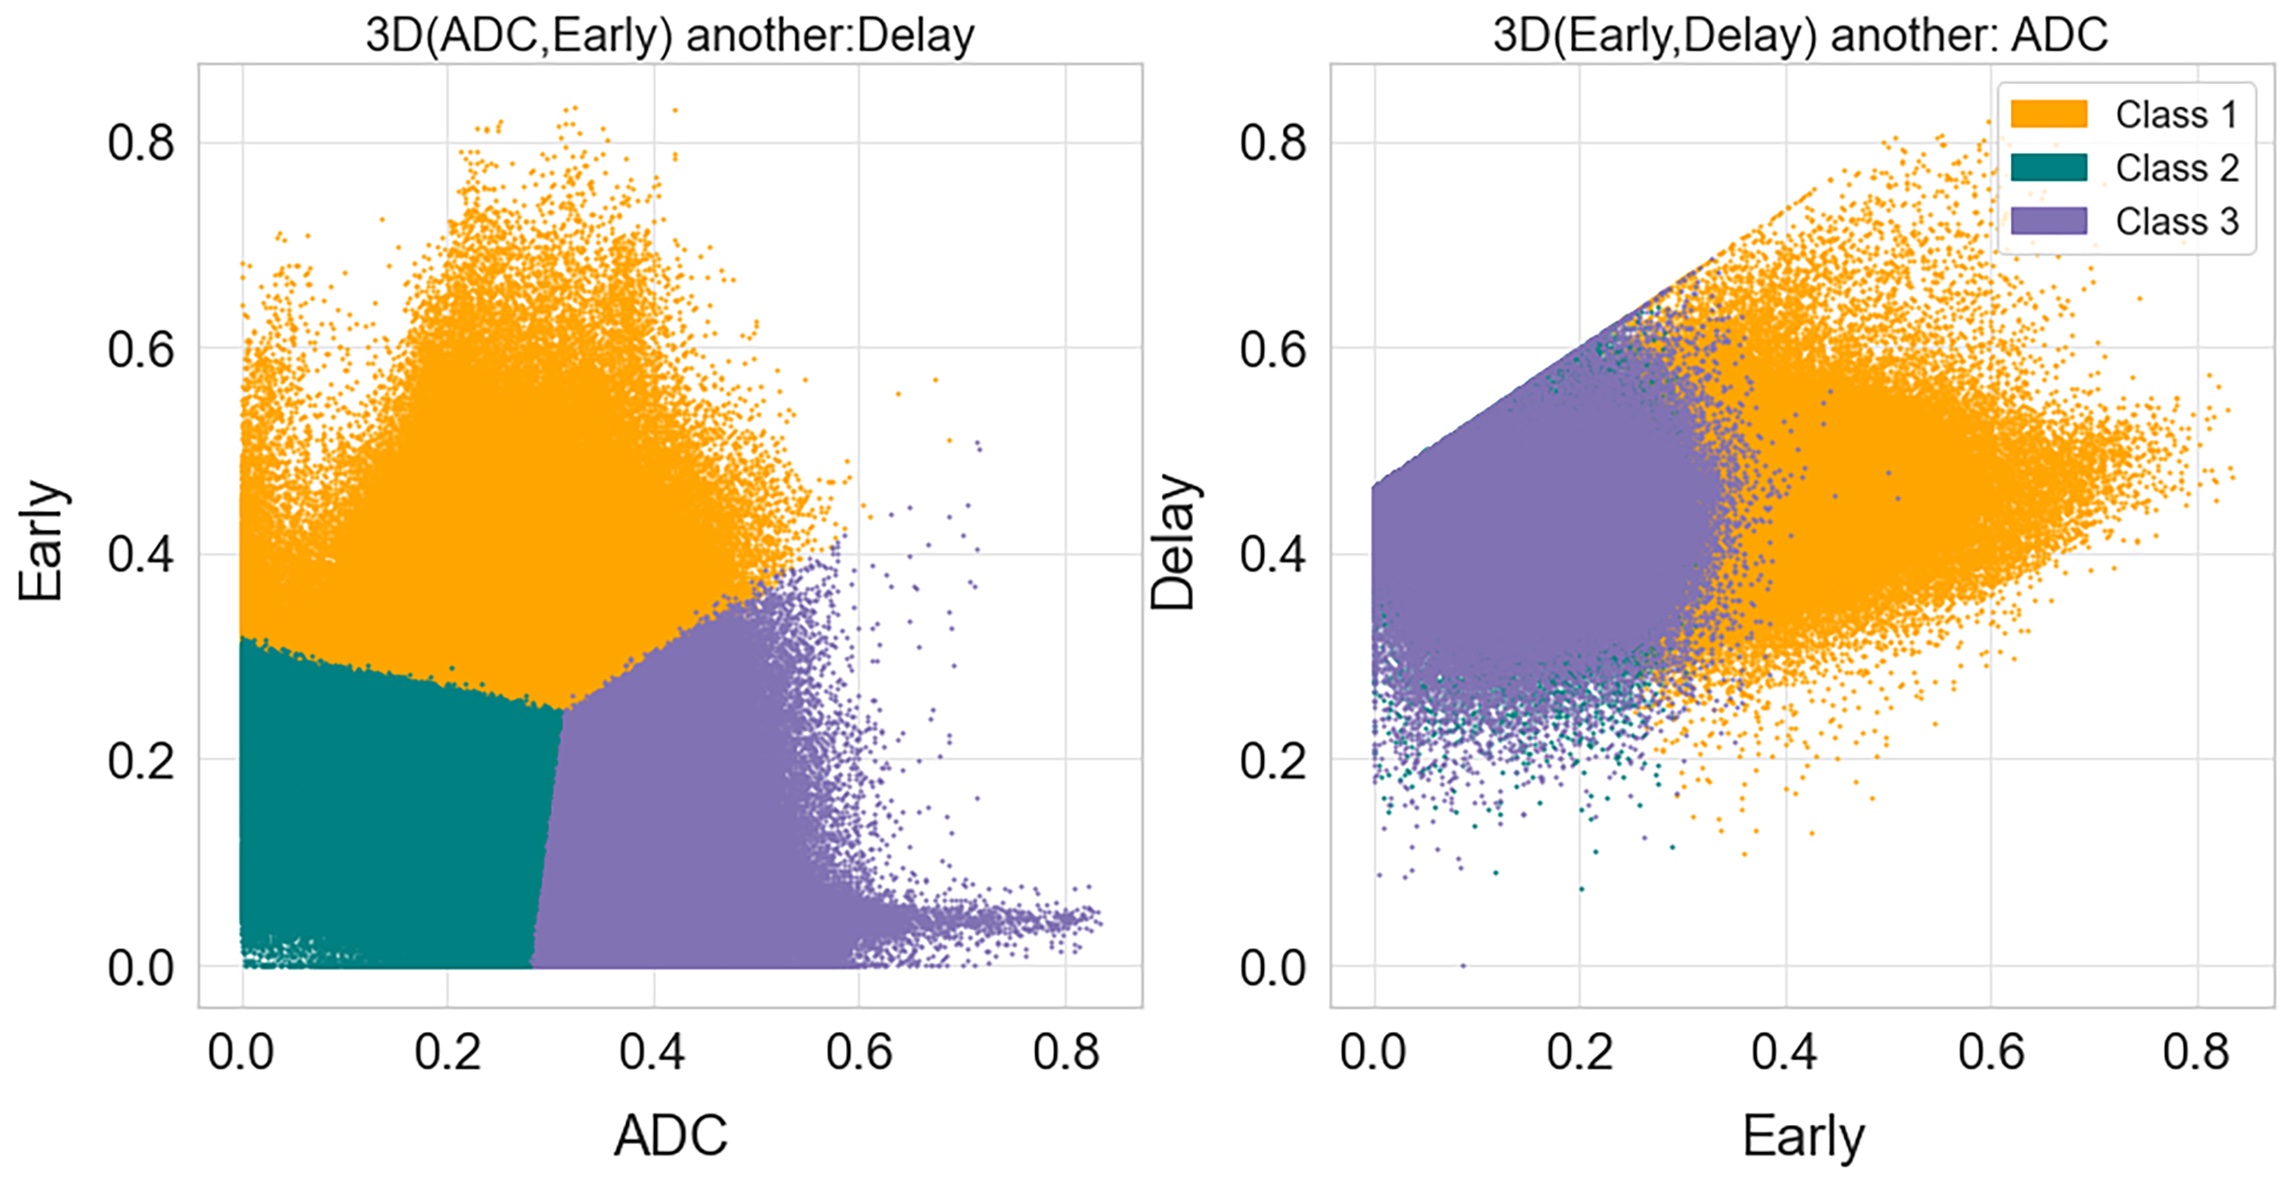
Figure 1. Two dimensional projections of the three spatial habitats defined by clustered voxels from normalized apparent diffusion coefficient (ADC), wash-in, and wash-out maps,. Habitat 1 (orange) shows high wash-in and wash-out on behalf of the aggressive habitats. Meanwhile, habitat 2 (green) and 3 (purple) show low and high ADC values, though occupying the same region in perfusion space. They are assigned to be the hypoxia/ischemia and necrosis regions accordingly.
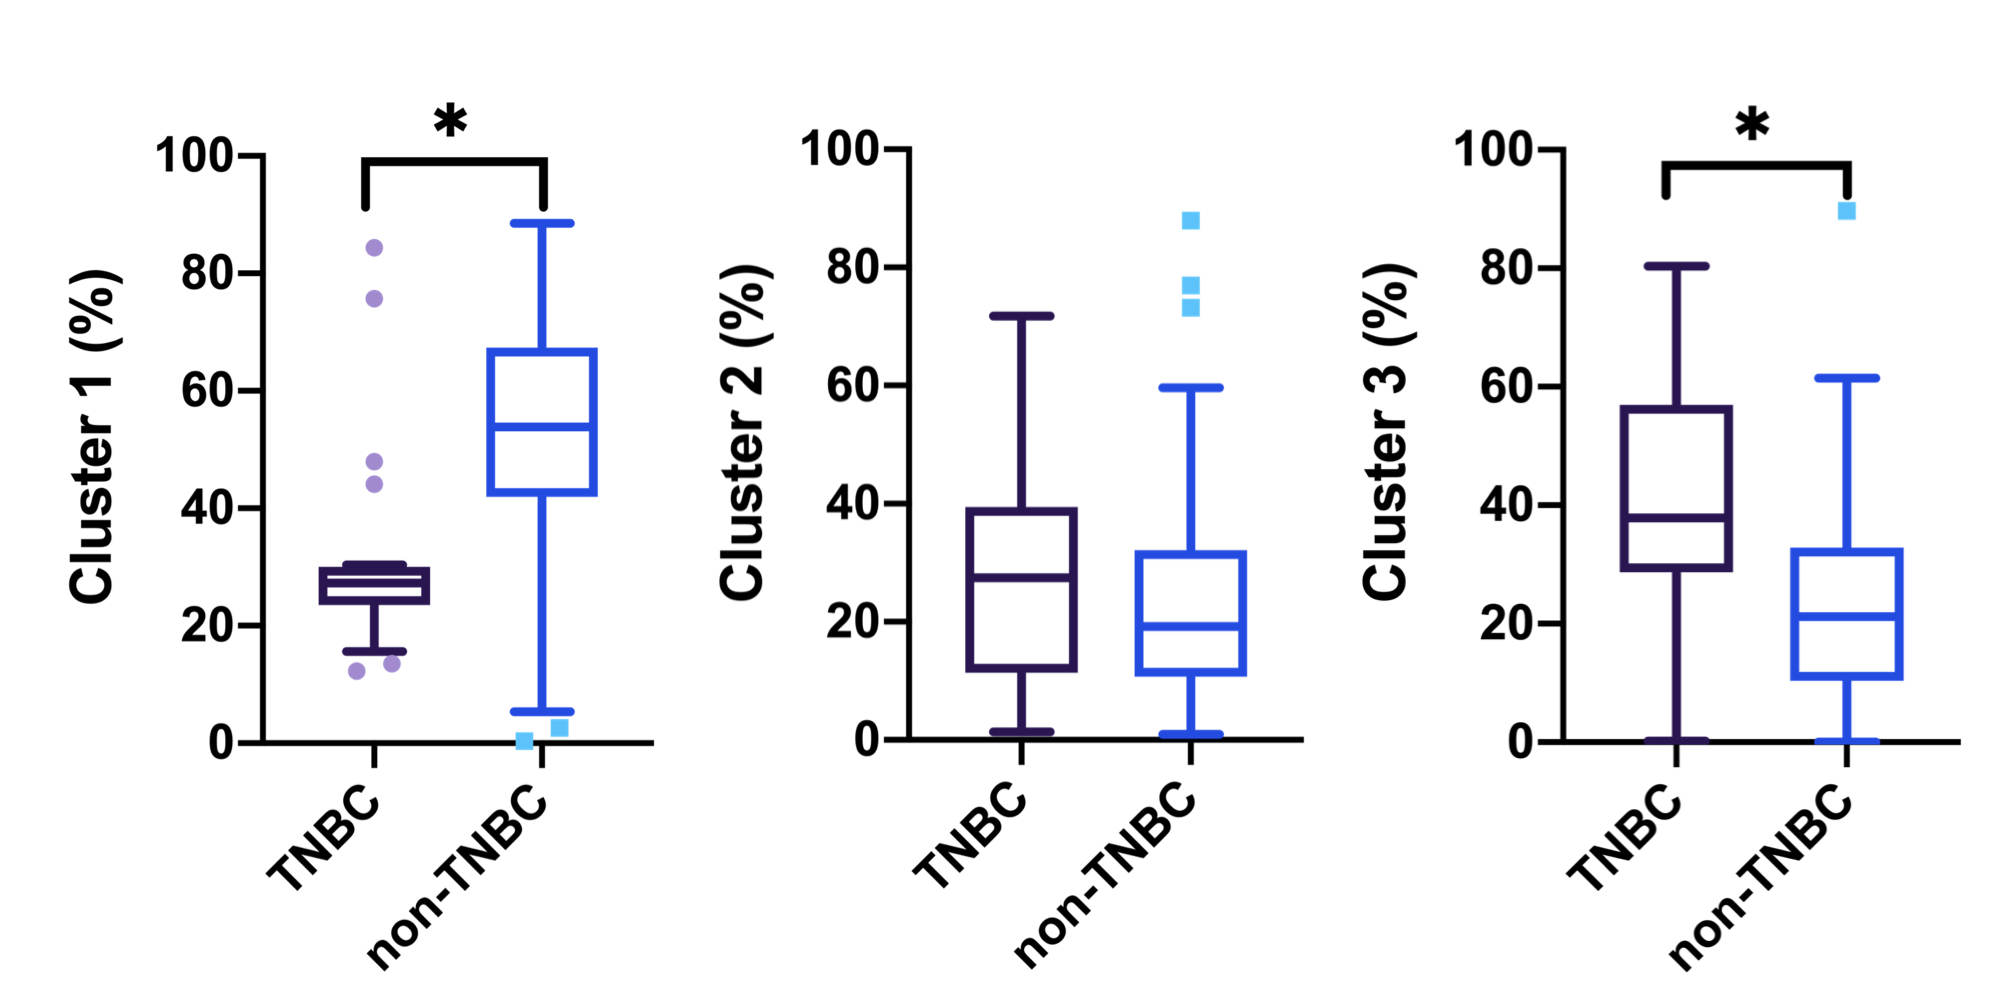
Figure 2. Box plots of three physiologic MRI habitats between the triple negative breast cancer (TNBC) and non-TNBC patients. Patients with TNBC showed a significantly lower Habitat 1 (a), higher Habitat 2 and Habitat 3 (c) than patients with non-TNBC.
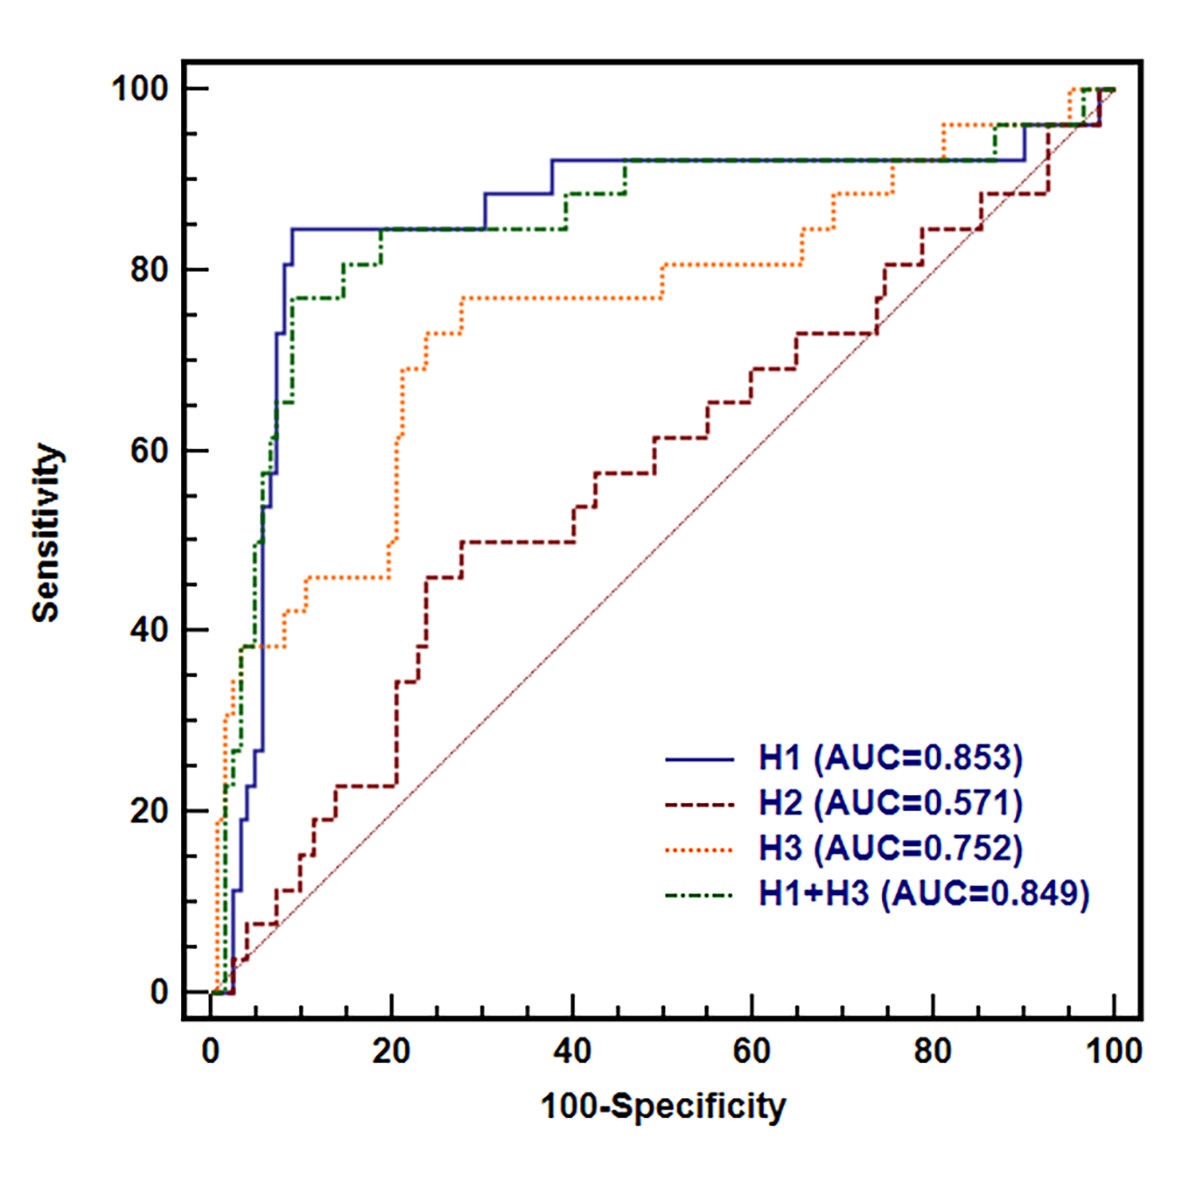
Figure 3. The comparisons of ROC curves of physiologic MRI habitat for distinguishing TNBC from non-TNBC. ROC analysis revealed AUCs of 0.853 for Habitat 1 (95% CI, 0.786 to 0.906) and 0. 752 for Habitat 3 (95% CI, 0.674–0.819) for differentiating between the TNBC and non-TNBC.