0070
Empirical normative models to identify patterns of anomalous white matter in autism spectrum disorder1University of Wisconsin, Madison, WI, United States, 2University of Utah, Salt Lake City, UT, United States, 3Harvard Medical School, Cambridge, MA, United States, 4Brigham Young University, Provo, UT, United States, 5University of Florida, Gainesville, FL, United States
Synopsis
Keywords: Data Analysis, Brain
Normative modeling offers a promising approach for better characterization of brain differences in heterogeneous populations. In this study, empirical normative modeling was applied to characterize white matter regional heterogeneity of DTI measurements in adolescents and young adults with more cognitively-and-verbally able autism spectrum disorder (ASD) in comparison to an age matched cohort of typically developing controls. The results of this study demonstrated that the individual differences in DTI measurements in many JHU white matter regions are extremely heterogeneous across the ASD cohort. Hierarchical clustering analysis revealed three groups of white matter regions with similarity patterns across six subgroups within ASD.Introduction
Autism spectrum disorder (ASD) is a developmental disability that is broadly characterized by challenges with social skills, repetitive behaviors, and social communication. The etiology, manifestation, genetics and brain structure and function are all highly variable in ASD, thus there is a critical need to better identify and characterize the heterogeneity. A common observation in brain imaging studies of ASD and typically developing controls (TDC) is great similarity across the groups with more variability in the ASD group1–5. This is likely a major source of divergent findings across ASD neuroimaging research studies6–8.Recently, analysis methods have been developed to identify brain imaging measures of individuals that deviate substantially from a normative population9. These methods are promising for better characterizing brain differences in heterogeneous populations. These normative modeling approaches have recently been applied to studies of ASD, with several that focus on heterogeneity of T1-weighted structural images10–12. In this study, normative modeling was applied to characterize white matter regional heterogeneity of DTI measurements in adolescents and young adults with more cognitively- and verbally-able ASD in comparison to an age matched TDC cohort.
Methods
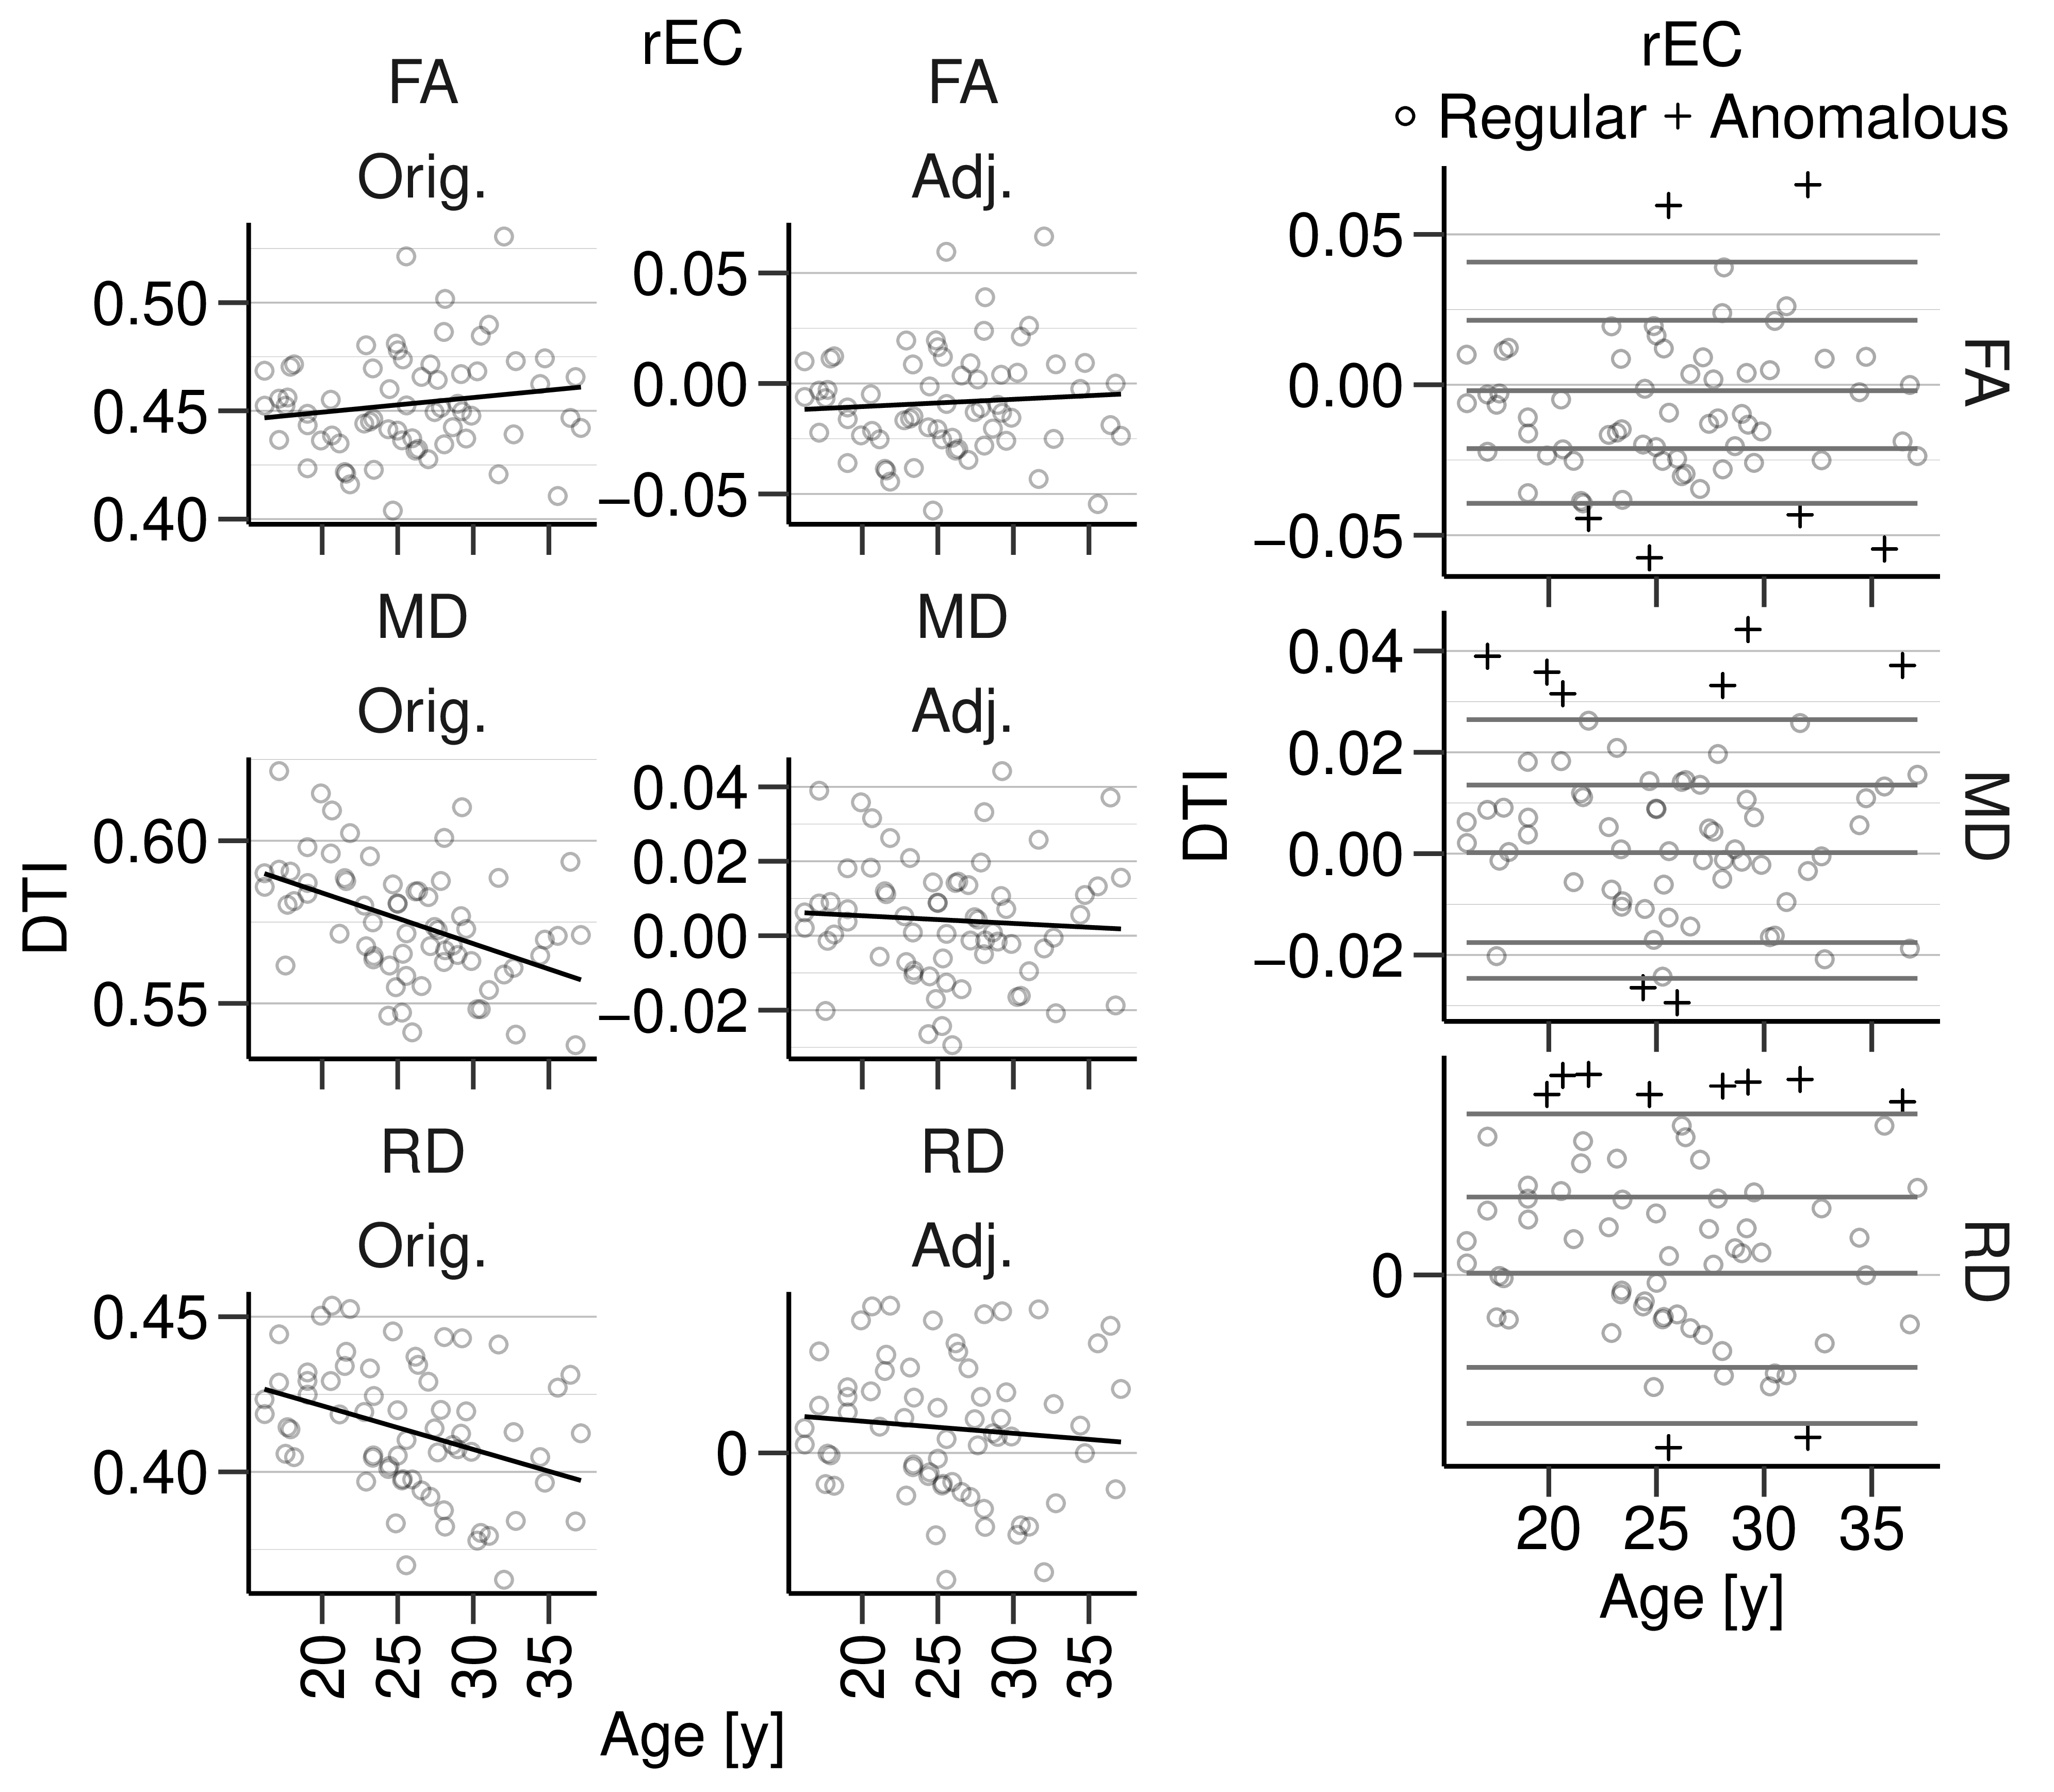
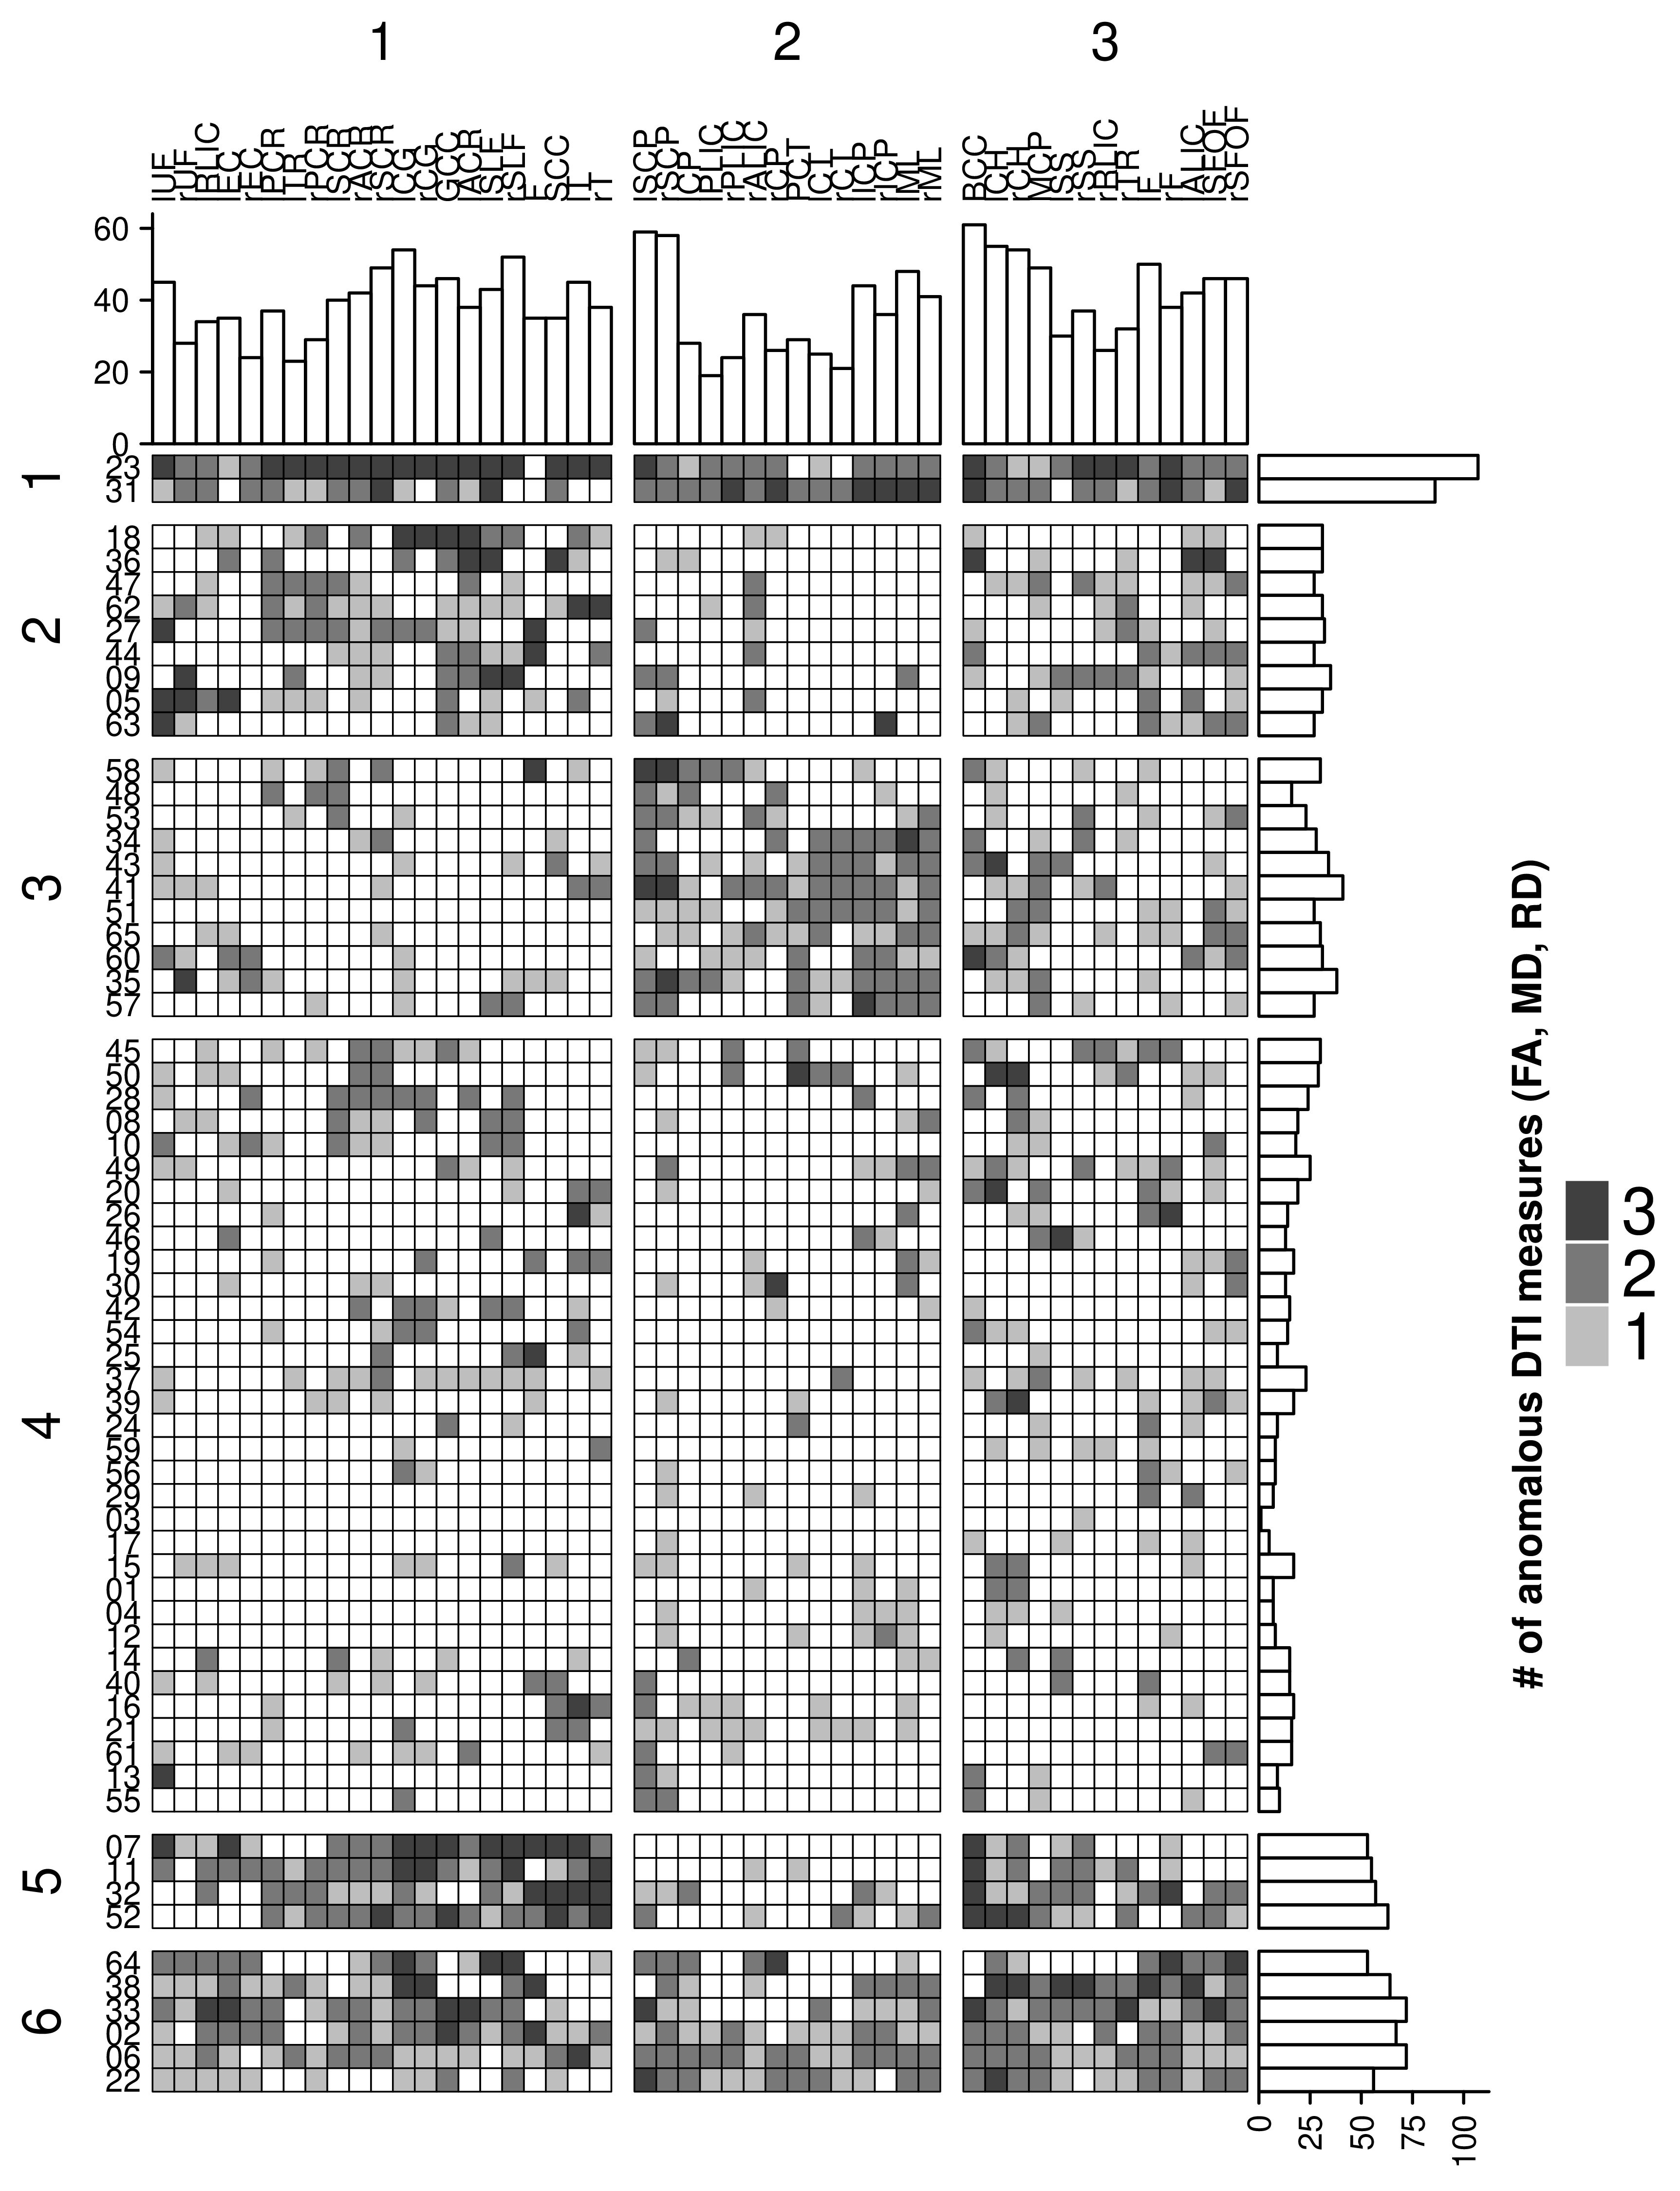
Diffusion tensor imaging (DTI) data were collected at 3T from n=116 male individuals aged 16-38 years of age (Table 1). Briefly, diffusion data were acquired with 12 non-collinear directions and b=1000 s/mm2, and a single b=0 s/mm2 image was acquired. Additional parameters included: TR=7000 ms; TE=91 ms; FOV=25.6 cm; 2.0 mm2 in-plane resolution, and 60 contiguous 2.5 mm thick slices. State-of-the-art processing was used to extract FA, MD, and RD in the JHU white matter atlas regions. Data were detrended for linear effects of age and demeaned using estimates from TDC group. 95% and 5% normative quantiles were determined using empirical cumulative distribution functions for each region and measure. ASD individuals with DTI measures outside the normative quantile range were classified as anomalous. To identify patterns of anomalous white matter and heterogeneity in ASD, hierarchical clustering analysis of ASD individuals and white matter regions was performed using Euclidean distance between cumulative (across three DTI measures) anomalous count vectors derived per individual and region.| Table 1 | ||
| Group | n | Age [years] |
| ASD | 65 | 25.7±5.43 |
| TDC | 51 | 25.0±5.23 |
Results
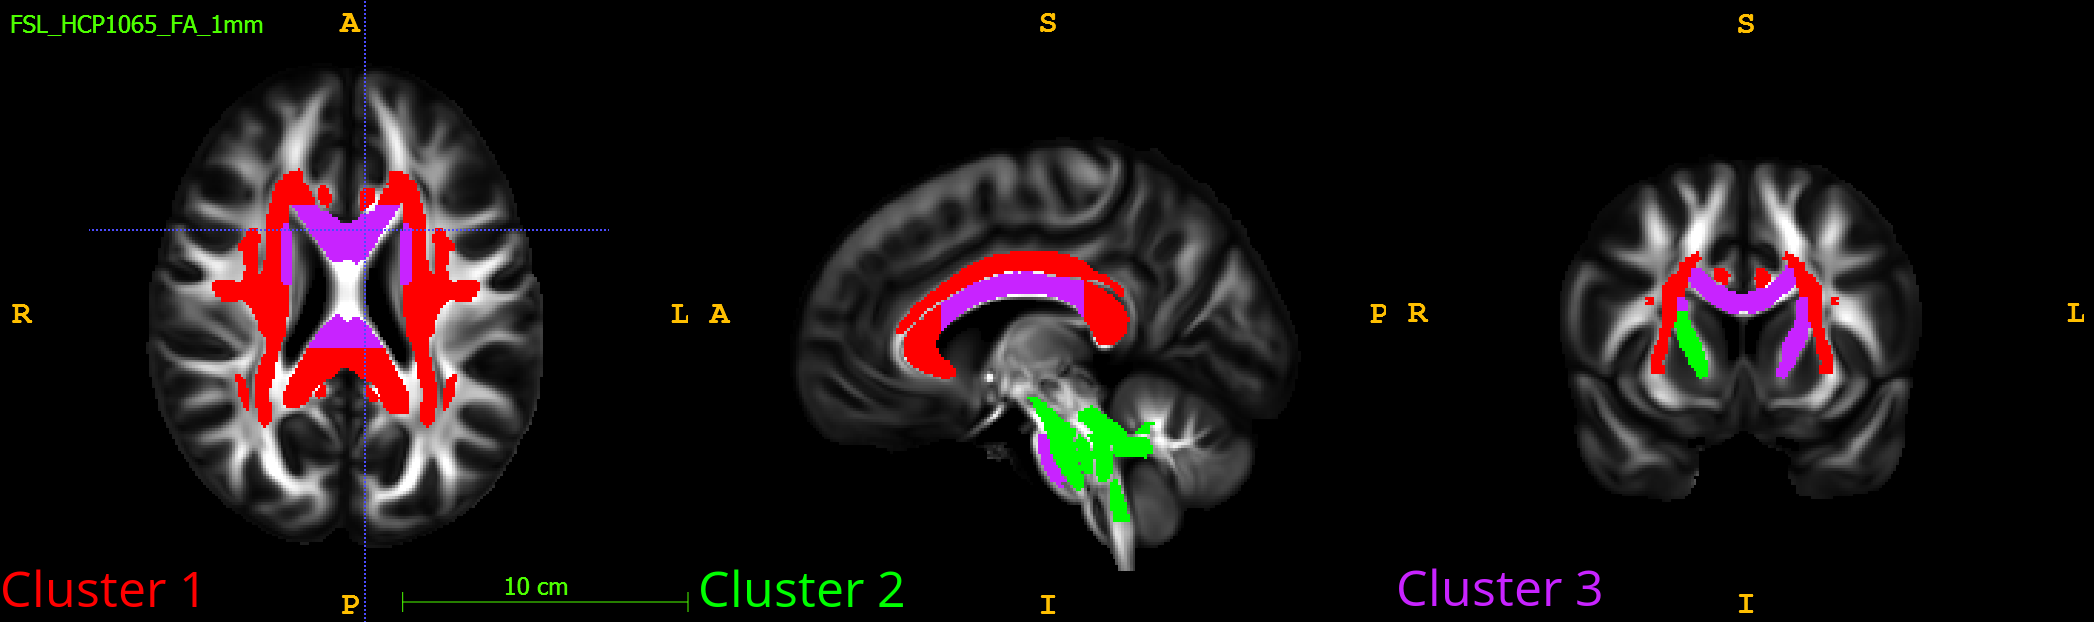
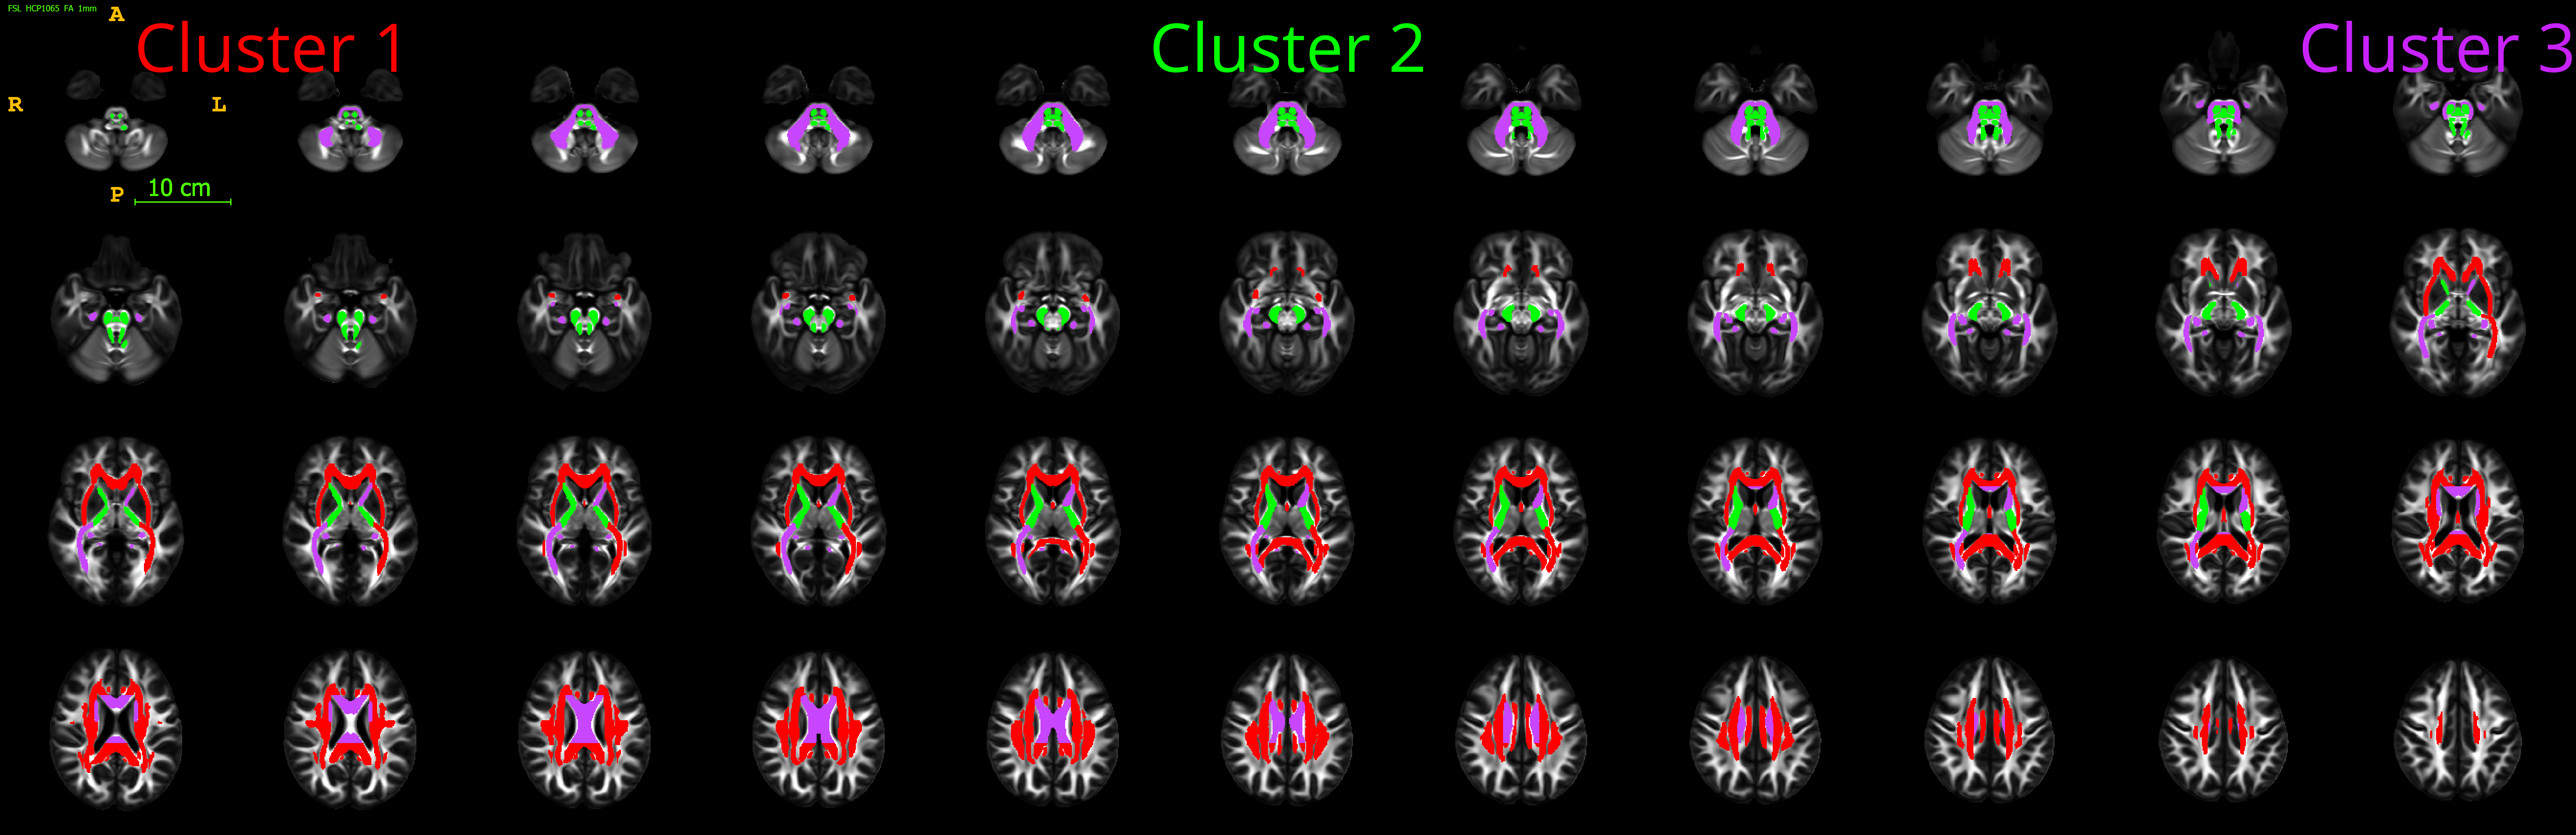
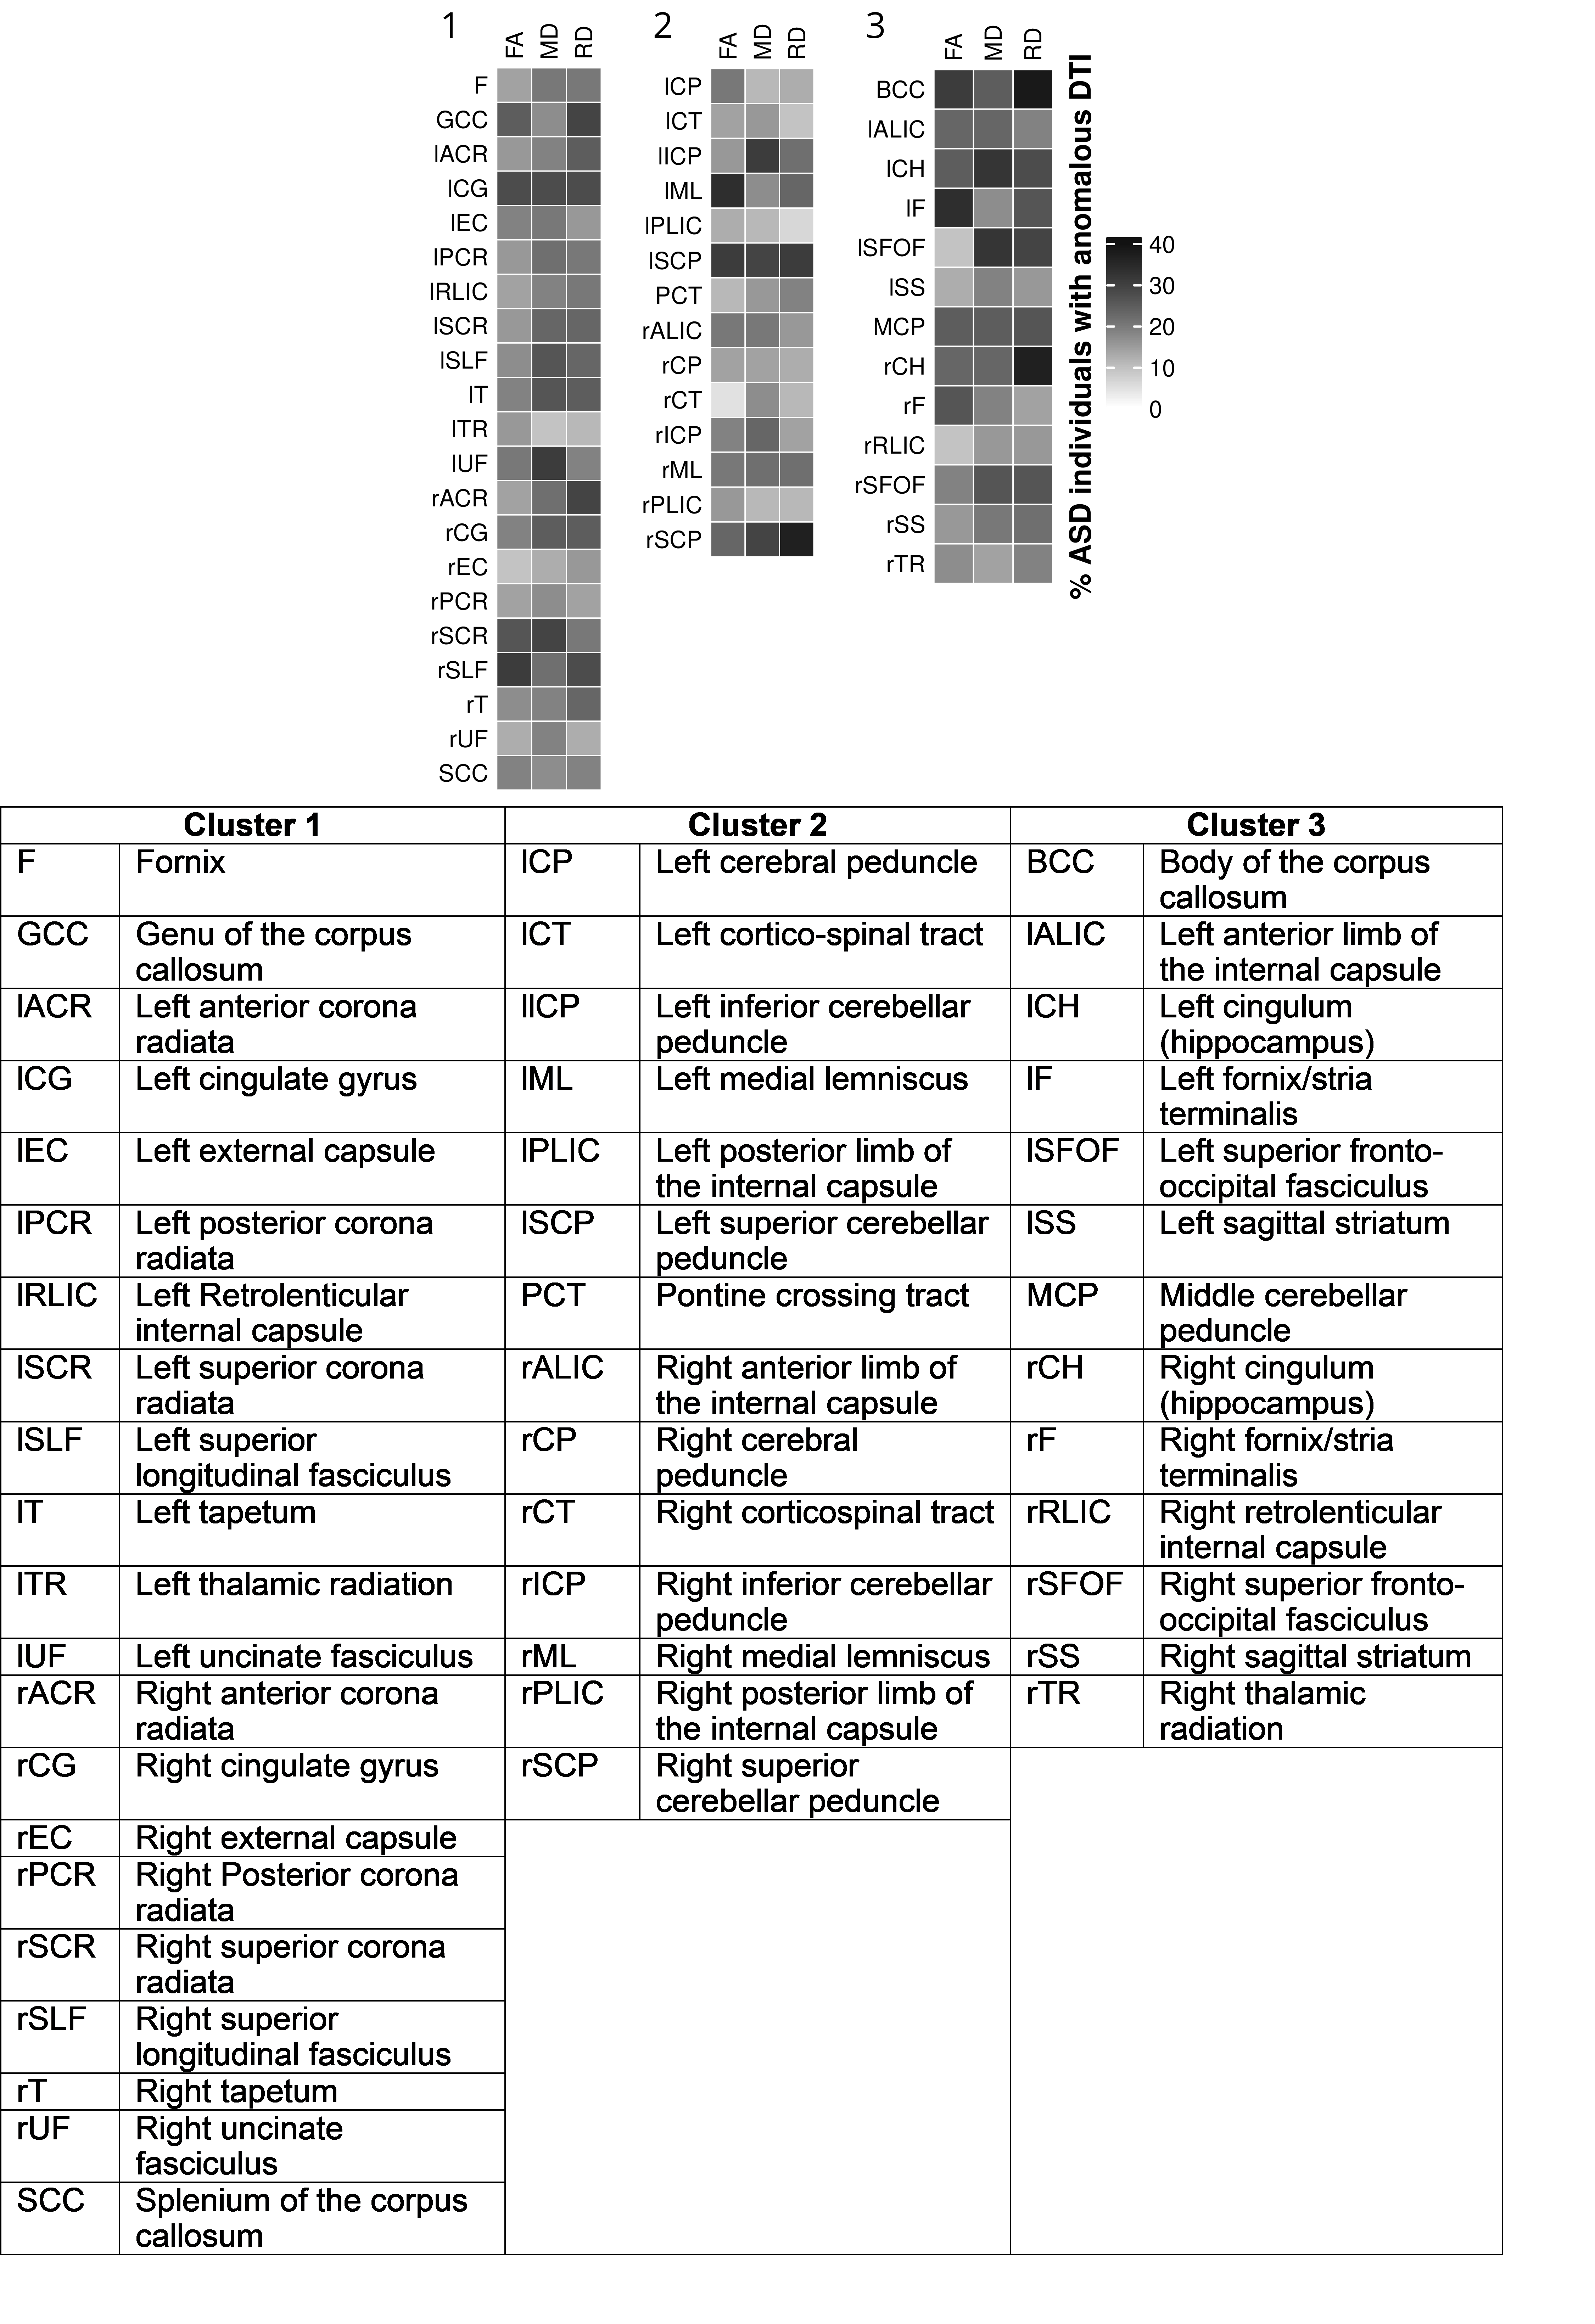
Fig. 1 shows exemplar data of detrending age effects and anomaly classification of ASD individuals. Fig. 2 shows clustering of ASD participants and white matter regions based on the cumulative anomaly counts. ASD individuals were clustered into 6 subgroups providing evidence for subgroups comprising the autism spectrum. Most ASD individuals had anomalous measures in at least one diffusion measure and region. Some individuals had severe anomalies where DTI measures were anomalous across the 48 regions. When parsing the clusters on the two dimensions (individuals and regions) there were 18 subgroups. For example, cluster-3 of ASD individuals had a subgroup with severe anomalies in the cluster of brainstem regions but not as severely in the other two clusters, while cluster-5 of ASD individuals had severe anomalous DTI in clusters-1 and 2 of regions but not in the brainstem cluster. Cluster-4 is the most heterogeneous subgroup in ASD. Figs. 3 and 4 show brain maps of the three white matter clusters. Fig. 5 shows percentage of anomalous ASD individuals for each region and DTI measure. Across all regions and measures at least ~10% ASD individuals had anomalous DTI.Discussion
The normative model framework in this study demonstrated that the individual differences in DTI measurements are extremely heterogeneous across the ASD cohort. Nearly all individuals with ASD demonstrated atypical regional measurements in one or more regions and many individuals demonstrated multiple atypical regions. A clustering analysis revealed three groups of white matter regions with similarity patterns across six subgroups of the ASD cohort. The first white matter cluster consisted of many of the medial and dorsal white matter regions including genu and splenium of the corpus callosum, internal capsules, and association pathways. The second cluster included more ventral association white matter, body of the corpus callosum and the cerebellar peduncle. The third cluster consisted of the brainstem white matter excluding the cerebellar peduncle. Interestingly, these clusters of atypical white matter appear to delineate dorsal, ventral and brainstem regions. Atypical white matter was also commonly observed in regions of the corpus callosum, which is one of the most consistent regions of white matter anomalies in ASD8,13,14.A few limitations with the current study include the moderate sample size and the broad age range. Although TDC linear age-effects were regressed out prior to the analyses, the analyses here did not account for age by group interactions. Future replication of these results in larger autistic and TDC samples is needed. In addition, future analyses will investigate the relationships of the white matter clusters to clinical severity and other outcome measures.
Conclusion
The results of this study were consistent with prior studies that report greater brain heterogeneity in ASD. Using a normative modeling framework, we observed that most of the ASD cohort had anomalous white matter measurements, while all white matter regions were anomalous in several of the ASD individuals. Region by individual cluster analysis revealed three primary white matter clusters that may be promising as endophenotypes for assessing heterogenous individual differences in ASD.Acknowledgements
Support from the NIH grants R01MH080826, R01MH132218, P50HD105353 is acknowledged. Research participants and their families are gratefully acknowledged for volunteering to participate in the study.References
1. Amaral, D. G., Schumann, C. M. & Nordahl, C. W. Neuroanatomy of autism. Trends Neurosci. 31, 137–145 (2008).
2. Anagnostou, E. & Taylor, M. J. Review of neuroimaging in autism spectrum disorders: what have we learned and where we go from here. Mol. Autism 2, 1–9 (2011).
3. Byrge, L., Dubois, J., Tyszka, J. M., Adolphs, R. & Kennedy, D. P. Idiosyncratic brain activation patterns are associated with poor social comprehension in autism. J. Neurosci. 35, 5837–5850 (2015).
4. Hahamy, A., Behrmann, M. & Malach, R. The idiosyncratic brain: distortion of spontaneous connectivity patterns in autism spectrum disorder. Nat. Neurosci. 18, 302–309 (2015).
5. Dean III, D. C. et al. Multivariate characterization of white matter heterogeneity in autism spectrum disorder. NeuroImage Clin. 14, 54–66 (2017).
6. Ecker, C. et al. Describing the brain in autism in five dimensions—magnetic resonance imaging-assisted diagnosis of autism spectrum disorder using a multiparameter classification approach. J. Neurosci. 30, 10612–10623 (2010).
7. Ecker, C. & Murphy, D. Neuroimaging in autism—from basic science to translational research. Nat. Rev. Neurol. 10, 82–91 (2014).
8. Travers, B. G. et al. Diffusion Tensor Imaging in Autism Spectrum Disorder: A Review. Autism Res. 5, (2012).
9. Marquand, A. F., Rezek, I., Buitelaar, J. & Beckmann, C. F. Understanding heterogeneity in clinical cohorts using normative models: beyond case-control studies. Biol. Psychiatry 80, 552–561 (2016).
10. Bethlehem, R. A. I. et al. A normative modelling approach reveals age-atypical cortical thickness in a subgroup of males with autism spectrum disorder. Commun. Biol. 3, 1–10 (2020).
11. Zabihi, M. et al. Dissecting the heterogeneous cortical anatomy of autism spectrum disorder using normative models. Biol. Psychiatry Cogn. Neurosci. Neuroimaging 4, 567–578 (2019).
12. Shan, X. et al. Mapping the heterogeneous brain structural phenotype of autism spectrum disorder using the normative model. Biol. Psychiatry 91, 967–976 (2022).
13. Alexander, A. L. et al. Diffusion tensor imaging of the corpus callosum in Autism. Neuroimage 34, 61–73 (2007).
14. Travers, B. G. et al. Atypical development of white matter microstructure of the corpus callosum in males with autism: A longitudinal investigation. Mol. Autism 6, (2015).
Figures