0067
Quantitative Magnetization EXchange (MEX) MRI Measurement of Liver Fibrosis Model in Rodents1Biomedical Engineering, Tel Aviv University, Tel Aviv, Israel, 2School of Chemistry, Tel Aviv University, Tel Aviv, Israel, 3Sagol School of Neuroscience, Tel Aviv University, Tel Aviv, Israel
Synopsis
Keywords: Liver, Preclinical, MEX
Quantitative MRI can elucidate the complex microstructural changes in liver disease. The MEX method estimates macromolecular fraction, such as collagen, and can potentially aid in this task.
Rats and mice were given CCl4 to induce liver fibrosis and canned using a 7T scanner with MEX sequence (selective suppression and magnetization exchange) and macromolecular fraction (F) and T1 were extracted. Histology quantitative evaluation of collagen and inflammation scoring was conducted.
F-values of fibrotic rats and mice were significantly increased and correlated with quantitative collagen percentage. T1 was significantly elevated with higher inflammation scores.
Introduction
Liver fibrosis is the result of excessive deposition of collagen, and other macromolecules in the extracellular matrix (1–3). It may be concomitant with inflammation and steatosis. Liver fibrosis is expected to become the leading indication for liver transplantation and liver-related mortality (4).MRI scans are increasingly used for liver disease diagnosis. The challenge lies in the complexity of combination of fibrosis, steatosis and inflammation. Thus, different MRI contrasts and techniques are available, each with its drawbacks: T2 and T1 relaxation (5, 6), proton density fat fraction (7, 8), MR elastography (5, 9), and T1⍴, diffusion weighted imaging (10) and Amide proton transfer contrast (11).
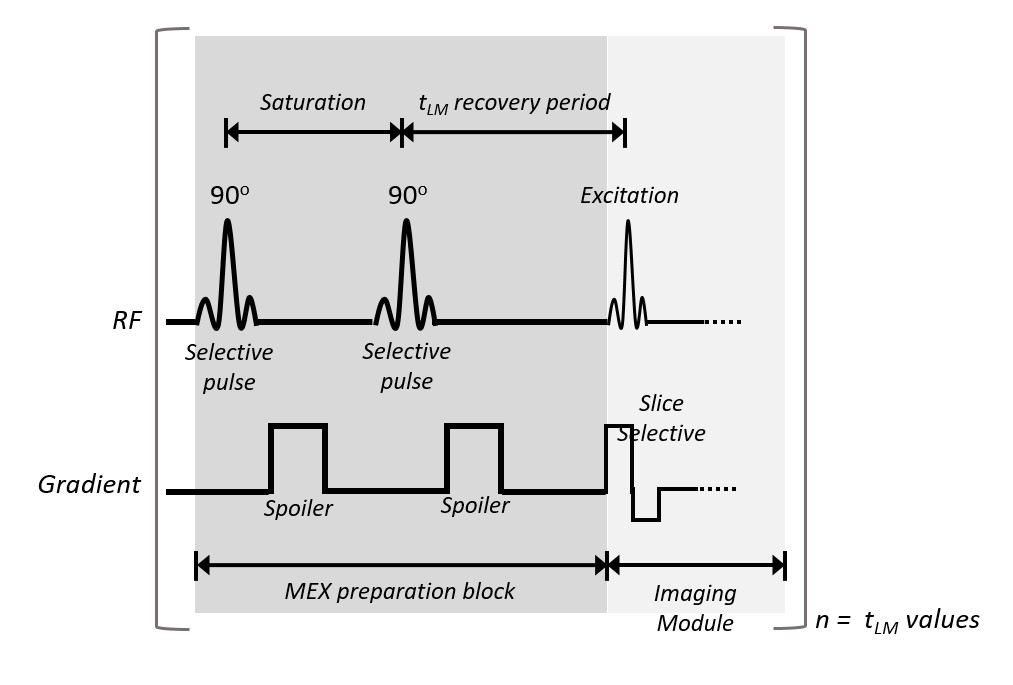
Magnetization EXchange (MEX) pulse sequence allows the acquisition of a signal generated from macromolecular components of the tissue with quantification analysis of the volumetric fraction of macromolecules (12, 13). The MEX signal is acquired using selective saturation pulses and spoiling gradients, followed by a recovery period. The magnetization detected is divided into two contributions: free water interaction (the fitted T1 value), and the magnetization transferred from non-aqueous protons. MEX was previously used to quantify the myelin fraction in normal and demyelination pathology(12, 13).
The purpose of this study is to test the MEX sequence and its derived quantitative parameter of macromolecular fraction with association to collagen deposition.
Methods
Animal ModelSixteen Sprague-Dawley rats and 13 C57BL⁄6 mice given carbon tetrachloride (CCl4) twice-weekly. Rats were evaluated after 6 (ntreat=10, ncontrol=6) and 8 weeks (ntreat=6, ncontrol=3). Mice treatment (n=9) and control (n=4) groups were scanned after 8 weeks. Following the scans, histological assessment, automated spectral segmentation and inflammation scoring were conducted. See Ref (14).
MRI Scans
All scans were performed using a 7T Bruker BioSpec scanner (Bruker Biospin, Germany). MEX sequence is described in Fig.1, which was repeated with multiple delay times. The entire MEX block was performed before each signal acquisition, such that the rows of the k-space are uniformly weighted by tLM. A reference spin-echo or gradient-echo scan was additionally performed.
Rats: SE, 9 delay-times (15-3000[ms]), 5 slices, TE/TR=7.2/1500[ms], 128x128 matrix, and FOV=57x55mm2.
Mice: GE, 9 delay-times (15-2500[ms]), 2 slices, TE/TR=3.2/3400[ms], 64x64 matrix, and FOV=40x30mm2.
MEX Analysis
Analysis is based on Eq.[1], with fast exchange assumption and normalization by the longest tLM
$$\frac{S(t_{LM} )}{(S(t_{LM}=t_{LM}max))}=\frac{(F(1-exp(t_{LM}⁄\tau_{exc} ) )+(1-F)(1-exp(t_{LM}⁄T_1 ) ))}{(F(1-exp((t_{LM} max)⁄\tau_{exc} ) )+(1-F)(1-exp((t_{LM} max)⁄T_1 ) ) )}$$
F is the fraction semisolid protons, τexc is the exchange time, and T1 is the longitudinal relaxation time. Fitting was conducted using nonlinear least-squares Trust-Region algorithm with R2>0.95 threshold. Group statistical analysis were based on ROI segmentation with R2>0.999 requirement. See Ref (14).
Welch's t-test was used for group analysis and paired t-test for time-points progression. Correlations were evaluated using Pearson’s correlation.
Results
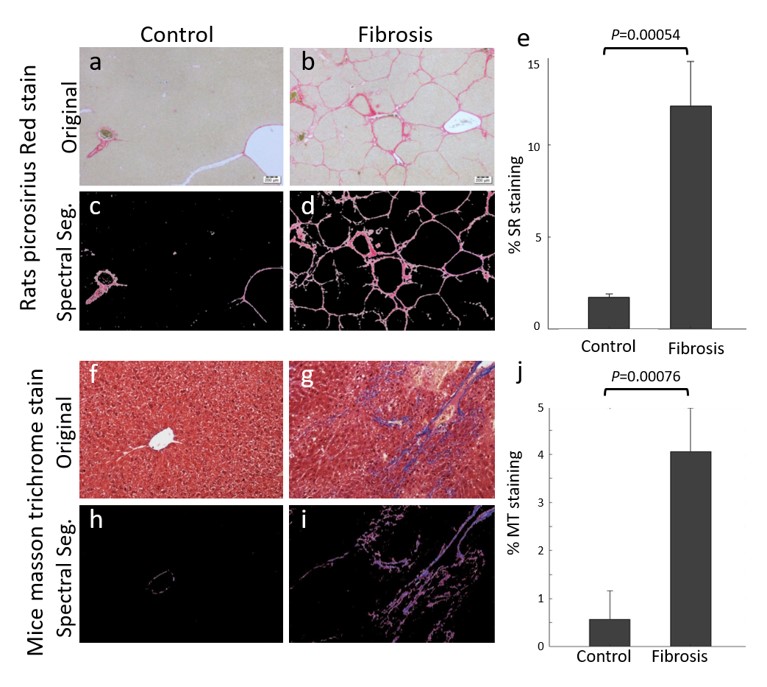
The percentage fibrotic tissue was significantly different between CCl4 rats and controls, 11.87%±0.03 and 1.972%±0.003, respectively (See Fig.2a-e). Mice results were 4.08%±0.02 fibrotic tissue for CCl4 mice, and 0.573%±0.006 for controls, see Fig.2f-j.Rats
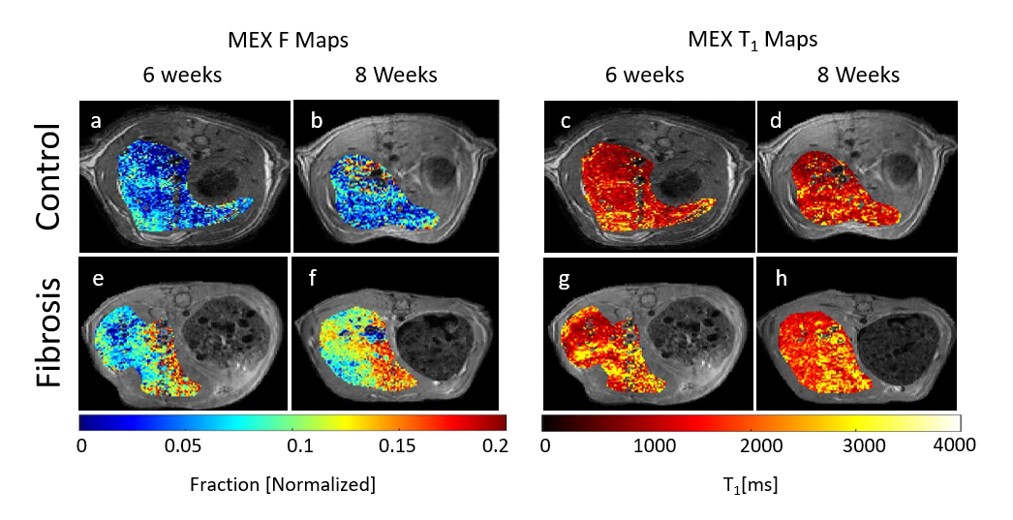
Fig.3a,b are F maps of a control rat after 6 and 8 weeks with ROIs values of 0.083±0.005 and 0.084±0.005. Fig.3e,f are the F maps for a CCl4 treated rat, with fitted values of 0.125±0.006 and 0.131±0.008. The ROI T1 values in Fig.3c,d,g,h are 1474±63[ms], 1591±38[ms], 1844±12[ms] and 1833±14[ms], respectively.
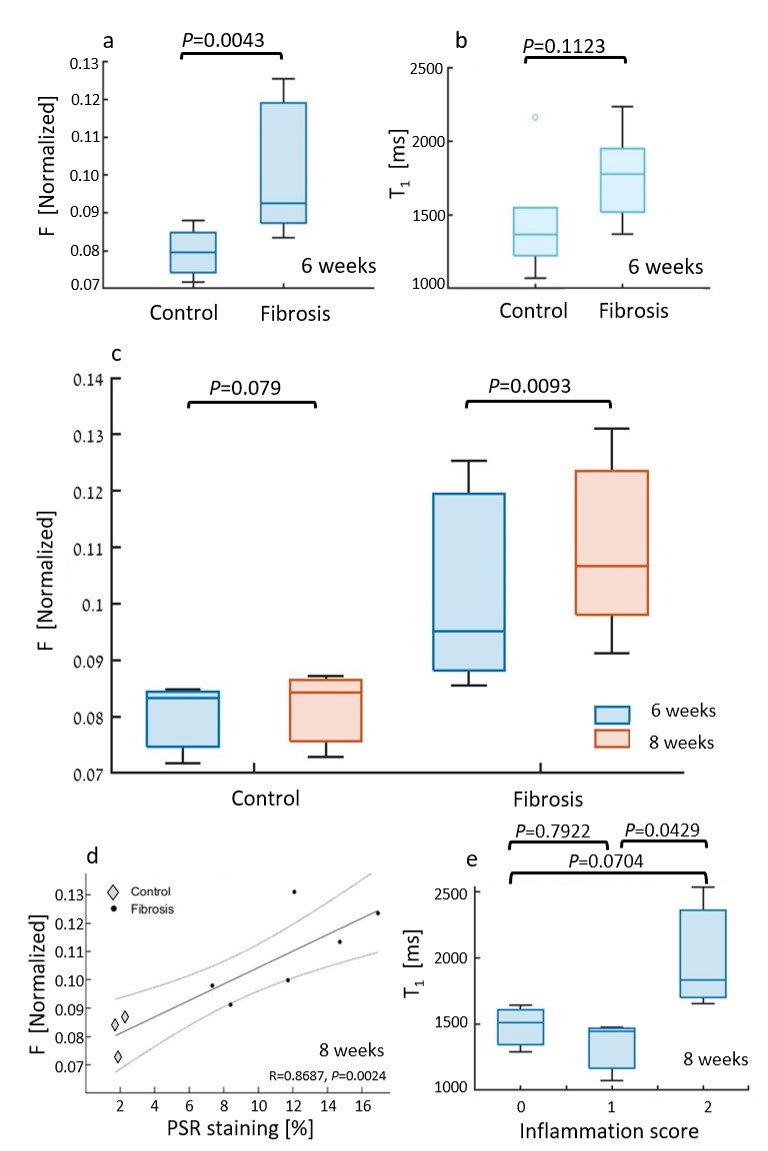
Fig.4a,b displays the group analysis at the 6 weeks' time-point. Mean F value is significantly increased by 24.7% in the treated group (CCl4: 0.099±0.016; control: 0.080±0.003). Fig.4c is the fitted F values comparison between the two time-points, were values increased by 7.9% for fibrosis, while controls show 1.8% non-significant increase (P=0.08). In Fig.4d, F values are correlated to collagen percentage (R=0.87). In Fig.4e, T1 vs. inflammation show non-significant change between 0 and 1 scores (P=0.79), and significant 33.7% increase 1 to 2 (0: 1481±177[ms]; 1: 1332±224[ms]; 2: 2007±464[ms]).
Mice
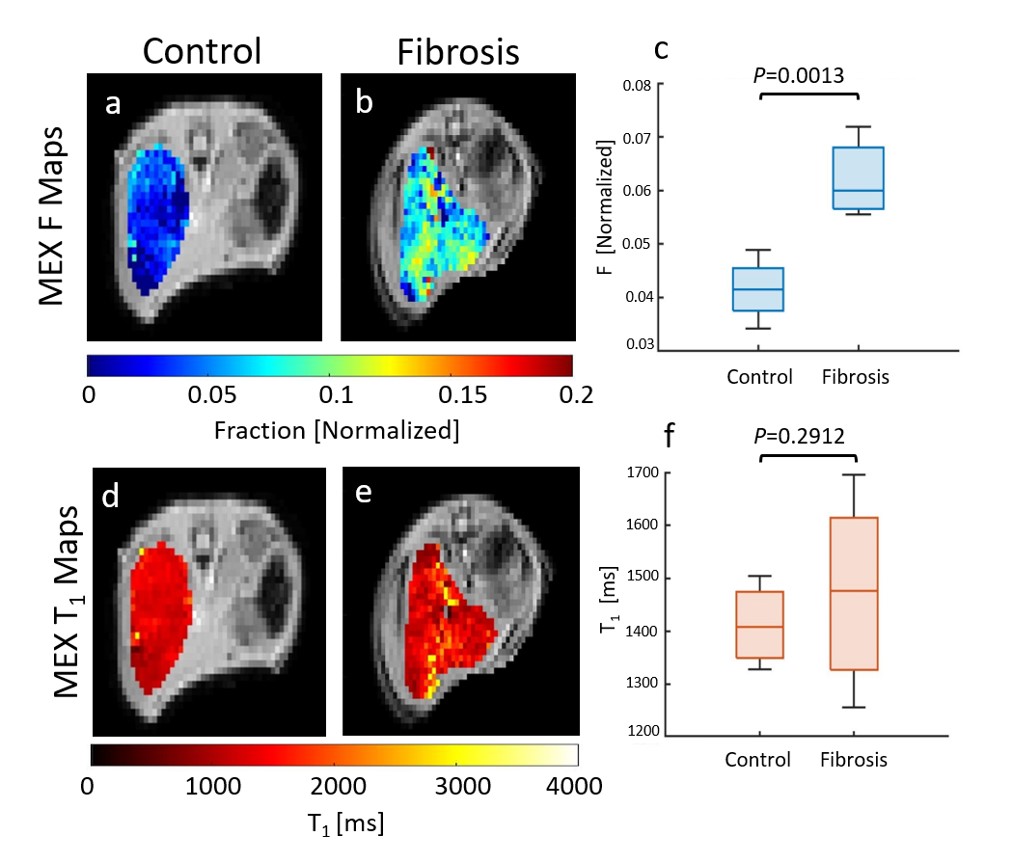
Fig.5a-b,d-e are F and T1 maps for representative animals, with ROI F value of 0.034±0.009 for control and 0.072±0.003 for the CCl4. The group analysis appears in Fig. 5c,f. The F value increased significantly by 49.7% (CCl4: 0.062±0.006, control: 0.042±0.006), while T1 values show an insignificant rise.
Correlation of F to spectral analysis (not shown) yielded R=0.88. T1 comparison to the inflammation (not shown) was not significant between 0 to 1 (P=0.77), while significantly increasing by 17.1% within the fibrosis group (0: 1436±54[ms], 1: 1366±99[ms], 2: 1648±45[ms]).
Full results in Ref (14).
Conclusions
The F value indicates the relative percentage of collagen in the liver. F is not sensitivite to inflammation, which is represented by the T1, thus pose as a promising biomarker for fibrosis.Following this study and the previous ones, the MEX sequence has proven its relevance to various tissues, making it a possible quantitative imaging method to many other pathologies.
Acknowledgements
This work is dedicated to the memory of our beloved colleague and NMR mentor, Dr. Uzi Eliav. Dr. Eliav's role over the years in developing multiple NMR methods, including the MEX method, and his role in this particular work were pivotal. His friendship and wisdom will be missed.References
1. Flier JS, Underhill LH, Friedman SL: The Cellular Basis of Hepatic Fibrosis -- Mechanisms and Treatment Strategies. N Engl J Med 1993; 328:1828–1835.
2. Dancygier H: Liver cirrhosis. In Clin Hepatol. Volume 2. Berlin, Heidelberg: Springer Berlin Heidelberg; 2010:949–965.
3. Bataller R, Brenner DA: Liver fibrosis. J Clin Invest 2005:209–218.
4. Estes C, Anstee QM, Arias-Loste MT, et al.: Modeling NAFLD disease burden in China, France, Germany, Italy, Japan, Spain, United Kingdom, and United States for the period 2016–2030. J Hepatol 2018; 69:896–904.
5. Hoffman DH, Ayoola A, Nickel D, Han F, Chandarana H, Shanbhogue KP: T1 mapping, T2 mapping and MR elastography of the liver for detection and staging of liver fibrosis. Abdom Radiol 2020; 45:692–700.
6. Li X, Benjamin Ma C, Link TM, et al.: In vivo T1ρ and T2 mapping of articular cartilage in osteoarthritis of the knee using 3 T MRI. Osteoarthr Cartil 2007; 15:789–797.
7. Reeder SB, Cruite I, Hamilton G, Sirlin CB: Quantitative assessment of liver fat with magnetic resonance imaging and spectroscopy. J Magn Reson Imaging 2011:729–749.
8. Ishak K, Baptista A, Bianchi L, et al.: Histological grading and staging of chronic hepatitis. J Hepatol 1995; 22:696–699.
9. DiPaola FW, Schumacher KR, Goldberg CS, Friedland-Little J, Parameswaran A, Dillman JR: Effect of Fontan operation on liver stiffness in children with single ventricle physiology. Eur Radiol 2017; 27:2434–2442.
10. Zhang H, Yang Q, Yu T, et al.: Comparison of T2, T1rho, and diffusion metrics in assessment of liver fibrosis in rats. J Magn Reson Imaging 2017; 45:741–750.
11. Lindquist DM, Fugate EM, Wang J, Sharma A, Gandhi CR, Dillman JR: MRI Measures of Murine Liver Fibrosis. J Magn Reson Imaging 2021; 54:739–749.
12. Eliav U, Navon G: The role of magnetization transfer in the observed contrast in T1 weighted imaging under clinical setups. NMR Biomed 2017; 30:e3792.
13. Wilczynski E, Sasson E, Eliav U, Navon G, Nevo U: An in vivo implementation of the MEX MRI for myelin fraction of mice brain. Magn Reson Mater Physics, Biol Med 2022; 35:267–276.
14. Wilczynski E, Sasson E, Eliav U, Navon G, Nevo U: Quantitative Magnetization EXchange MRI Measurement of Liver Fibrosis Model in Rodents. J Magn Reson Imaging 2022.Figures