0064
Comparing and combining MRI-ECV, DKI, and DWI for the staging of liver fibrosis in chronic hepatitis B Patients: A multiparametric model1Department of Radiology, The Second Affiliated Hospital of Guangzhou University of Chinese Medicine, Guangdong Provincial Hospital of Traditional Chinese Medicine, Guangzhou, China, 2MR Application Predevelopment, Siemens Healthcare GmbH, Erlangen, Germany, 3MR Scientific Marketing, SIEMENS Healthineers Ltd., Shanghai, China
Synopsis
Keywords: Liver, Liver
Liver fibrosis (LF) is a dynamic, reversible process which can result in liver failure. Diagnosis and monitoring of LF are clinically important. This study was to evaluate the diagnostic capability of the model based on multiparametric MRI in identifying significant LF in patients with chronic hepatitis B (CHB). The predictive model based on multiparametric MRI further could improve diagnostic accuracy and serve for identifying significant LF in CHB patients, also provide a reliable basis for clinical diagnosis and treatment.Objectives
Viral hepatitis is the main cause of liver fibrosis (LF) and liver cirrhosis in patients in China. Among them, chronic hepatitis B (CHB) is the most common. Incorporating LF into CHB pre-treatment assessment has important clinical value1. Recently, some studies showed that multiparametric MRI has a higher diagnostic accuracy for staging LF than individual MRI sequences2-4. Our study was to compare the efficiency of extracellular volume fraction (ECV), diffusion kurtosis imaging (DKI), and diffusion-weighted imaging (DWI) in distinguishing significant and mild LF. Secondly, an combined predictive model based on multiparametric MRI for staging LF in CHB patients were established and compared with those individual sequences.Methods
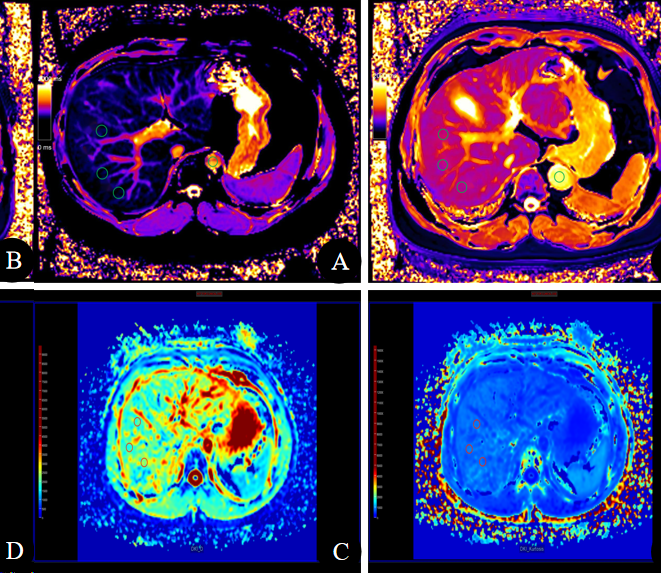
A total of 45 CHB patients were enrolled in this study and divided into two groups: significant group (LF stage ≥ 2) and mild group (LF stage < 2) according to liver biopsy based on the Scheuer scoring system. All patients underwent multiparametric MRI including MRI-ECV, DKI, and DWI on a 3T MR scanner (MAGNETOM Prisma, Siemens Healthineers Ltd., Erlangen, Germany) using a phased array body coil. DKI was performed by using a free-breathing single-shot echo-planar sequence with the following parameters: TR/TE = 7000/55 ms, slice thickness = 3.0 mm, FOV = 305×380 mm, matrix = 134×100, and entire acquisition time was 5 min 20 s. Five b values ranged from 0 to 2000 s/mm2 (0, 400, 800, 1000, 2000 s/mm2 with number of signal averages of 1, 2, 3, 4, 5, respectively),were applied in three diffusion directions. T1 mapping was conducted using a heart rate independent 5-(3)-3-(3)-3 modified Look-Locker inversion recovery (MOLLI) sequence, with following parameters: TR/TE = 5.0/2.3 ms, slice thickness = 4.0 mm, matrix = 162×288, FOV = 305×380 mm. Post-contrast T1 mapping was acquired after 10 min of contrast agent injection in the same positions as pre-contrast examination. Quantitative T1 maps were automatically reconstructed using the MapIt processing tool after data acquisition. By using hematocrit and the pre-contrast and post-contrast T1 relaxation times of liver and aorta, liver ECV fraction was calculated as follows5: ECVliver (%) = ΔR1liver/ΔR1aorta × (100-Hct), where ΔR1liver = 1/T1liver post-contrast - 1/T1liver pre-contrast and ΔR1aorta = 1/T1aorta post-contrast- 1/T1aorta pre-contrast. Three regions of interest (ROIs) with a fixed size of 100~150 mm2 were drawn on the right posterior lobe and right anterior lobe of liver on the three central continuous sections (Figure 2). Mean value of all ROIs was used as the T1 value of liver and aorta. DKI images were post-processed by using dedicated software (MR Body Diffusion Toolbox v1.4.0, Siemens Healthcare, Erlangen, Germany) to calculate parametrical maps of mean diffusivity (MD), mean kurtosis (MK) and apparent diffusion coefficient (ADC). Then the radiologist drawn six ROIS as T1 mapping to acquire MD, MK and ADC value of liver (Figure 2). The correlations between MRI parameters and LF stages were evaluated by Spearman correlation coefficient, and the differences of MRI parameters were compared between different LF stages using the one-way ANOVA test or Kruskal–Wallis test. The combined predictive model based on multiparametric MRI of ECV, MK, MD, and ADC was established using logistic binary regression. The diagnostic performance of ECV, MK, MD, ADC and the predictive model were assessed by receiver operating characteristic (ROC) analysis, and the DeLong test was performed to compare those AUCs. Statistical analyses were performed using SPSS software (version 25.0; Chicago, IL, USA) and Medcalc software (version 20.0; Mariakerke, Belgium). All tests were two-sided, and P < 0.05 was considered statistically significant.Results
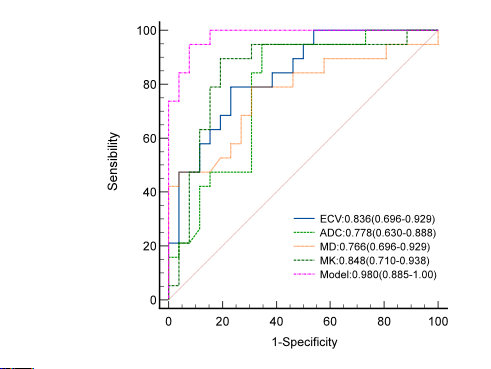
In this study, Of the 45 CHB patients, 19 was significant LF and 26 was mild LF. The values of ECV, MD, MK and ADC measurements were statistically significantly different among the different LF stages (p < 0.001). ECV and MK values were moderately positively correlated with the grades of LF (rho = 0.661, p < 0.001; rho = 0.551, p < 0.001 respectively). MD and ADC values were moderately negatively correlated with the grades of LF (rho = -0.508, p < 0.001; rho = -0.391, p < 0.001 respectively) (Table 1). The ECV, MD, MK and ADC parameters yielded high AUC values (0.836, 0.766, 0.848 and 0.778 respectively) for identifying significant LF. The predictive model yielded an AUC value of 0.980 (0.885-1.00), which was significantly higher than ECV, MD, MK and ADC (p < 0.05) (Table 2)(Figure 1).Conclusion
The predictive model based on multiparametric MRI provides a higher diagnostic performance for detection of LF in CHB patients in comparison to individual MRI parameter of ECV, MK, MD and ADC. Multiparametric MRI is an excellent non-invasive tool for the staging of CHB-related LF.Discussion
Noninvasive multiparametric imaging assessment of diffuse liver lesions is pivotal not only for accurately staging LF but also for longitudinally monitoring and evaluating therapeutic efficacy. Our study shows that multiparametric MRI is a feasible technique, with the great advantage of obtaining a tremendous amount of data from a single exam. The three MRI techniques used together were perfectly able to assess the different stage of CHB-related LF. This result reflects the clinical significance of this diagnostic tool and provide motivation for testing these multiparametric metrics in clinical studies of patients with CHB and for assessing innovative therapeutic interventions.Acknowledgements
No acknowledgement found.References
1. Liaw YF, Kao JH, Piratvisuth T, et al. Erratum to: Asian-Pacific consensus statement on the management of CHB: a 2012 update. Hepatol Int. 2012;6(4):809-810. doi:10.1007/s12072-012-9386-z.
2. Feier D, Balassy C, Bastati N, Fragner R, Wrba F, Ba-Ssalamah A. The diagnostic efficacy of quantitative liver MR imaging with diffusion-weighted, SWI, and hepato-specific contrast-enhanced sequences in staging LF--a multiparametric approach. Eur Radiol. 2016;26(2):539-546. doi:10.1007/s00330-015-3830-0.
3. Chen J, Martin-Mateos R, Li J, et al. Multiparametric magnetic resonance imaging/magnetic resonance elastography assesses progression and regression of steatosis, inflammation, and fibrosis in alcohol-associated liver disease. Alcohol Clin Exp Res. 2021;45(10):2103-2117. doi:10.1111/acer.14699.
4. Schaapman JJ, Tushuizen ME, Coenraad MJ, Lamb HJ. Multiparametric MRI in Patients With Nonalcoholic Fatty Liver Disease. J Magn Reson Imaging. 2021;53(6):1623-1631. doi:10.1002/jmri.27292.
5. Bandula S, Banypersad SM, Sado D, et al. Measurement of Tissue interstitial volume in healthy patients and those with amyloidosis with equilibrium contrast-enhanced MR imaging. Radiology. 2013;268(3):858-864. doi:10.1148/radiol.13121889.
Figures
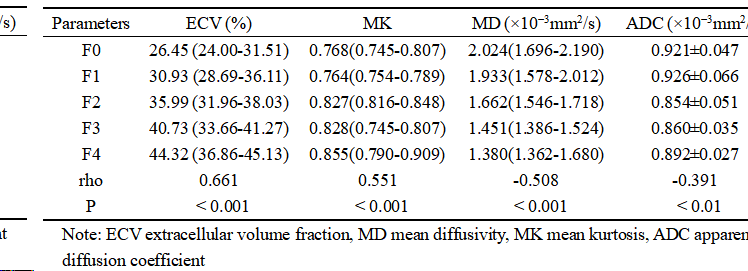
Table 1. Statistics of ECV, MK, MD and ADC and the correlation with clinical fibrosis scores.
Note: ECV extracellular volume fraction, MD mean diffusivity, MK mean kurtosis, ADC apparent diffusion coefficient
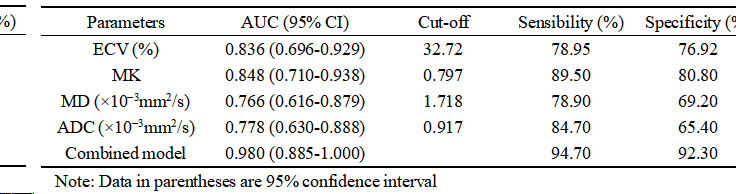
Table 2. Diagnostic performance of ECV, MK, MD, ADC and Combined predictive model for evaluating significant LF (LF ≥ F2).
Note: Data in parentheses are 95% confidence interval