0063
Evaluation of liver fibrosis using histogram analysis with diffusion kurtosis imaging and stretched-exponential diffusion model1Department of Magnetic Resonance, Lanzhou University Second Hospital, Lanzhou, China
Synopsis
Keywords: Liver, Diffusion/other diffusion imaging techniques, histogram analysis; stretched exponential model; diffusion kurtosis imaging
This study aims to evaluate the potential role of histogram analysis of diffusion kurtosis imaging (DKI) and stretched exponential model (SEM) for preoperative prediction of liver fibrosis and inflammation. Histogram metrics were extracted from mean diffusion (MD), mean kurtosis (MK), distributed diffusion coefficient (DDC) and intravoxel heterogeneity index (α). The histogram metrics of MD, DDC and α demonstrate significant correlation with inflammation, the histogram metrics of MD and DDC were significantly different between S0-1 and ≥S2. Histogram analysis of DKI and SEM may be potentially useful for evaluating heterogeneity of liver.Introduction and purpose
Progressive liver fibrosis (LF) is the main cause of morbidity and mortality in patients with chronic liver disease (CLD).While liver biopsy is the gold standard for assessing LF, it has limitations, including sampling errors, the risk of complications due to its invasiveness. Diffusion-weighted imaging (DWI) can be utilized to assess the degree of LF [1]. However, the conventional mono-exponential diffusion model is not suitable for evaluating tissue heterogeneity because of the non-Gaussian behavior of water in biological tissues. This non-Gaussian behavior of diffusion which reflects tissue heterogeneity and irregularity, however, can be explored by using DWI with high b values and advanced modeling of DWI data. Recently, several studies have reported that diffusion kurtosis imaging (DKI) and stretched exponential model (SEM) derived from DWI can provide valuable information on tissue microstructural complexity [2]. Histogram analysis could provide more information than simple mean values to capture the heterogeneity of the tissue. Therefore, we used histogram analysis of DKI and SEM for preoperative prediction of LF and hepatic inflammation.Materials and Methods
Seventy-four participants underwent DWI using twelve b values (0, 50, 100, 150, 200, 400, 600, 800, 1000, 1200, 1500, 2000 s/mm2) at 1.5 T magnetic resonance (Aera, Siemens Healthcare, Erlangen, Germany). DWI was acquired using a single-shot echo-planar imaging sequence in the axial orientation. The detailed parameters were as follows: TR/TE =6800/58ms, FOV=304×380mm2, scan matrix=108×134, slice thickness=6mm. Mean kurtosis (MK) maps, mean diffusion (MD) maps of DKI model, and distributed diffusion coefficient (DDC), intravoxel heterogeneity index (α) of SEM were calculated by using prototype post-processing software Body Diffusion Toolbox (Siemens, Erlangen, Germany).The degree of fibrosis and inflammation were assessed according to the Scheuer scoring systems. Based on their fibrosis stage, all participants were staged as S0-S4 (n=17, 14, 26, 7, 10, individually) and reclassified as non-significant LF (S0-1) and significant LF (≥S2). Hepatic inflammatory activity (HIA) was graded as G0–G4 (n=17, 6, 35, 8, 8, individually), and further divided into non-significant HIA (G0-G2, no and mild activity) and significant HIA (G3-G4, moderate and severe activity). Regions of interests (ROIs) for the liver were drawn along the margin of the right hepatic lobe, by excluding visible vessels, focal lesions and artifacts. Histogram metrics, including the 10th, 90th Percentile, Energy, Entropy, Interquartile (Iq) Range, Kurtosis, Maximum (Max), Mean Absolute Deviation (MAD), Mean, Median, Minimum (Min), Range, Skewness, Uniformity, Variance were generated form the related parameter maps. Spearman rank correlation analysis was performed to evaluate the correlation between histogram metrics and histological fibrosis stages and HIA. The histogram metrics were compared among non-significant and significant fibrosis using the independent t-test. Logistic regression analysis was used to create combined models of each DWI parameters based on statistical histogram metrics showing significant difference, and then the receiver operating characteristic (ROC) curves were plotted to compare the diagnostic performance for identifying significant LF and HIA. Areas under the ROC curve (AUCs) among DWI parameters were compared using the DeLong test.Results
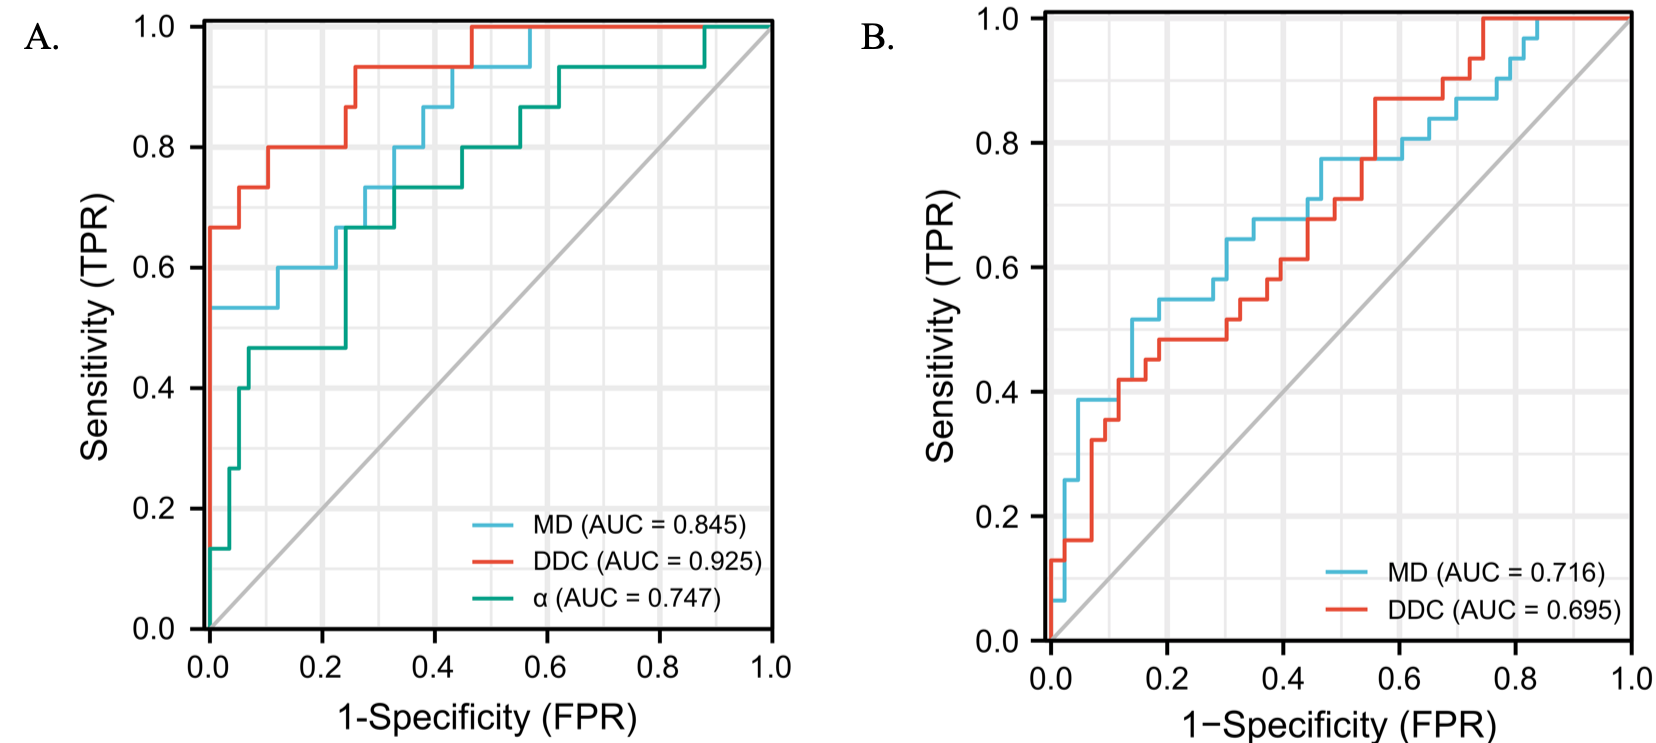
Correlations between the histogram metrics of MD, MK, DDC and α maps and the HIA are presented in Table 1. 90Percentile, Iq Range, MAD, Variance of MD, 90Percentile, Entropy, Iq Range, Max, MAD, Mean, Median, Min, Variance of DDC had negative correlation (r = -0.307 to -0.234, p=0.01 to 0.046), Uniformity of DDC map and 10Percentile Mean, Median, Min of α map showed positive correlation (r = 0.238 to 0.314, p=0.007 to 0.042) with HIA. Histogram metrics of α showed no correlation with HIA. Histogram metrics from all DWI maps showed no correlation with fibrosis. 90Percentile, Entropy, Maximum, MAD, Range, Uniformity, Variance of MD, Entropy, Uniformity of DDC were significantly different between no-significant and significant fibrosis (Table 2). Table 3 and Fig. 1 presented the diagnostic performance of all combined DWI models for separating significant HIA and LF from non-significant HIA and LF. Through logistic regression analysis, for the diagnosis of significant HIA, the combined model of DDC had significant higher AUCs than MD (p =0.035) and α (p = 0.040), although the MD was not significantly different from the α (p = 0.279). For significant fibrosis, the AUCs were 0.716 for MD map and 0.695 for DDC map, with no significant differences (p = 0.703).Discussion
Our study demonstrated that histogram metrics from DKI and SEM were correlated with hepatic inflammation, after established the combinatorial models with the meaningful histogram parameters, DDC from the SEM model showed the best diagnostic performance for identifying significant HIA, followed by MD and α. All metrics did not show a significant correlation with fibrosis, but MD and DDC could differentiate between S0-1 and ≥S2. These results indicates that the non-Gaussian model was more consistent with the real status of diffusion in liver fibrosis tissue likely due to the presence of various diffusion barriers such as inflammation, hepatocyte ballooning, and steatosis[3].The effect of fibrosis was weaker than inflammation on DWI models in this study, it is possible that inflammation may increase liver heterogeneity by increasing cellularity, cell size, or hydrostatic pressure, inflammation and fibrosis always coexist and interact with each other[4].Conclusion
Histogram quantitative parameters of DKI and SEM facilitate classification of the fibrosis stage as well as inflammatory activity grade in CLD.Acknowledgements
No acknowledgement found.References
[1] Besheer T, Elalfy H, Abd El-Maksoud M, et al. Diffusion-weighted magnetic resonance imaging and micro-RNA in the diagnosis of hepatic fibrosis in chronic hepatitis C virus[J]. World J Gastroenterol, 2019, 25(11): 1366-1377.
[2] Guo R, Yang S H, Lu F, et al. Evaluation of intratumoral heterogeneity by using diffusion kurtosis imaging and stretched exponential diffusion-weighted imaging in an orthotopic hepatocellular carcinoma xenograft model[J]. Quant Imaging Med Surg, 2019, 9(9): 1566-1578.
[3] Hu G, Liang W, Wu M, et al. Staging of rat liver fibrosis using monoexponential, stretched exponential and diffusion kurtosis models with diffusion weighted imaging- magnetic resonance[J]. Oncotarget, 2018, 9(2): 2357-2366.
[4] Song J, Xiangling Yu, Wenlong Song, et al. MRI-Based Radiomics Models Developed With Features of the Whole Liver and Right Liver Lobe: Assessment of Hepatic Inflammatory Activity in Chronic Hepatic Disease[J]. Journal of magnetic resonance imaging. 2020;52(6):1668-1678.
Figures