0062
Longitudinal MR Elastography and Proton Density Fat Fraction Measurements in Patients with Alcoholic and Nonalcoholic Fatty Liver Disease1Radiology, Mayo Clinic, Rochester, MN, United States, 2Gastroenterology and Hepatology, Mayo Clinic, Rochester, MN, United States
Synopsis
Keywords: Liver, Liver
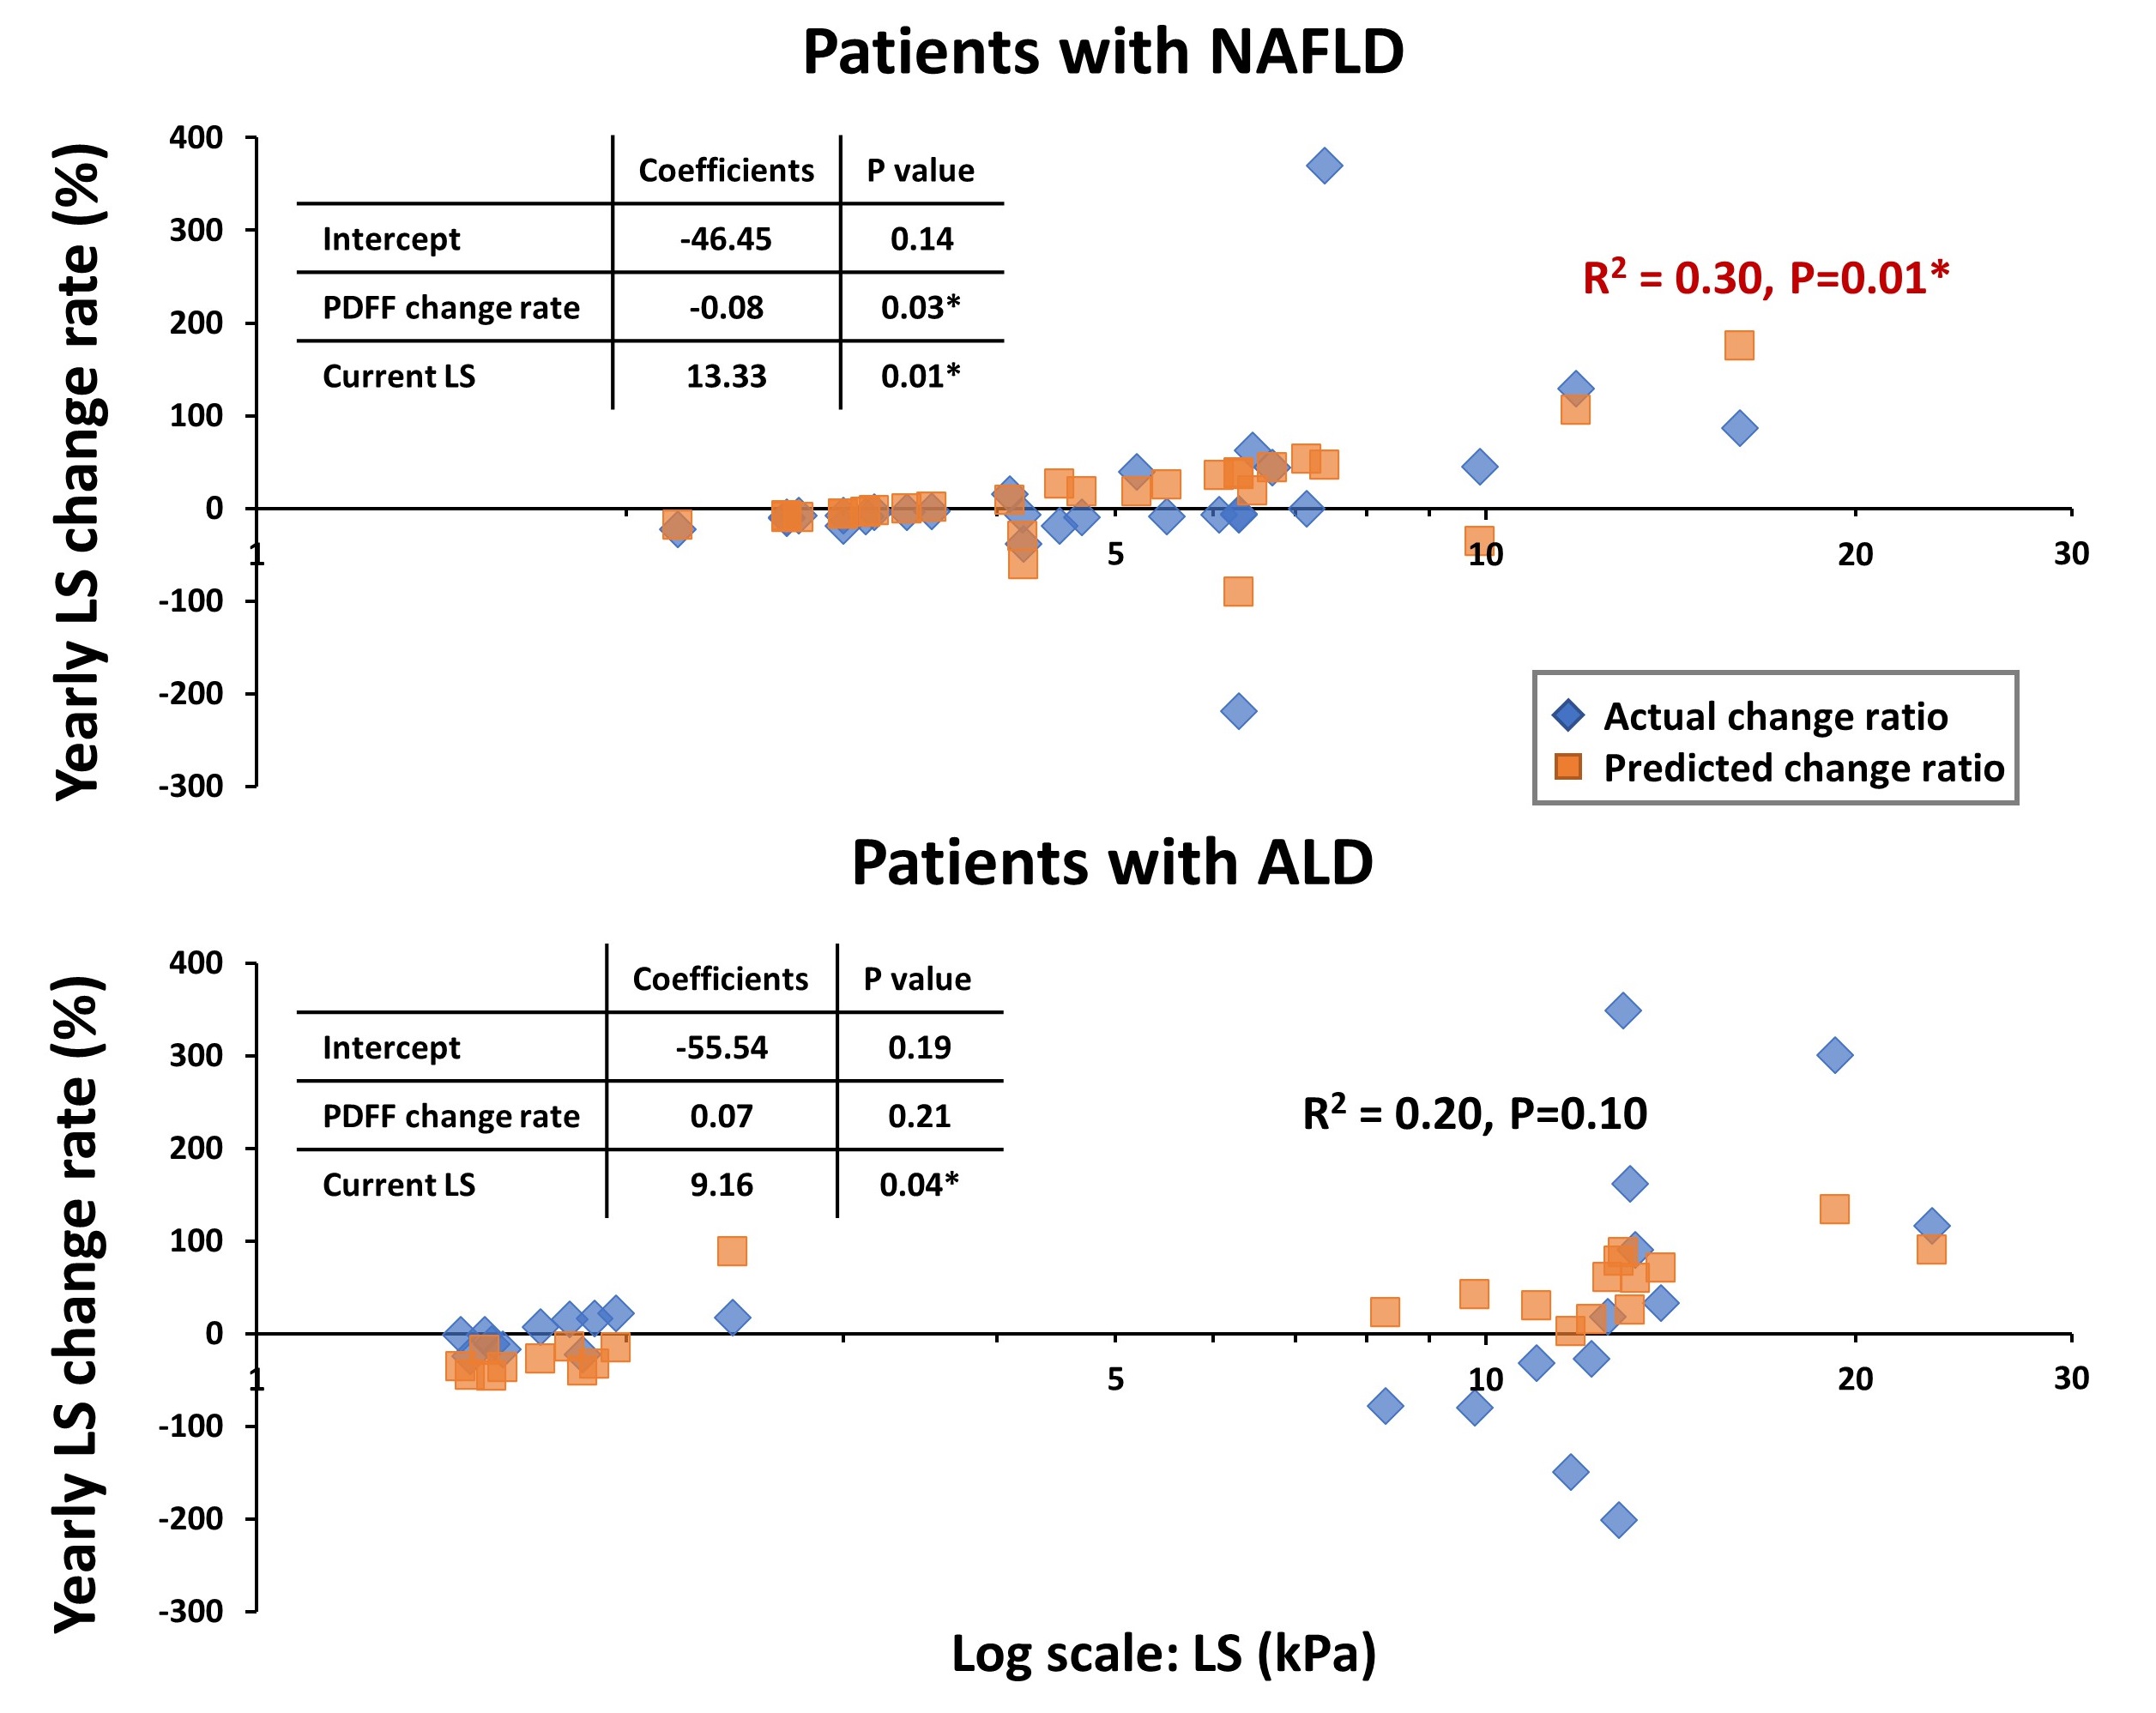
To evaluate MR imaging biomarkers in monitoring chronic liver diseases, we analyzed longitudinal MRE-assessed liver stiffness (LS) and proton density fat fraction (PDFF) measurements in 46 patients with alcoholic liver disease (ALD) or nonalcoholic fatty liver disease (NAFLD). Results demonstrated that yearly LS change rate was significantly associated with current LS and PDFF change rate in NAFLD, although with low correlation (R2=0.30, p=0.01). ALD patients had bidirectional changes in LS/PDFF change rate but not significant correlation (R2=0.20, p=0.10). We conclude that longitudinal MRE-LS and MRI-PDFF provide independent and complementary assessments of disease status and dynamic change in ALD and NAFLD.Introduction
Liver disease has been an epidemic health burden worldwide, with increasing morbidity and mortality (1). The most prevalent etiologies of chronic liver disease in developed countries are nonalcoholic fatty liver disease (NAFLD) (2) and alcoholic liver disease (ALD) (3), which have major lifestyle components and interact with host genetics, comorbid conditions, socioeconomic status (4). Although NAFLD and ALD have a similar pathological spectrum of disease progression, from simple steatosis to steatohepatitis, cirrhosis, and hepatocellular carcinoma (5), the epidemiological and clinical characteristics of these two diseases are different (6).With excessive alcohol intake, more than 95% of heavy drinkers (HD) develop hepatic steatosis, but only one-third of this population eventually develops a more severe form of alcoholic hepatitis (AH). Alcohol consumption and comorbid factors act in synergy to accelerate disease progression rate (7), which is 1.0-3.1% and 3.2-12.2% per year in ALD from simple steatosis and steatohepatitis to cirrhosis respectively, compared to 0-2.5% and 1.3-3.5% per year in NAFLD (6).
Numerous unknowns exist in the natural histories of ALD and NAFLD development and progression with varying genetic and social determinants. Therefore, accurately diagnosing disease status and timely monitoring disease progression are both critical for establishing models of care and individualized patient management. Recent investigations demonstrated that NAFLD activity and sequela fibrosis deposition could be accurately diagnosed with multiparametric Dixon MRI (8) and MRE (9-11), with promising potential for early inflammation detection (12). Unfortunately, little work has been done in ALD. Additionally, there is no consensus on a possible abbreviated liver MRI protocol and longitudinal follow-up strategy in patients with ALD or NAFLD or co-existing etiologies. In this study, we aimed to compare longitudinal MRE and MRI measurements and their yearly change rates (i.e., progression speed) in ALD and NAFLD to explore natural disease histories and clinical implications.
Methods
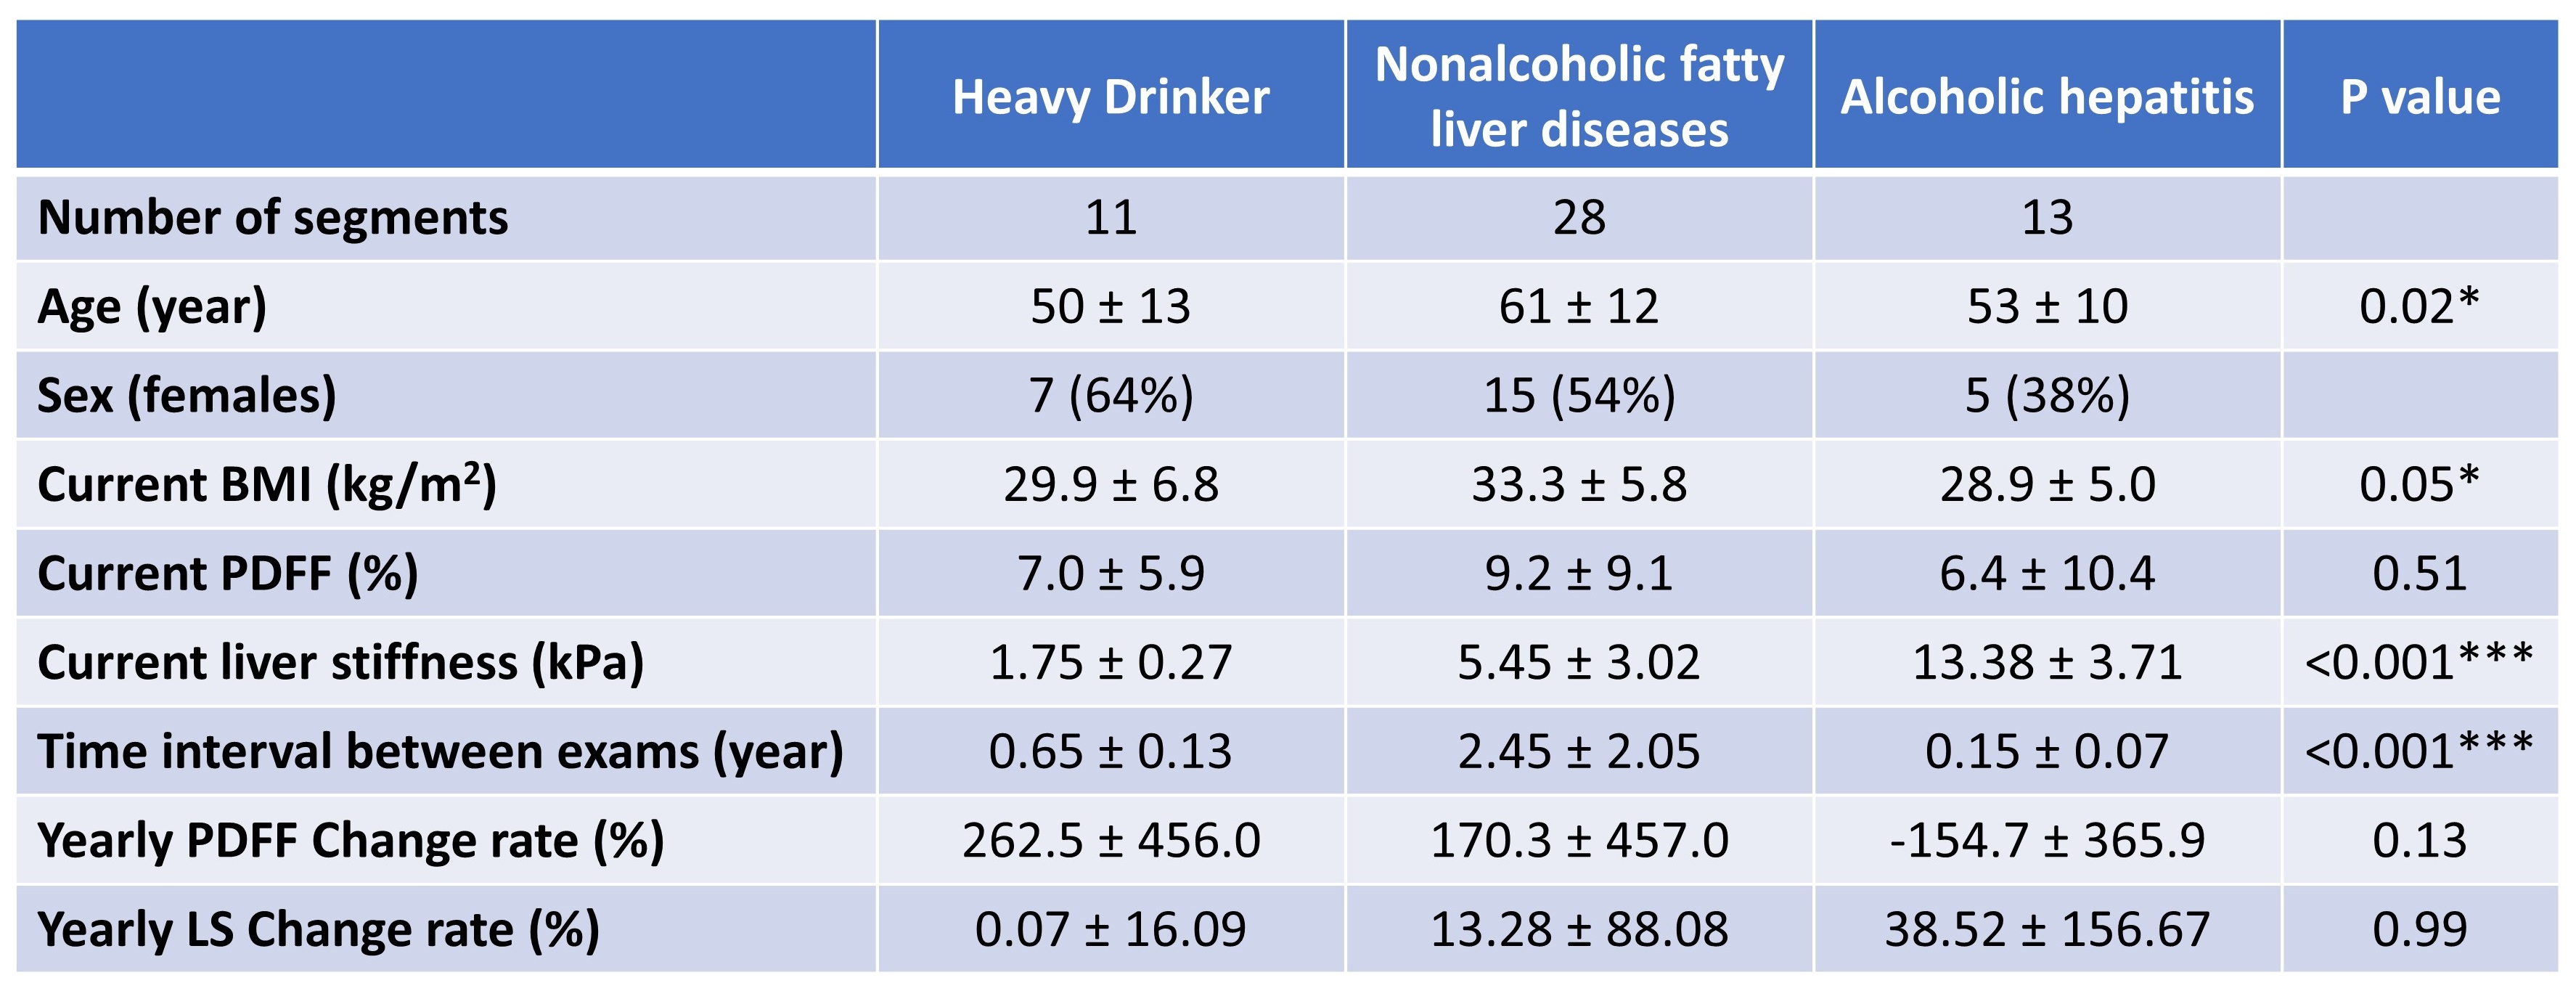
This study enrolled 46 participants in total, including HD (N=11, ALD controls for AH), patients with NAFLD (N=28), and patients with AH (N=7). All participants had at least two MRE/MRI exams without treatment between exams. The yearly change rate was calculated by dividing the absolute change by the baseline measurement and the time interval for every adjacent time segment (N=52). NAFLD patients were retrospectively selected from our previous study (13), with a significant LS change determined by a Z-score greater than 1.96. The HD and AH patients were prospectively enrolled with clinical diagnoses according to the National Institute on Alcohol Abuse and Alcoholism (NIAAA) pan-consortia (14). MRE-assessed liver stiffness (LS, 60Hz) was calculated from manually drawn ROIs covering liver tissue with sufficient wave propagation. The hepatic proton-density fat fraction (PDFF) was calculated from oval ROIs drawn in 9 segments from 6-point Dixon MRI (15). We performed Kruskal-Wallis tests for differences between groups and generalized linear regressions for yearly LS change rate. A significance level of 0.05 was used, and goodness of fit was assessed by R2 value as: poor ≤0.3, moderate 0.3-0.5, good 0.5-0.7, excellent ≥0.7.Results
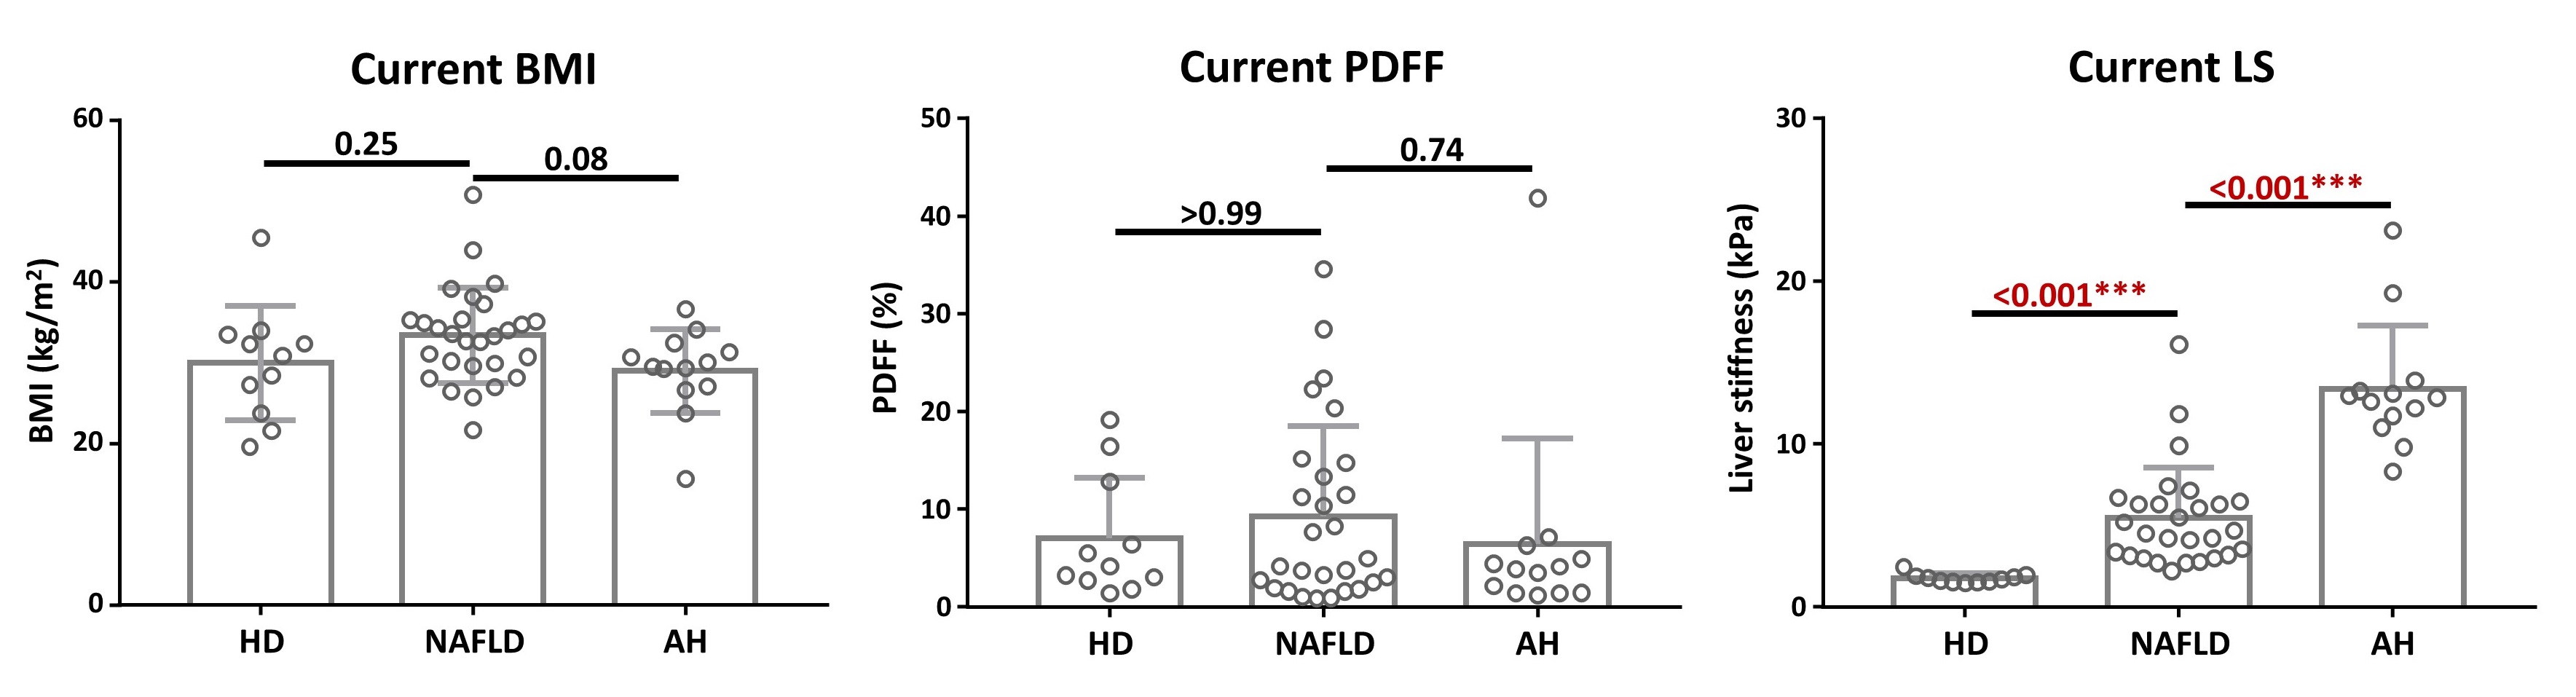
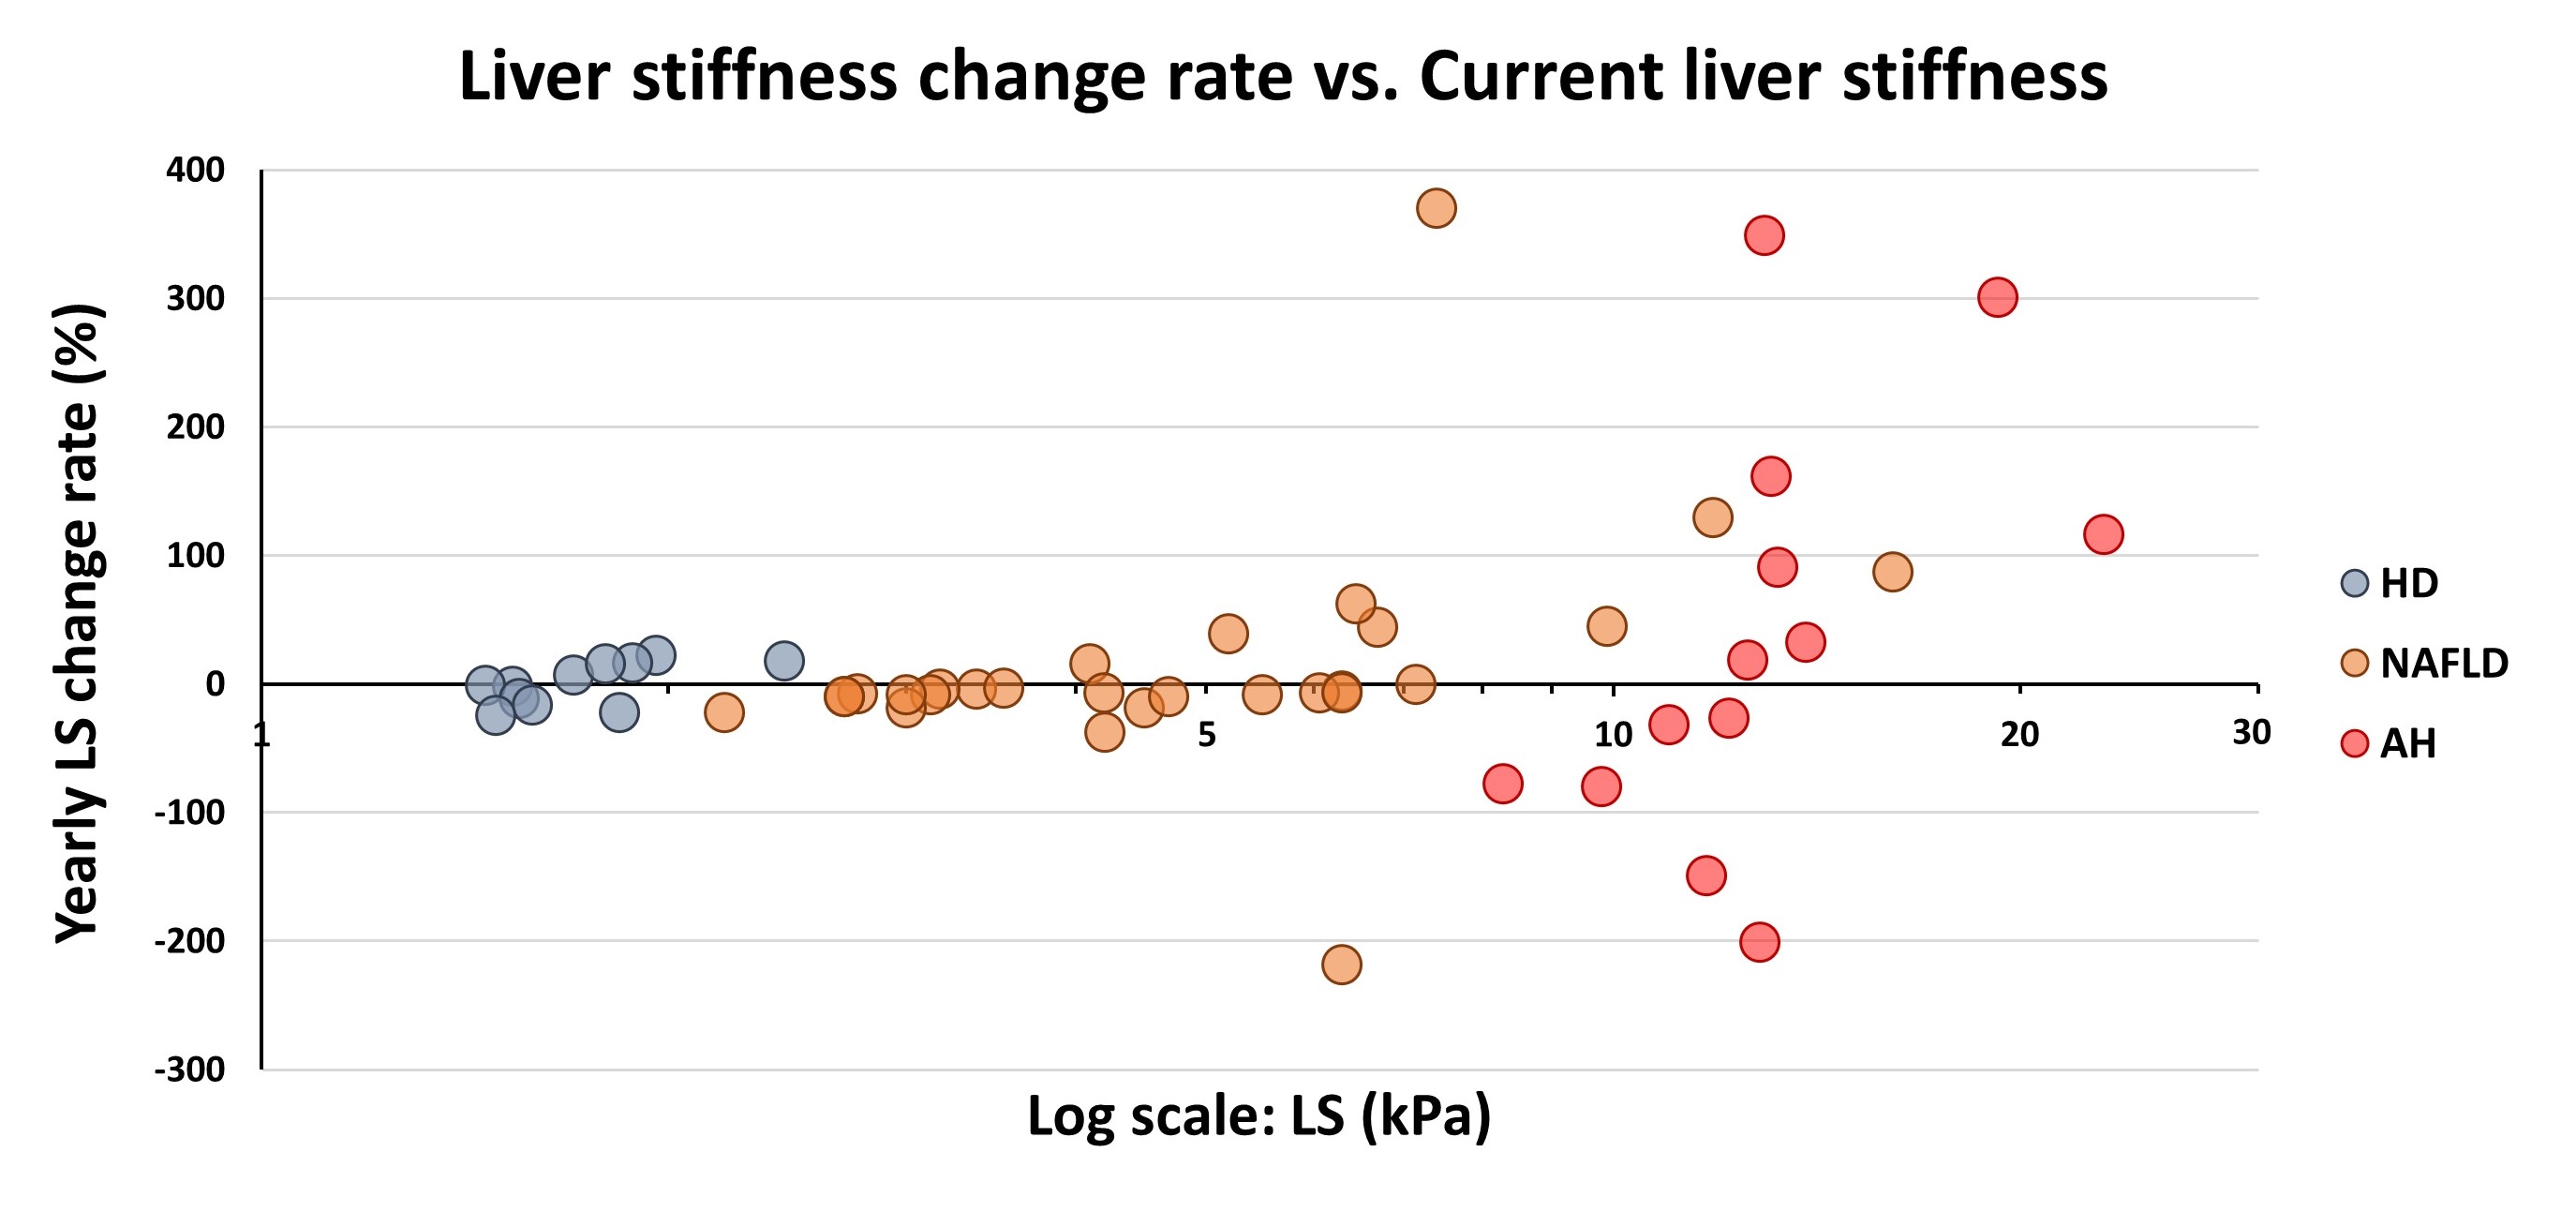
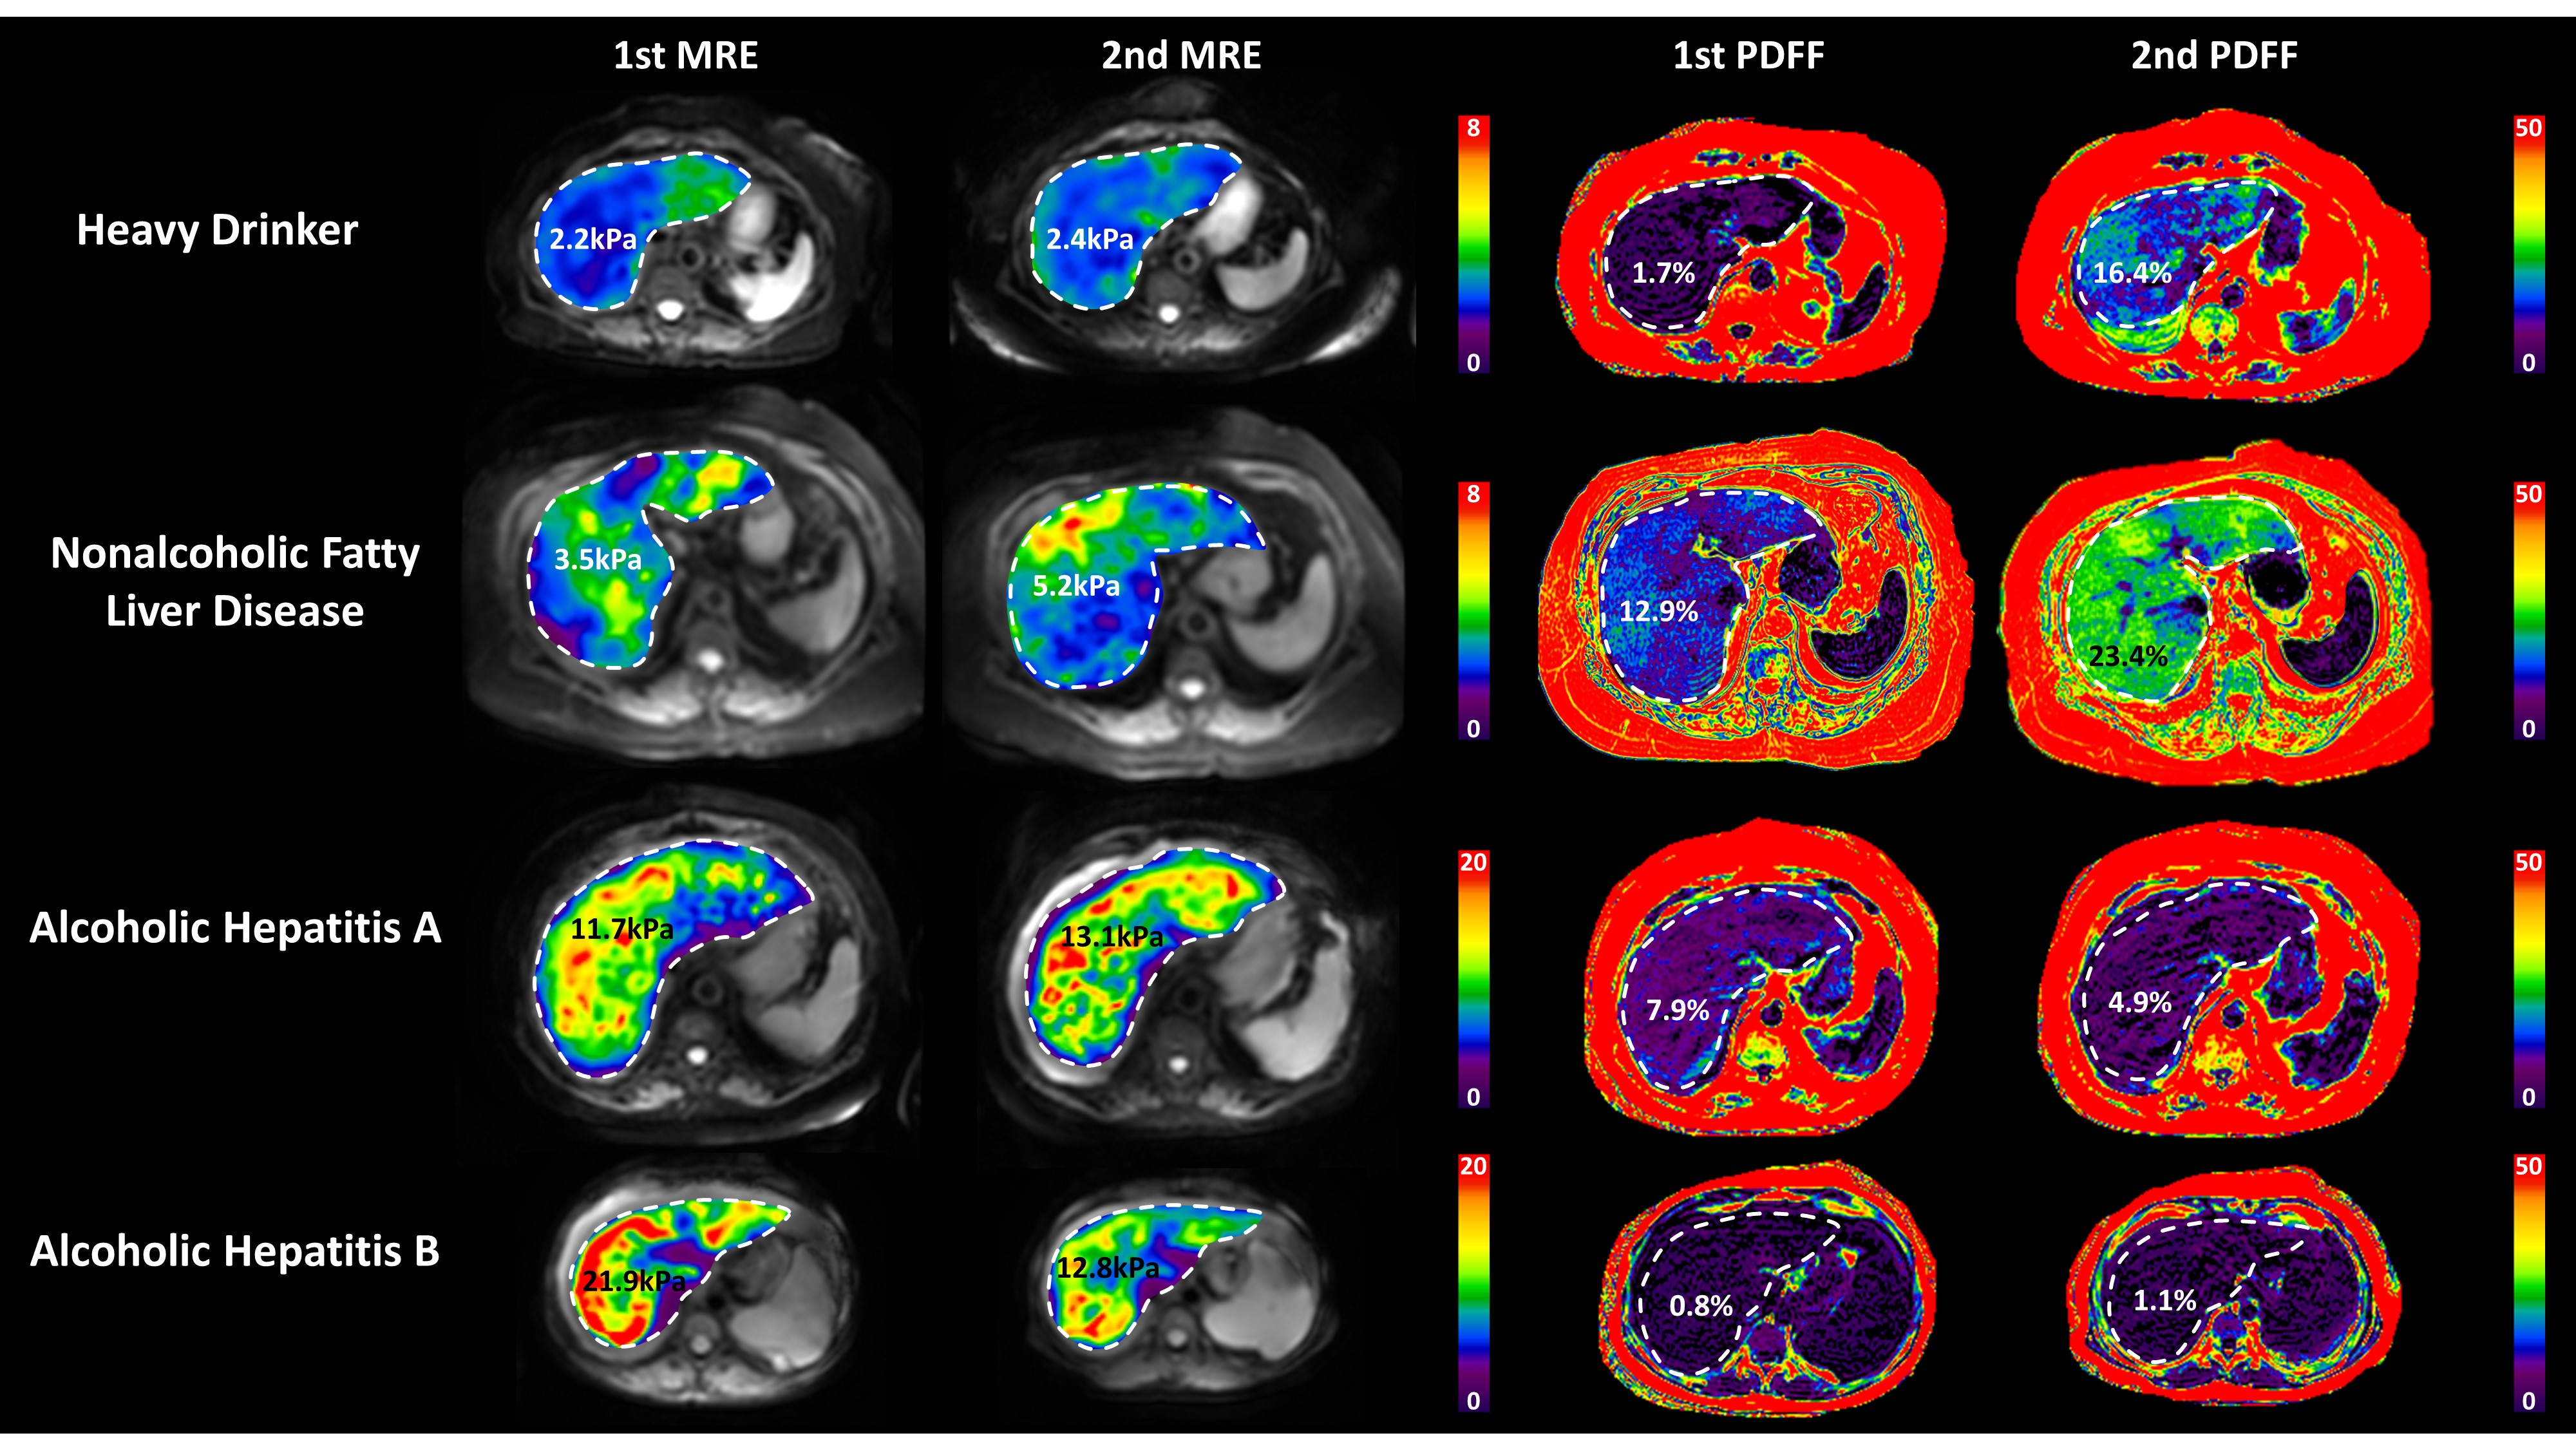
Patient characteristics and group comparisons are listed in Table1 and Figure1, respectively. Compared with HD, LS increased significantly in NAFLD and AH groups. Although yearly LS change rate did not show significant differences between groups, AH patients had the most variation (Figure2). PDFF increased in HD even when LS was in the normal range, while in the NAFLD patients, both PDFF and LS elevated with disease progression. In AH patients, PDFF did not change much, while LS changed bi-directionally (Figure3). With two independent variables (i.e., LS and yearly PDFF change rate), linear regressions of progression rate (i.e., yearly LS change rate) had significant associations but poor correlation in NAFLD (R2=0.30, p=0.01), and not significant correlation in ALD (R2=0.20, p=0.10) (Figure4).Discussion
LS is positively correlated with hepatic fibrosis (16), inflammation (12), and portal hypertension (17). In this study, patients with AH showed large and bi-directional variations in the yearly LS change rate, which may indicate the acute inflammation-driven condition of AH with severe complications of portal hypertension and alcohol cessation. Patients with NAFLD showed mostly stable and slowly progressive yearly LS change rate, as generally expected (18).PDFF is positively correlated with hepatic steatosis (8). At the early stage of simple steatosis, PDFF increased with disease progression in both ALD and NAFLD. However, in patients with cirrhosis, steatosis diminishes due to less viable hepatocytes. This explains the poor fit (R2 = 0.30) of a linear regression model in NAFLD and the non-significant linear correlation in ALD. Nonlinear regressions may be necessary to identify the causes of these bi-directional changes (e.g., burn-out hepatocytes or acute phase change) and to predict disease progression/regression direction and rate in ALD and NAFLD.
Conclusion
Our pilot study indicated that dynamic fibrosis progression rate could not be accurately determined by static fibrosis extent (current LS) and dynamic steatosis change rate (yearly PDFF change rate) in both ALD and NAFLD. Longitudinal MRE-LS and MRI-PDFF may provide independent and complementary assessments for monitoring disease severity, evolvement direction and progression rate.Acknowledgements
This study is funded by NIH grants EB017197 (M.Y.), EB001981(R.L.E.), AA26887 (V.H.S., & M.Y.), DK115594 (A.M.A.), DK059615 (V.H.S.), and DoD grant W81XWH-19-1-0583-01 (M.Y.).References
1. Asrani SK, Devarbhavi H, Eaton J, Kamath PS. Burden of liver diseases in the world. Journal of hepatology 2019;70(1):151-171. doi: 10.1016/j.jhep.2018.09.014
2. Kanwal F, Shubrook JH, Adams LA, Pfotenhauer K, Wai-Sun Wong V, Wright E, Abdelmalek MF, Harrison SA, Loomba R, Mantzoros CS, Bugianesi E, Eckel RH, Kaplan LM, El-Serag HB, Cusi K. Clinical Care Pathway for the Risk Stratification and Management of Patients With Nonalcoholic Fatty Liver Disease. Gastroenterology 2021;161(5):1657-1669. doi: 10.1053/j.gastro.2021.07.049
3. Wong T, Dang K, Ladhani S, Singal AK, Wong RJ. Prevalence of Alcoholic Fatty Liver Disease Among Adults in the United States, 2001-2016. Jama 2019;321(17):1723-1725. doi: 10.1001/jama.2019.2276
4. Acharya C, Bajaj JS. Chronic Liver Diseases and the Microbiome-Translating Our Knowledge of Gut Microbiota to Management of Chronic Liver Disease. Gastroenterology 2021;160(2):556-572. doi: 10.1053/j.gastro.2020.10.056
5. Ginès P, Krag A, Abraldes JG, Solà E, Fabrellas N, Kamath PS. Liver cirrhosis. Lancet (London, England) 2021;398(10308):1359-1376. doi: 10.1016/s0140-6736(21)01374-x
6. Toshikuni N, Tsutsumi M, Arisawa T. Clinical differences between alcoholic liver disease and nonalcoholic fatty liver disease. World journal of gastroenterology 2014;20(26):8393-8406. doi: 10.3748/wjg.v20.i26.8393
7. Gao B, Bataller R. Alcoholic liver disease: pathogenesis and new therapeutic targets. Gastroenterology 2011;141(5):1572-1585. doi: 10.1053/j.gastro.2011.09.002
8. Troelstra MA, Witjes JJ, van Dijk AM, Mak AL, Gurney-Champion O, Runge JH, Zwirs D, Stols-Gonçalves D, Zwinderman AH, Ten Wolde M, Monajemi H, Ramsoekh S, Sinkus R, van Delden OM, Beuers UH, Verheij J, Nieuwdorp M, Nederveen AJ, Holleboom AG. Assessment of Imaging Modalities Against Liver Biopsy in Nonalcoholic Fatty Liver Disease: The Amsterdam NAFLD-NASH Cohort. Journal of magnetic resonance imaging : JMRI 2021. doi: 10.1002/jmri.27703
9. Singh S, Venkatesh SK, Wang Z, Miller FH, Motosugi U, Low RN, Hassanein T, Asbach P, Godfrey EM, Yin M, Chen J, Keaveny AP, Bridges M, Bohte A, Murad MH, Lomas DJ, Talwalkar JA, Ehman RL. Diagnostic performance of magnetic resonance elastography in staging liver fibrosis: a systematic review and meta-analysis of individual participant data. Clinical gastroenterology and hepatology : the official clinical practice journal of the American Gastroenterological Association 2015;13(3):440-451 e446. doi: 10.1016/j.cgh.2014.09.046
10. Allen AM, Shah VH, Therneau TM, Venkatesh SK, Mounajjed T, Larson JJ, Mara KC, Schulte PJ, Kellogg TA, Kendrick ML, McKenzie TJ, Greiner SM, Li J, Glaser KJ, Wells ML, Chen J, Ehman RL, Yin M. The Role of Three-Dimensional Magnetic Resonance Elastography in the Diagnosis of Nonalcoholic Steatohepatitis in Obese Patients Undergoing Bariatric Surgery. Hepatology 2020;71(2):510-521. doi: 10.1002/hep.30483
11. Imajo K, Kessoku T, Honda Y, Tomeno W, Ogawa Y, Mawatari H, Fujita K, Yoneda M, Taguri M, Hyogo H, Sumida Y, Ono M, Eguchi Y, Inoue T, Yamanaka T, Wada K, Saito S, Nakajima A. Magnetic Resonance Imaging More Accurately Classifies Steatosis and Fibrosis in Patients With Nonalcoholic Fatty Liver Disease Than Transient Elastography. Gastroenterology 2016;150(3):626-637.e627. doi: 10.1053/j.gastro.2015.11.048
12. Li J, Allen AM, Shah VH, Manduca A, Ehman RL, Yin M. Longitudinal Changes in MR Elastography-based Biomarkers in Obese Patients Treated with Bariatric Surgery. Clin Gastroenterol Hepatol 2021. doi: 10.1016/j.cgh.2021.10.033
13. Gidener T, Dierkhising RA, Mara KC, Therneau TM, Venkatesh SK, Ehman RL, Yin M, Allen AM. Change in serial liver stiffness measurement by magnetic resonance elastography and outcomes in NAFLD. Hepatology 2022. doi: 10.1002/hep.32594
14. Crabb DW, Bataller R, Chalasani NP, Kamath PS, Lucey M, Mathurin P, McClain C, McCullough A, Mitchell MC, Morgan TR, Nagy L, Radaeva S, Sanyal A, Shah V, Szabo G. Standard Definitions and Common Data Elements for Clinical Trials in Patients With Alcoholic Hepatitis: Recommendation From the NIAAA Alcoholic Hepatitis Consortia. Gastroenterology 2016;150(4):785-790. doi: 10.1053/j.gastro.2016.02.042
15. Bannas P, Kramer H, Hernando D, Agni R, Cunningham AM, Mandal R, Motosugi U, Sharma SD, Munoz del Rio A, Fernandez L, Reeder SB. Quantitative magnetic resonance imaging of hepatic steatosis: Validation in ex vivo human livers. Hepatology 2015;62(5):1444-1455. doi: 10.1002/hep.28012
16. Chen J, Allen AM, Therneau TM, Chen J, Li J, Hoodeshenas S, Chen J, Lu X, Zhu Z, Venkatesh SK, Song B, Ehman RL, Yin M. Liver stiffness measurement by magnetic resonance elastography is not affected by hepatic steatosis. Eur Radiol 2021. doi: 10.1007/s00330-021-08225-w
17. Navin PJ, Gidener T, Allen AM, Yin M, Takahashi N, Torbenson MS, Kamath PS, Ehman RL, Venkatesh SK. The Role of Magnetic Resonance Elastography in the Diagnosis of Noncirrhotic Portal Hypertension. Clinical gastroenterology and hepatology : the official clinical practice journal of the American Gastroenterological Association 2020;18(13):3051-3053.e3052. doi: 10.1016/j.cgh.2019.10.018
18. Powell EE, Wong VW, Rinella M. Non-alcoholic fatty liver disease. Lancet (London, England) 2021;397(10290):2212-2224. doi: 10.1016/s0140-6736(20)32511-3
Figures