0061
Assessment of Inflammation and Spatial Heterogeneity for Nonalcoholic Fatty Liver Disease in Mice Based on Corrected T11the First Affiliated Hospital of Sun Yet-sen University, Guangzhou, China, 2Philips Healthcare, Guangzhou, China
Synopsis
Keywords: Liver, Quantitative Imaging
Corrected T1 (cT1) is potential to be a novel imaging biomarker, which was based on T1 mapping corrected for iron content. The results of this study showed the high correlation between cT1 value and NAFLD activity, without correlation with fibrosis. There was high accuracy of cT1 to identify normal liver and liver with NAFLD, as well as mild and severe NAFLD. The severer inflammation, the higher heterogeneity of cT1 mapping. Thus, cT1 may be used for evaluating liver inflammation of patient with NAFLD, especially for those without severe fibrosis, and may evaluate heterogeneity further.Introduction
Nonalcoholic fatty liver disease (NAFLD) has constituted to the increasing burden of chronic liver disease worldwide1. Nonalcoholic steatohepatitis (NASH), a stage of NAFLD characterized by steatosis with inflammation and hepatocellular injury, progressed to cirrhosis and various liver-related complications, which is reversible at early stage2. Thus, a sensitive method for early diagnosis was essential to identify NASH.Assessing the severity of NASH depended on liver biopsy currently, which was invasive with sampling bias3. cT1, an MRI technology, may contribute to quantification of NASH, which was non-invasive and providing comprehensive images of the whole liver. Combined T2* which could reflect the iron content, the shortening effect of iron on T1 was corrected as cT14, which could reflect the severity of fibrosis and inflammation together5-6. However, the relative contribution to inflammatory activity remained unclear5, 7.
Moreover, spatial heterogeneity of NASH may affect the diagnostic property of liver biopsy8 and be related to the risk of disease progression9. MRI images with histogram analysis may be helpful to analyze the inflammatory heterogeneity of NASH and provide additional information for prognostic assessment.
The objective of this work was to investigate the ability of cT1 to quantify the inflammatory activity in NAFLD and the effective factors. Furthermore, heterogeneity of NAFLD was explored by histogram characters of cT1.
Methods
70 male 8-week-old C57BL/6J mice were randomly established as NAFLD model (n=40), NAFLD-related liver cirrhosis model (n=20), and normal control (n=10). T1 map, and T2* map was acquired by a 3.0 T MR scanner (Ingenia CX, Philips Healthcare), and cT1 map was obtained through post-processing algorithms which was corrected the effect of iron on T1 by T2*. The value was measured at the slice with the maximum liver area. Histogram characters of cT1 was acquired by FAE soft. Pathological change of left and right liver lobe was assessed by NASH-CRN scoring system and dived them to normal group, simple nonalcoholic fatty liver (NAFL) group (0<NAS<4) and NASH group (NAS≥4). Spearman correlation analysis and partial correlation analysis were used to evaluate the correlation. Receiver operator characteristic curve (ROC) was used to analyze the diagnostic performance.Results
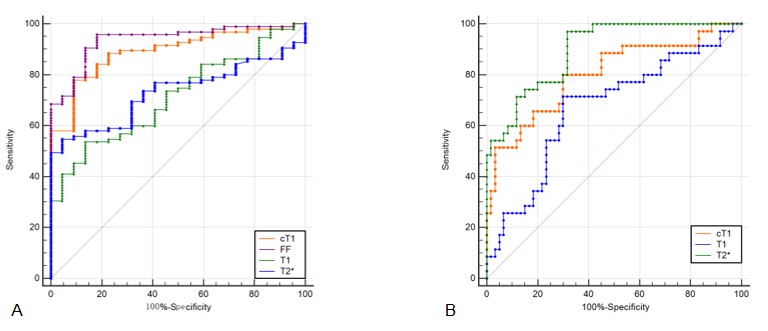
Typical MR images and histology images was shown in Figure 1. cT1 value was highly correlated with NAS (NAFLD activity score) (r=0.75, P<0.001), but not correlated with fibrosis score when adjusted by NAS (r=-0.14, P=0.15). For all pairwise comparisons between groups, only difference of cT1 value was statistically significant (P<0.001). The average of cT1 was 783.21±6.03 in normal group, 842.65±6.77 in NAFL group and 915.5±11.08 in NASH group, respectively.After ROC analyze (Figure 2), the AUC of cT1 to distinguish normal and NAFLD was 0.891 (cut-off value 811.68ms, sensitivity 77.89%, specificity 90.91%), which was significantly higher than that of T1 (AUC=0.712) or T2*(AUC=0.731), and the difference in AUC between cT1 and FF values was not statistically significant (P=0.28). The AUC of cT1 values to distinguish NAFL and NASH were 0.802 (cut-off value 860.58ms, sensitivity 80.00%, specificity 70.00%), higher than that of T1 value (AUC=0.670), and the difference in AUC between cT1 and T2* values was not statistically significant (P = 0.07).
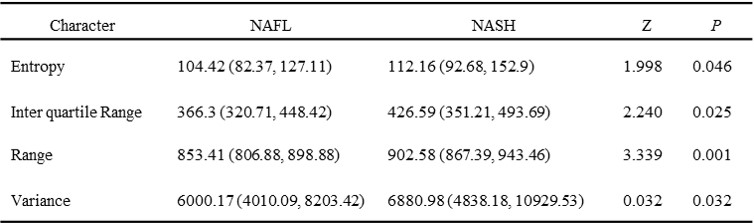
Analyzing histogram features of cT1(Table 1), the entropy, interquartile range, range and variance were statistically different between NAFL and NASH group(P<0.05).
Discussion
The results of this study showed that cT1 values were highly correlated with NAS, indicating that cT1 values are suitable as an alternate to biopsy and can play a part in monitoring disease changes during the treatment and screening. In the present study, cT1 values did not correlate with the degree of fibrosis. Inflammation and fibrosis often co-exist in liver with NAFLD, both of which can cause increase of T1, while iron overload often correlated with fibrosis. Thus, the effected of mild fibrosis may not be contributed to cT1 values at least, which may useful for monitoring patients with NAFLD at early stage.By analyzing the histogram characteristics of cT1, the results showed that with higher NAS, the spatial heterogeneity of lesions was higher. Therefore, histogram parameters of cT1 may be able to reflect heterogeneity, and may predict the prognosis after more study.
Conclusion
cT1 could be used to evaluate the inflammatory activity of NAFLD mice without affection of fibrosis, which may be used for evaluating liver inflammation of patient with NAFLD, especially for those may be reversed timely without severe fibrosis. Distribution of NAFLD mouse liver lesions is heterogeneous, and the higher degree of inflammation, the higher heterogeneity of cT1 mapping, which may be contributed to evaluate NASH precisely.Acknowledgements
No acknowledgement found.References
1. Younossi Z, Tacke F, Arrese M, et al. Global Perspectives on Nonalcoholic Fatty Liver Disease and Nonalcoholic Steatohepatitis. Hepatology (Baltimore, Md.). 2019;69:2672-2682.
2. Anstee QM, Reeves HL, Kotsiliti E, Govaere O, Heikenwalder M. From NASH to HCC: current concepts and future challenges. Nat Rev Gastro Hepat. 2019;16:411-428.
3. Ratziu V, Charlotte F, Heurtier A, et al. Sampling Variability of Liver Biopsy in Nonalcoholic Fatty Liver Disease. Gastroenterology. 2005;128:1898-1906.
4. Banerjee R, Pavlides M, Tunnicliffe EM, et al. Multiparametric magnetic resonance for the non-invasive diagnosis of liver disease. J Hepatol. 2014;60:69-77.
5. Pavlides M, Banerjee R, Tunnicliffe EM, et al. Multiparametric magnetic resonance imaging for the assessment of non-alcoholic fatty liver disease severity. Liver Int. 2017;37:1065-1073.
6. Andersson A, Kelly M, Imajo K, et al. Clinical Utility of Magnetic Resonance Imaging Biomarkers for Identifying Nonalcoholic Steatohepatitis Patients at High Risk of Progression: A Multicenter Pooled Data and Meta-Analysis. Clin Gastroenterol H. 2021.
7. Eddowes PJ, McDonald N, Davies N, et al. Utility and cost evaluation of multiparametric magnetic resonance imaging for the assessment of non-alcoholic fatty liver disease. Aliment Pharm Ther. 2018;47:631-644.
8. Regev A, Berho M, Jeffers LJ, et al. Sampling error and intraobserver variation in liver biopsy in patients with chronic HCV infection. The American journal of gastroenterology. 2002;97:2614-2618.
9. Steinman JB, Salomao MA, Pajvani UB. Zonation in NASH – A key paradigm for understanding pathophysiology and clinical outcomes. Liver Int. 2021;41:2534-2546.9. Steinman JB, Salomao MA, Pajvani UB. Zonation in NASH – A key paradigm for understanding pathophysiology and clinical outcomes. Liver Int. 2021;41:2534-2546.
Figures
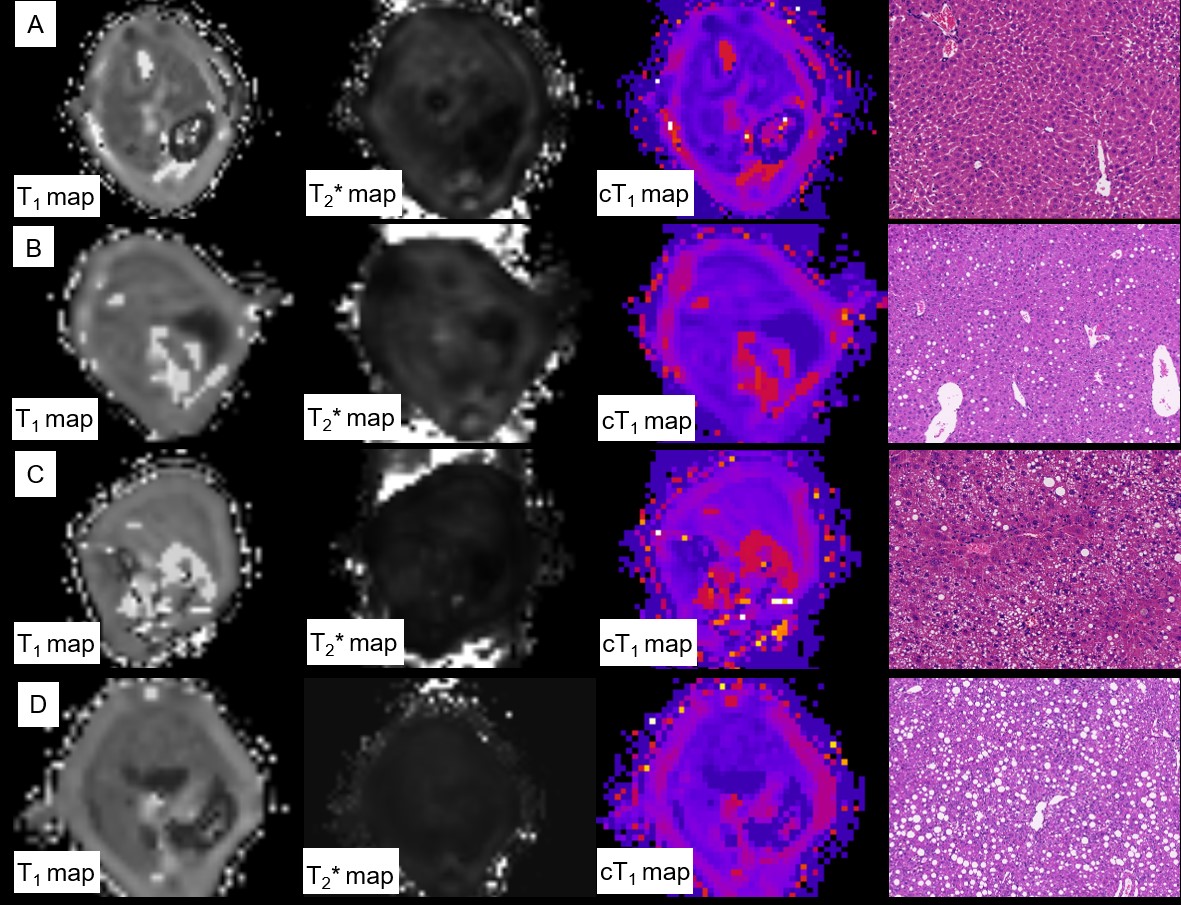
Figure.1 Typical MR images and histology images from mice with multiple severity. A: normal liver, cT1 of left lobe was 787.21ms, NAS=0. B. liver with NAFL, cT1 of left lobe was 807.89ms, NAS=3, fibrosis stage was 1a. C. liver with NASH and mild fibrosis, cT1 of left lobe was 933.89ms, NAS=4, fibrosis stage was 1b; D. liver with NASH and fibrosis, cT1 of left lobe was 9733.77ms, NAS=5, fibrosis stage was 2.