0060
Free-breathing Isotropic resolution self-Navigated B1-insensitive whOle liver simultaneous T1 and T2 mapping (FINO)1Department of Diagnostic and Interventional Radiology, Technical University of Munich, Munich, Germany, 2Philips Healthcare, Hamburg, Germany
Synopsis
Keywords: Liver, Relaxometry
Volumetric T1 and T2 relaxation mapping is of interest in the characterization of diffuse and oncological liver diseases. Current methods for free-breathing whole-liver relaxation mapping have primarily been optimized to quantify a water-specific T1, are restricted to large voxel sizes in the feet-head-direction, and are not compatible with self-navigation. The present work proposes a novel methodology for Free-breathing Isotropic resolution self-Navigated B1-insensitive whOle-liver simultaneous water-specific T1 and T2 mapping (FINO). Phantom results illustrate the accuracy of the method and in vivo results demonstrate the feasibility of whole-liver water-specific T1 and T2 mapping at an isotropic resolution of 3mm in 6min.Introduction
Liver T1 and T2 relaxation times have been shown to be promising biomarkers for characterizing and staging of diffuse and oncological liver diseases1,2. Conventional T1 and T2 mapping methods (e.g., Modified Look-Locker inversion recovery (MOLLI) for T1 mapping) usually rely on single-slice acquisitions in combination with breath-holds and may be confounded by the presence of fat. Recently, methods have been proposed to acquire volumetric water-specific T1 maps (T1w) of the whole-liver during a free-breathing acquisition3,4. These methods usually rely on a motion-robust radial stack-of-stars k-space trajectory and perform a respiratory motion-informed reconstruction using an external motion sensor3 or additional MR navigator signals4. It has been also shown that transmit B1 inhomogeneity effects have to be corrected for T1 mapping at 3T5,6,7.While previous works mainly focus on the quantification of T1w or the simultaneous quantification of T1w, PDFF and R2*, T2 mapping has been shown to be of interest for staging of liver fibrosis2. The combination of T2 mapping with radial stack-of-stars acquisition schemes used for liver T1 mapping relying on a Look-Locker scheme acquiring many inversion contrasts might not be straightforward. Furthermore, the Look-Locker acquisition scheme combined with a stack-of-stars trajectory restricts the resolution in the partition direction and impedes the self-navigation ability of the trajectory due to the varying contrast along kz-projections3.
The present work presents a new methodology for Free-breathing Isotropic resolution self-Navigated whOle-liver simultaneous T1w and T2w mapping (FINO).
Methods
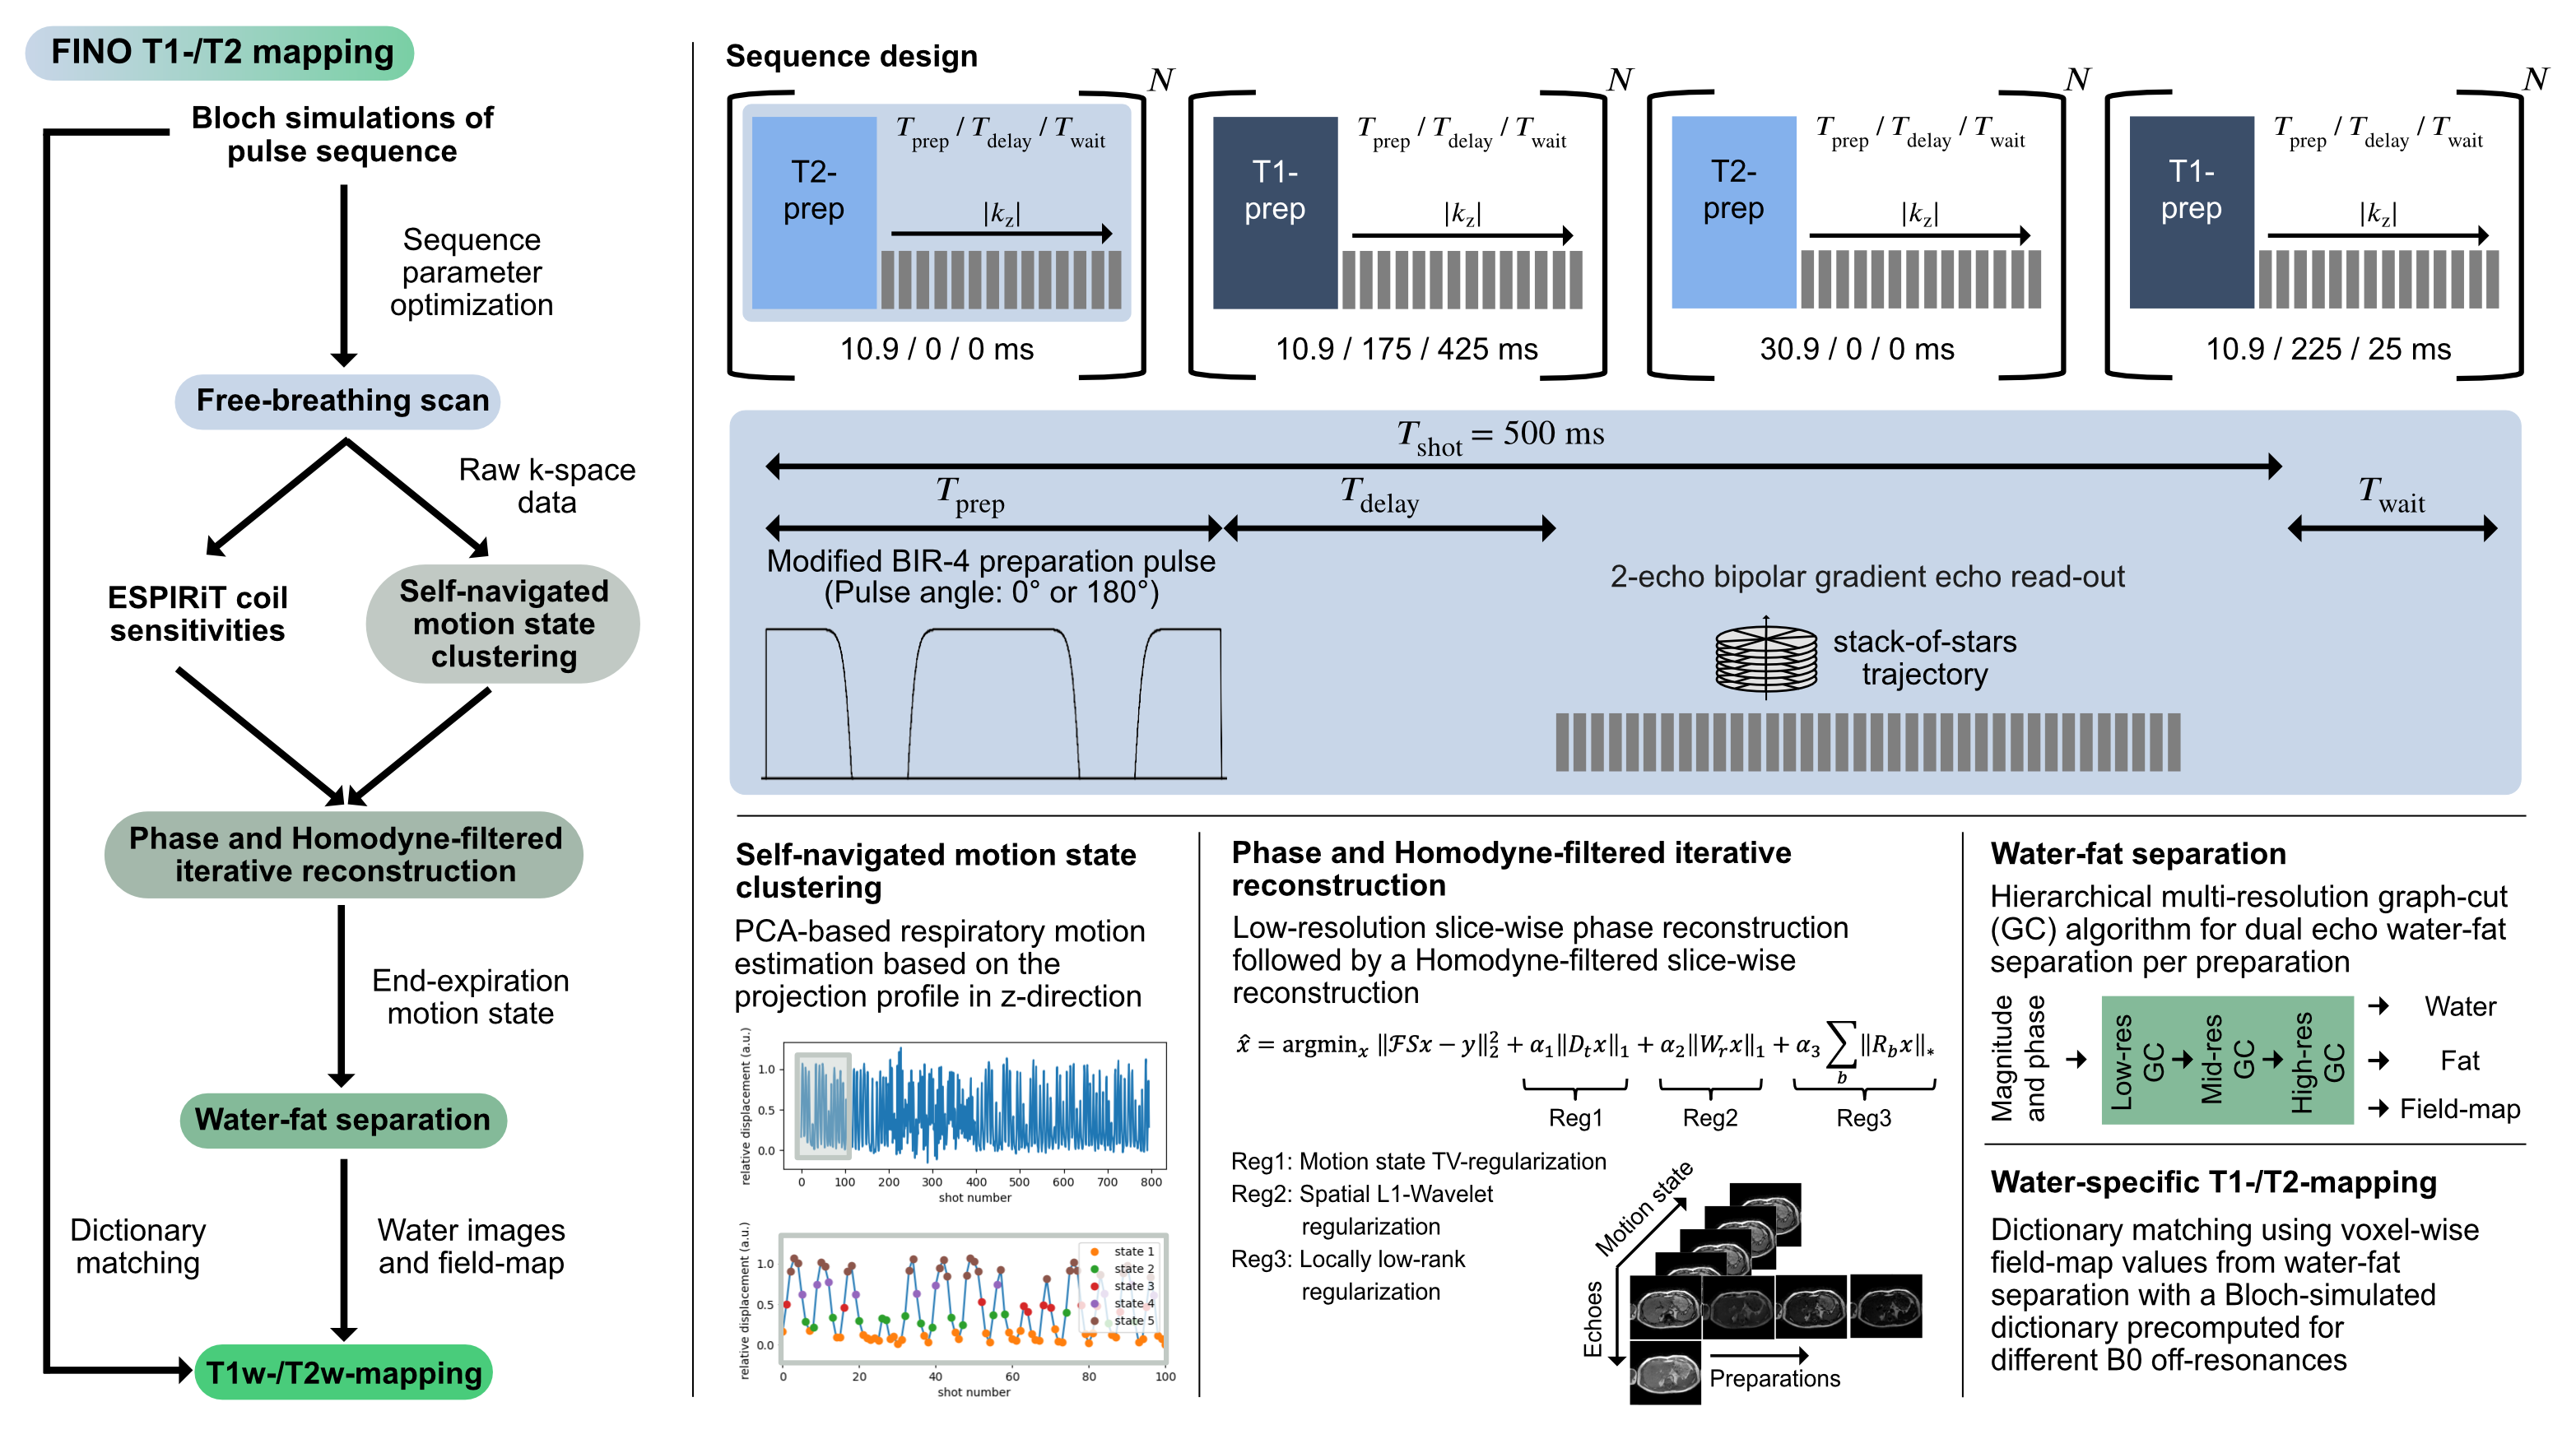
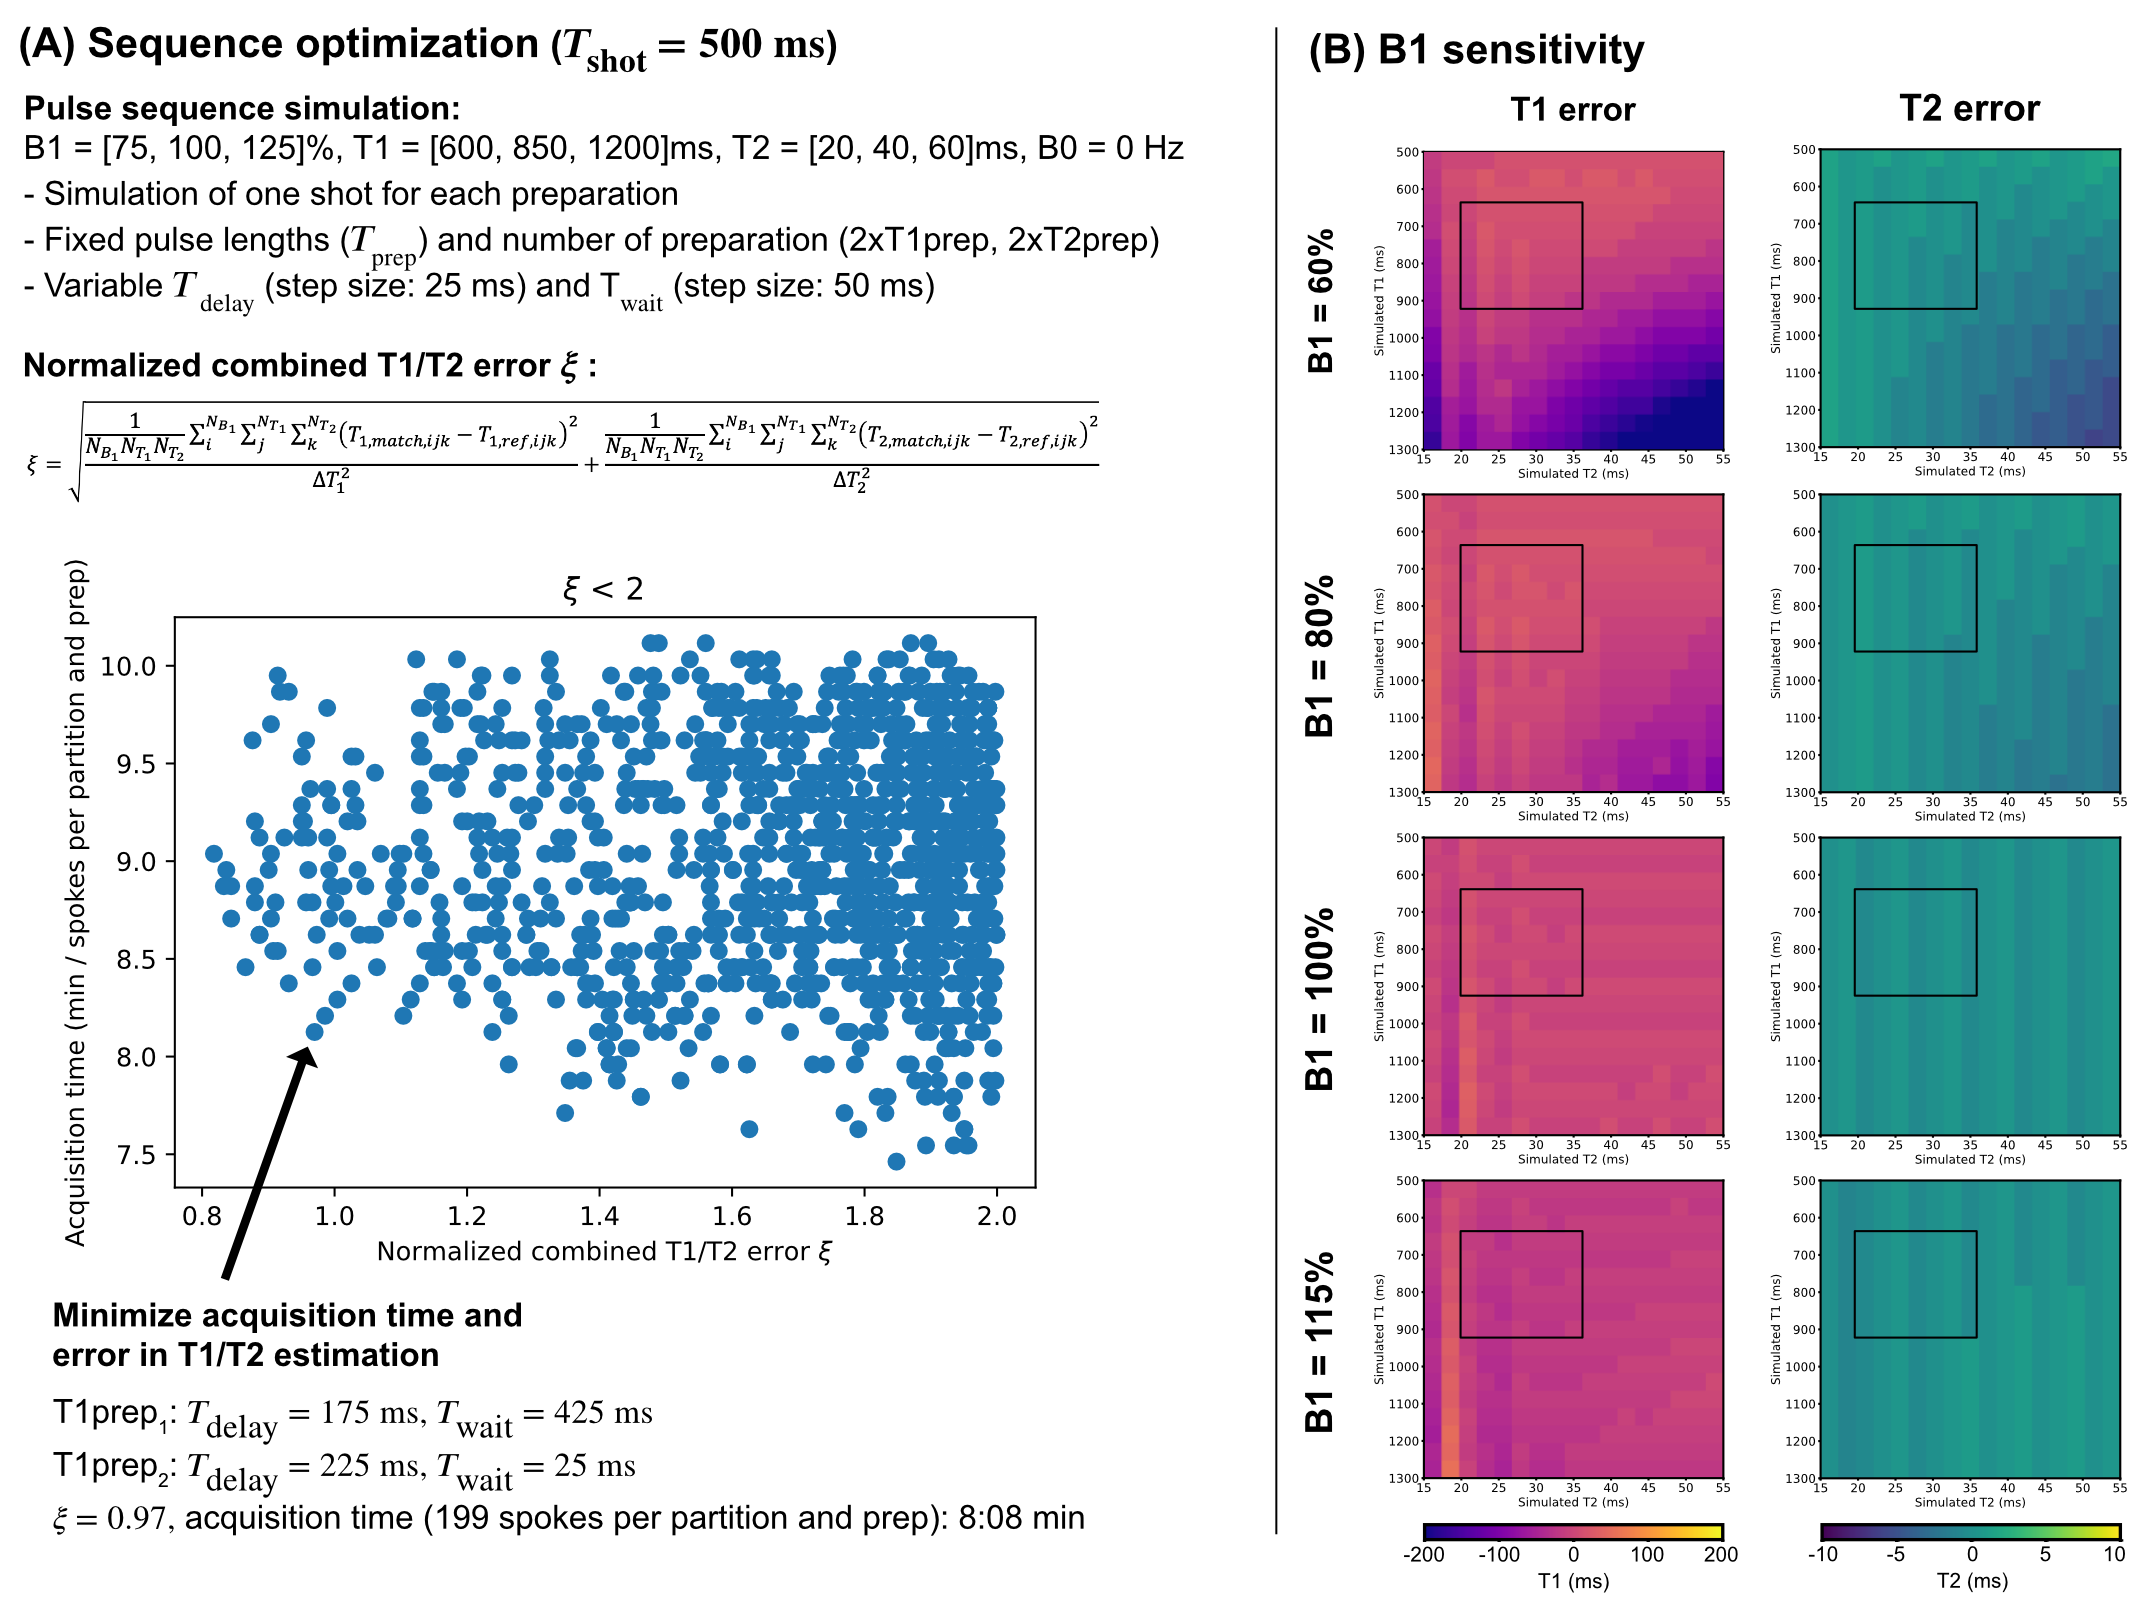
Pulse sequenceThe proposed pulse sequence consists of an adiabatic modified BIR-4 preparation pulse8,9 with a variable gap duration between the BIR-4 segments (Tprep) and a variable pulse angle (T2prep with Φ=0° and T1prep with Φ=180°) followed by a two-point bipolar gradient echo stack-of-stars read-out acquiring radial spokes along the partition direction per shot (Fig.1). The delay time between preparation pulse and read-out (Tdelay) and the waiting time between two shots (Twait) are variable per preparation. In total, four different preparations (2xT1prep,2xT2prep) were acquired with Tdelay and Twait optimized using Bloch simulations (Fig.2A). The B1 sensitivity analysis in Fig.2B shows a low T1 and T2 error for the expected liver relaxation parameters within the expected range of B1 inhomogeneities in the liver at 3T5.
Image reconstruction and quantification
A breathing curve was extracted from the IFFT of the k-space center along the partition direction using PCA10 and five different motion states were defined based on the extracted relative displacement. The motion-resolved Homodyne reconstruction was performed in Julia11 solving iteratively and slice-wise the inverse problem:
$$x=\text{argmin}_{x'}||FSx'-y||+\alpha_1||D_tx'||_1+\alpha_2||W_r x'||_1+\alpha_3\sum_b||R_b x'||_*$$
With $$$x$$$ being the complex reconstructed images, $$$y$$$ the multi-coil k-space, $$$F$$$ the nonuniform fast Fourier transform, $$$S$$$ the ESPIRiT coil sensitivity maps12, $$$||D_t x||_1$$$ a total variation regularization in the motion state dimension10, $$$||W_r x||_1$$$ a L1-Wavelet regularization in the spatial dimension13, $$$\sum_b||R_b x||_*$$$ a locally low rank regularization for an image block around pixel $$$b$$$14 and α1/α2/α3=0.1/0.005/0.5. The two echo images of the end-expiration motion state were further processed to decompose water and fat signals and compute a field-map based on a dual echo-adapted multi-resolution graph-cut algorithm15,16. The water images were matched to a B0-specific Bloch-simulated dictionary to generate water-specific T1 and T2 maps (T1=200:15:1500ms,T2=10:1.5:100ms,B0=-300:10:300ms).
Phantom and in vivo measurements
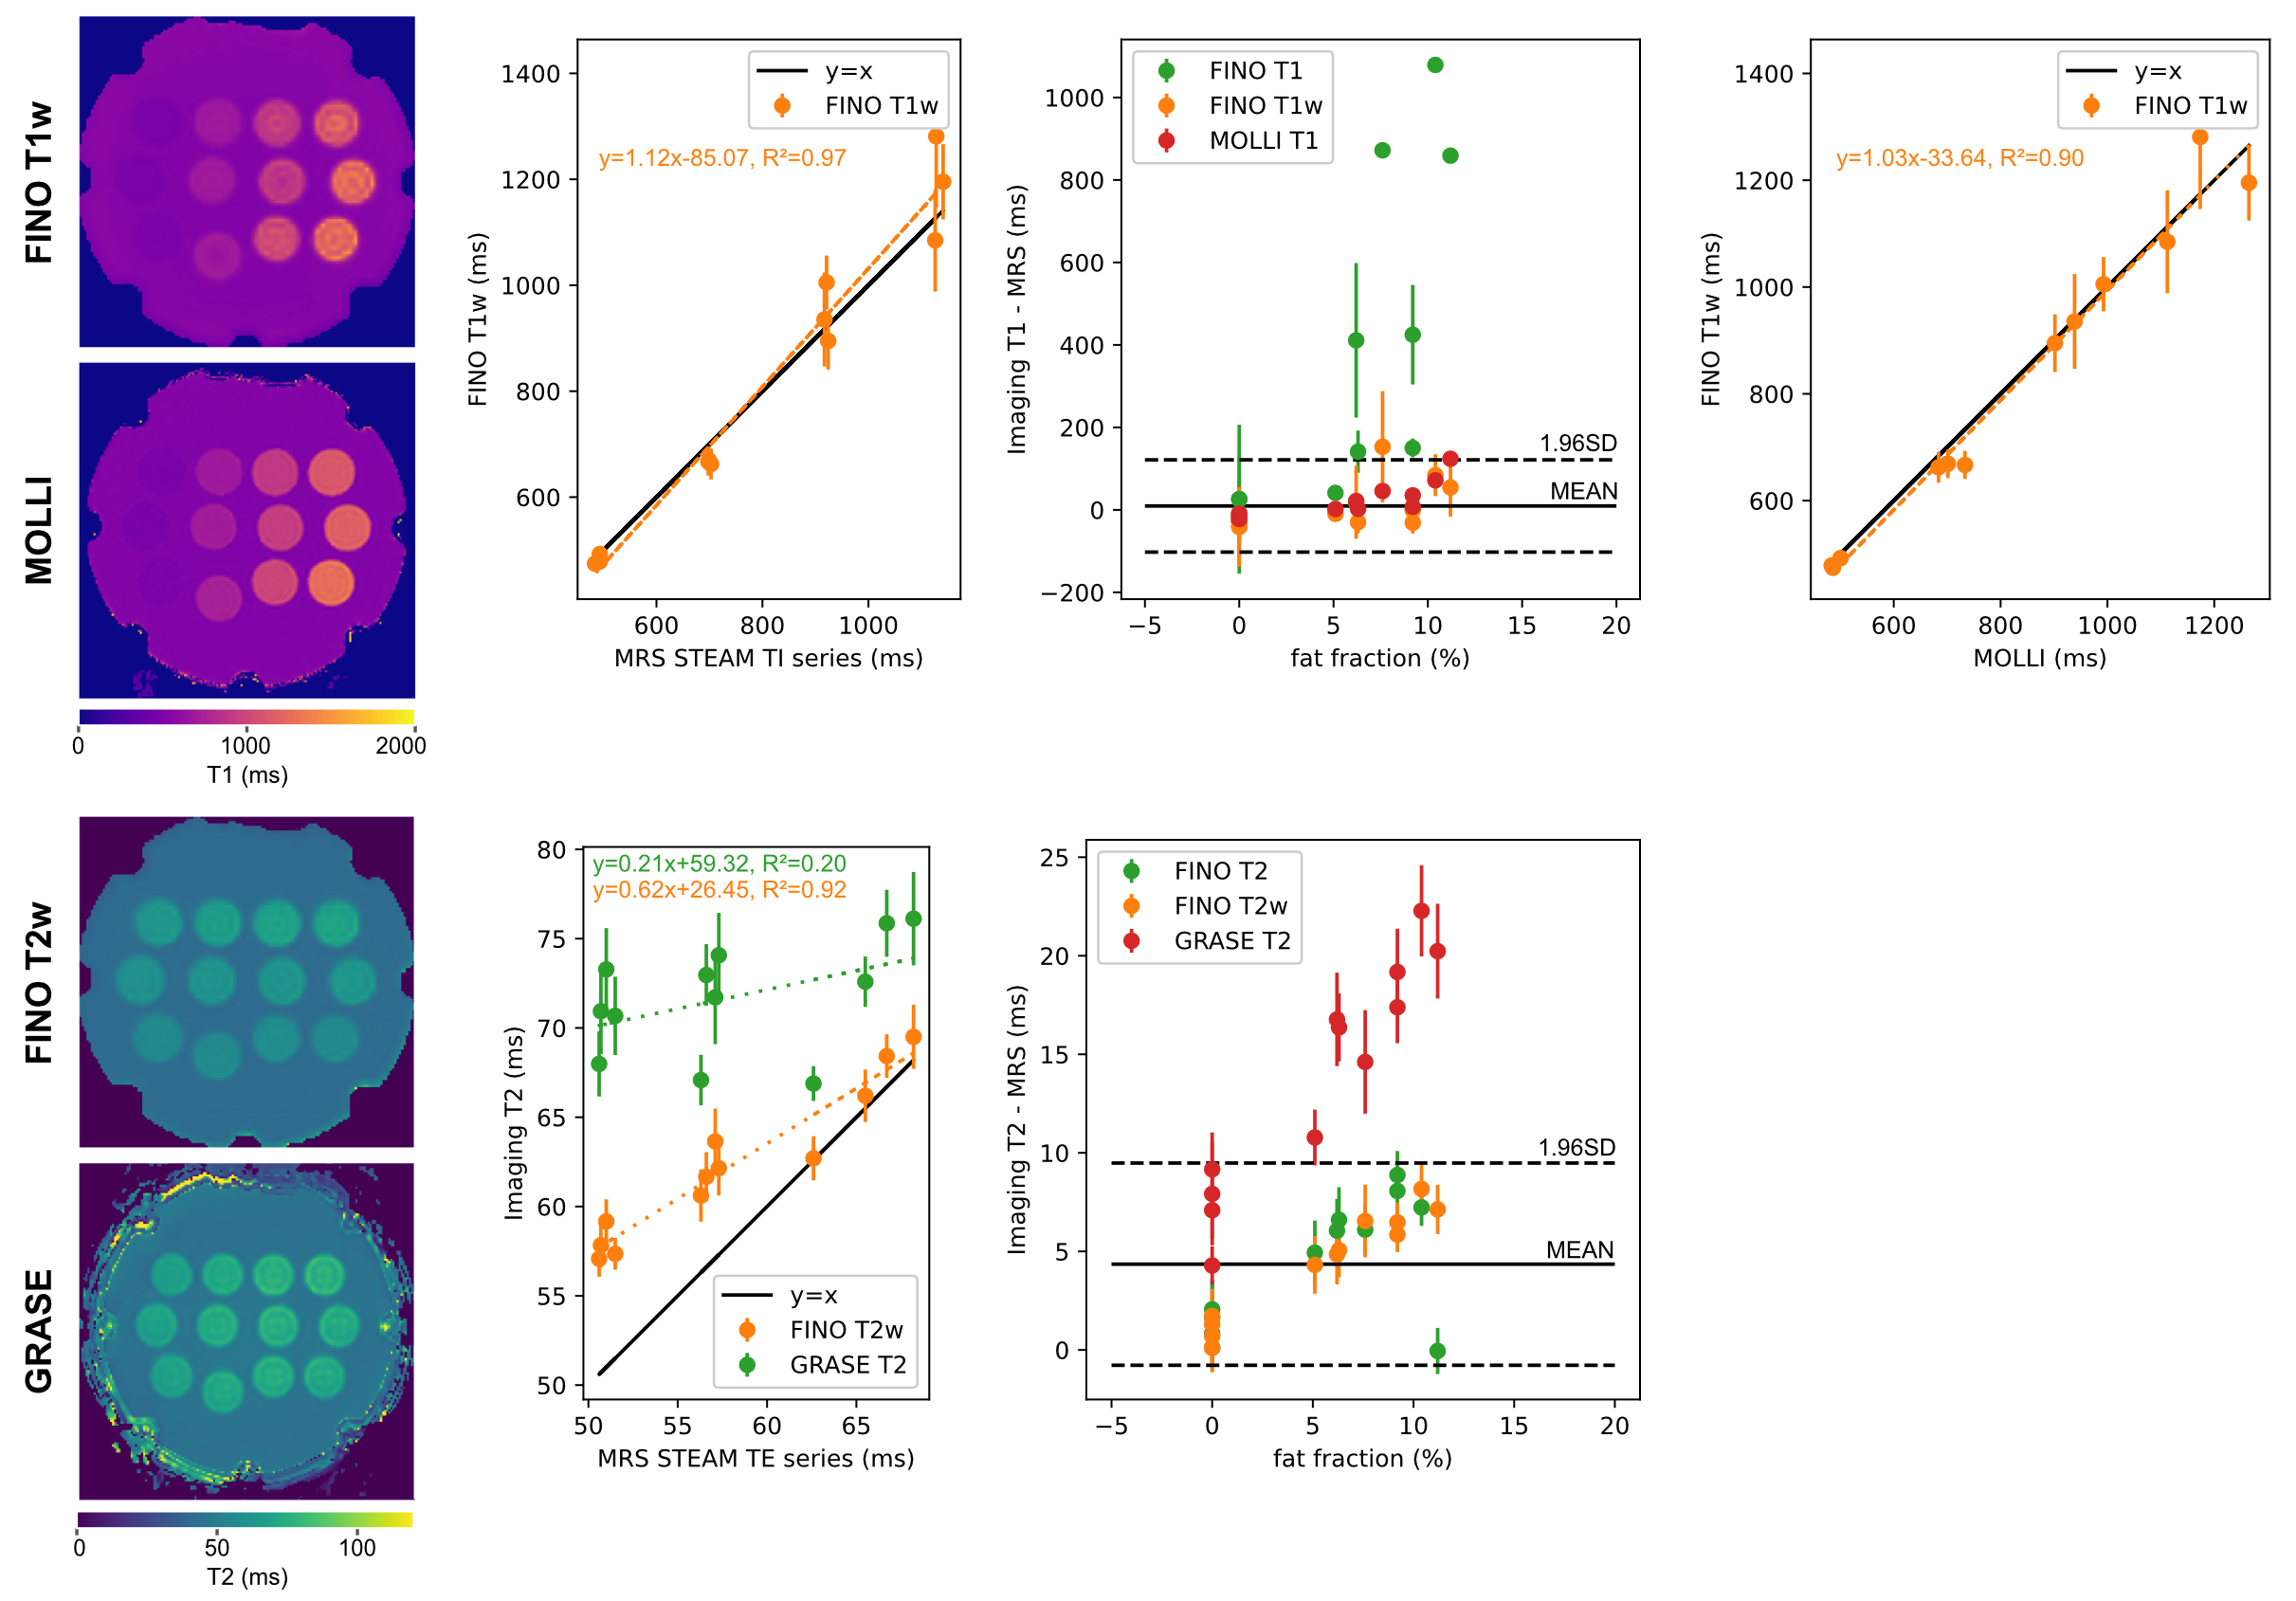
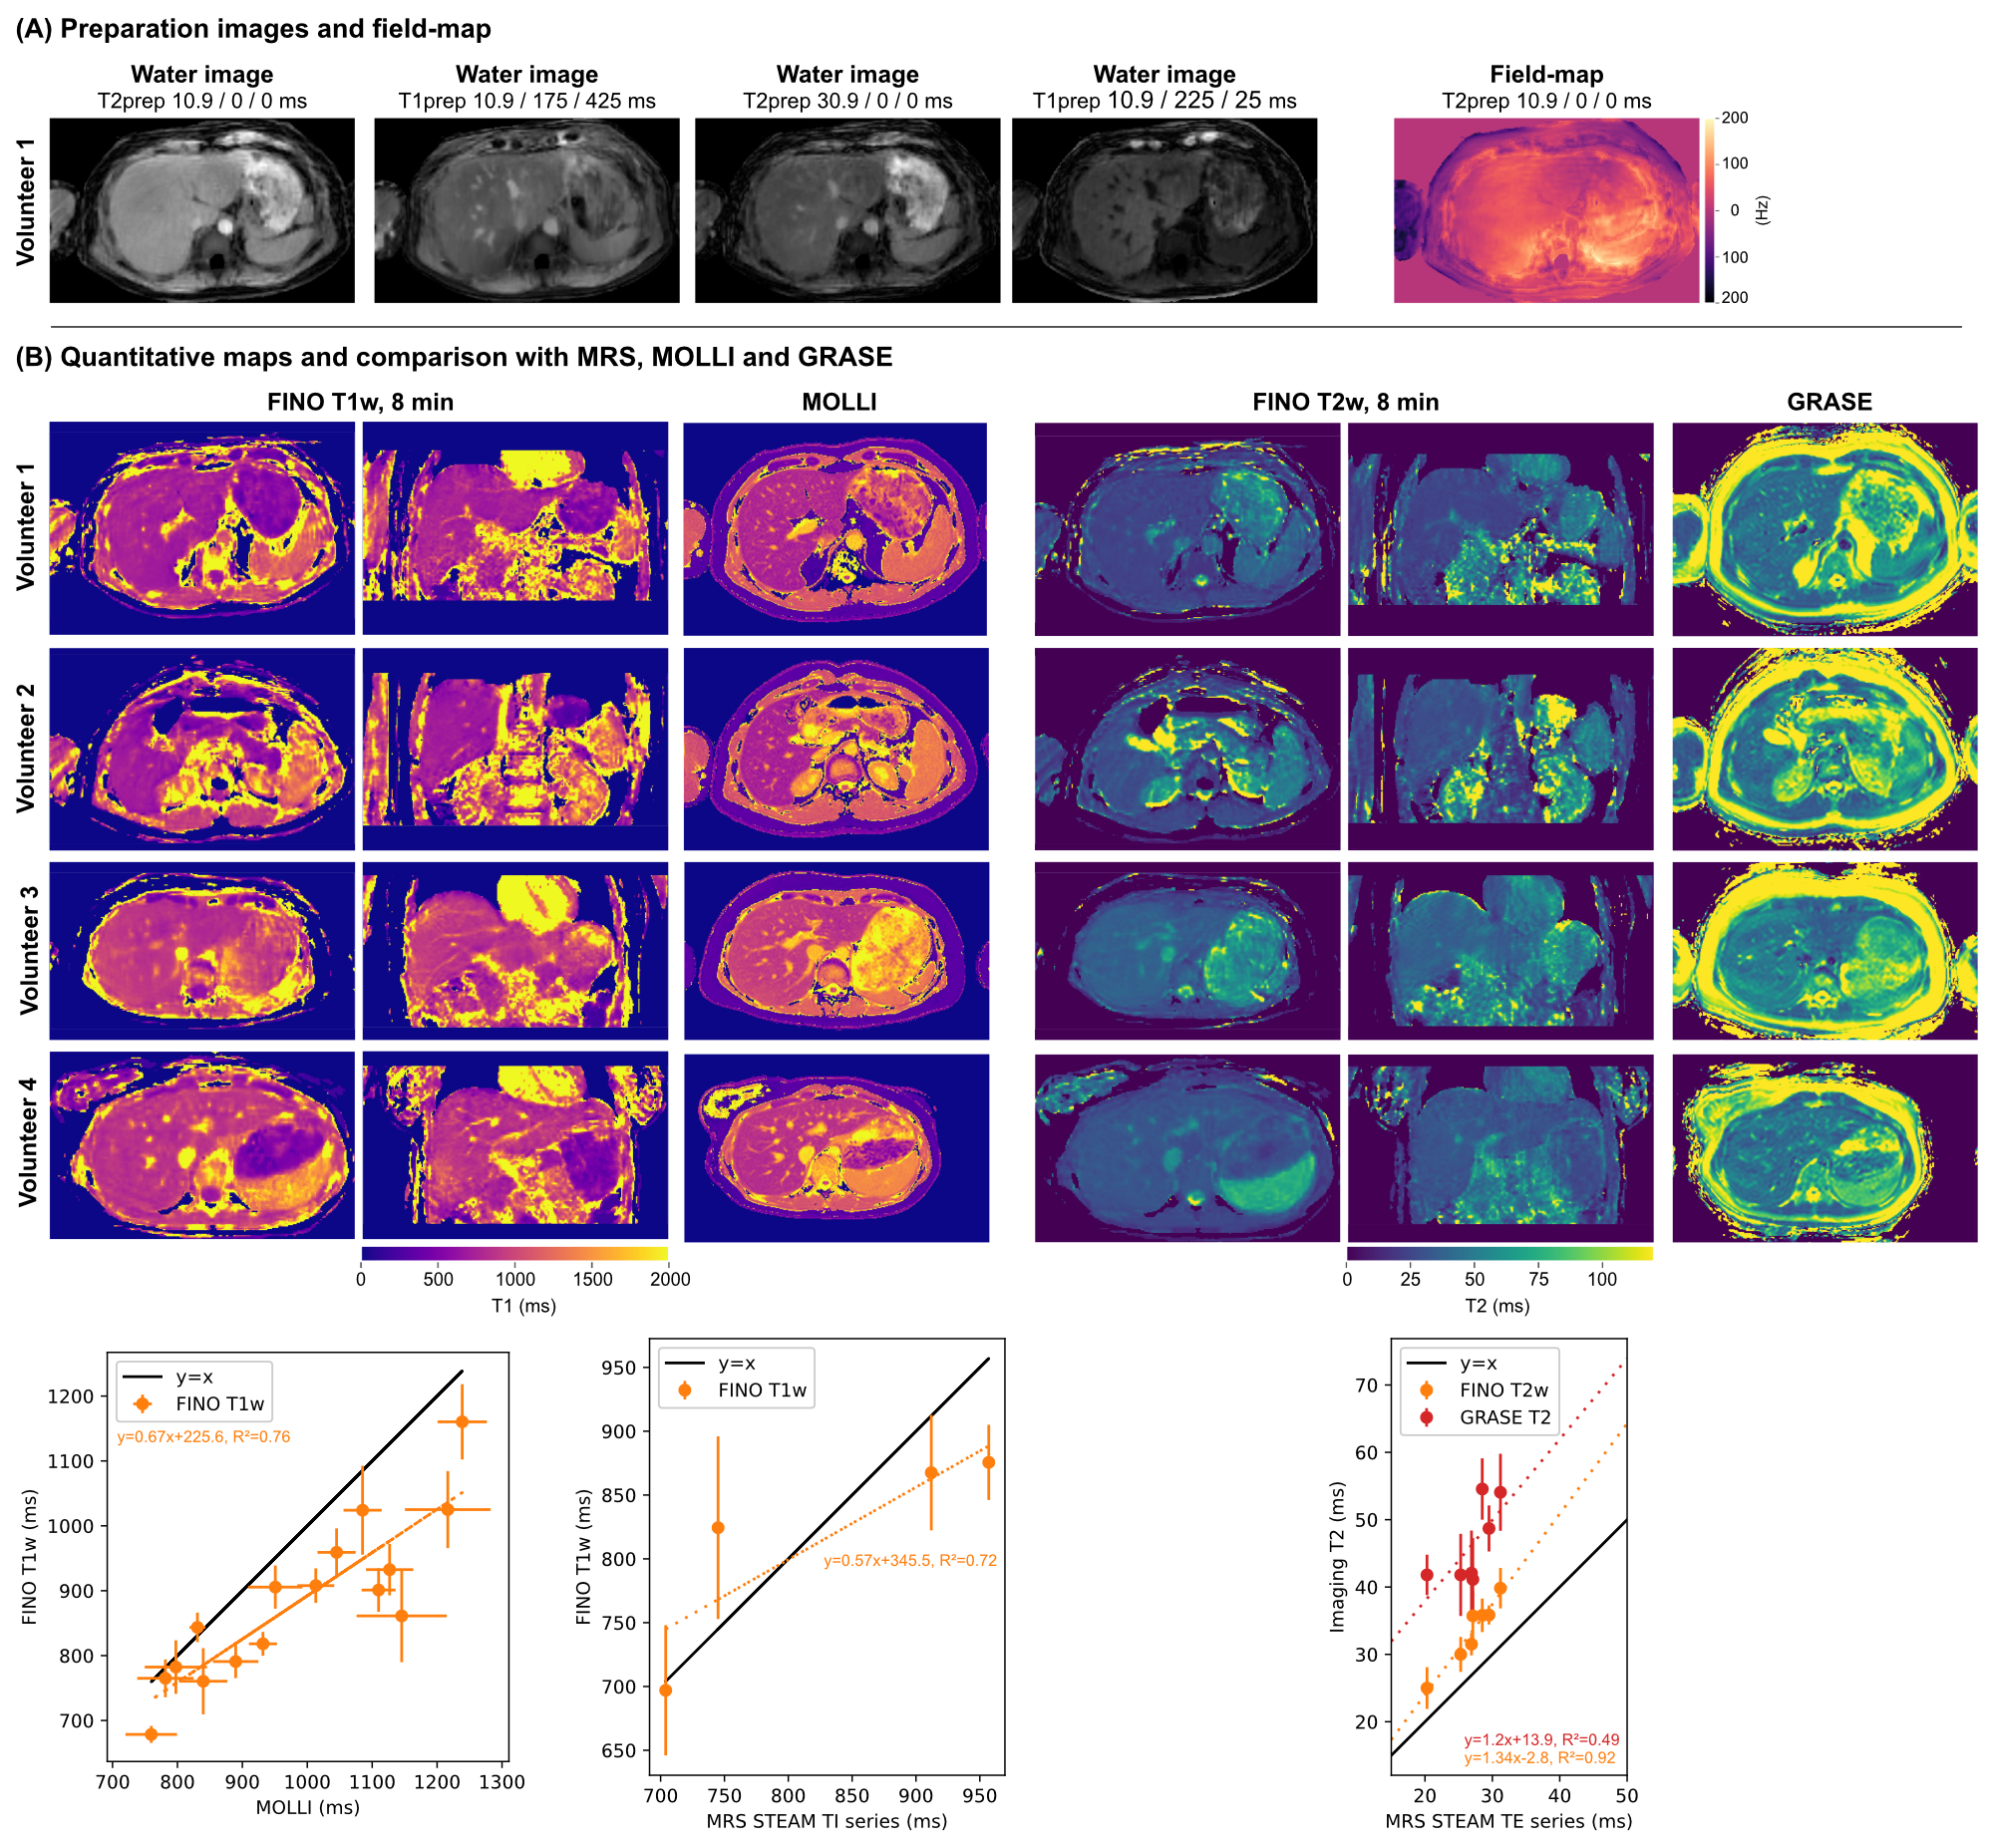
Measurements were performed at 3T (Ingenia Elition, Philips Healthcare) on a water-fat phantom with varying T1 and T2 (Calimetrix, Madison, USA), and six volunteers (FOV=400x400x200mm³, isotropic voxel size=3mm, TR/TE1/TE2=3.8/1.1/2.2ms, 199 or 149 radial spokes per partitions and preparation with a fixed scan time of 8 or 6 min, respectively, FA=8°, partial Fourier factor=3/4, Tshot=500ms, Fig.1). The vendor’s implemented T1 (MOLLI: single slice, voxel size=2x2mm, slice thickness 5mm, breath-hold) and T2 mapping (Gradient And Spin Echo, GRASE: voxel size=3x3mm, slice thickness 3mm, 8 echoes, TR=1641ms, TEs=16:8:64ms, nominal scan time=2min24s, respiratory triggering) sequences were acquired as a imaging reference. Single-voxel magnetic resonance spectroscopy (MRS) was acquired in the phantom (STEAM, VOI=10x10x10mm³, TR=5000ms, TE series: TE=[10,15,20,25,75]ms and TI series: TI=[10,100,500,1500,2500]ms, TE=10ms) and in vivo (STEAM, VOI=15x15x15mm³, breath-hold, TE series: TE=[10,20,30,40,50,100]ms and TR=1500ms, and TI series: TI=[10,800,1500,2300]ms, TE=9.5ms and TR=5000ms). MRS data was processed with ALFONSO17.
Results
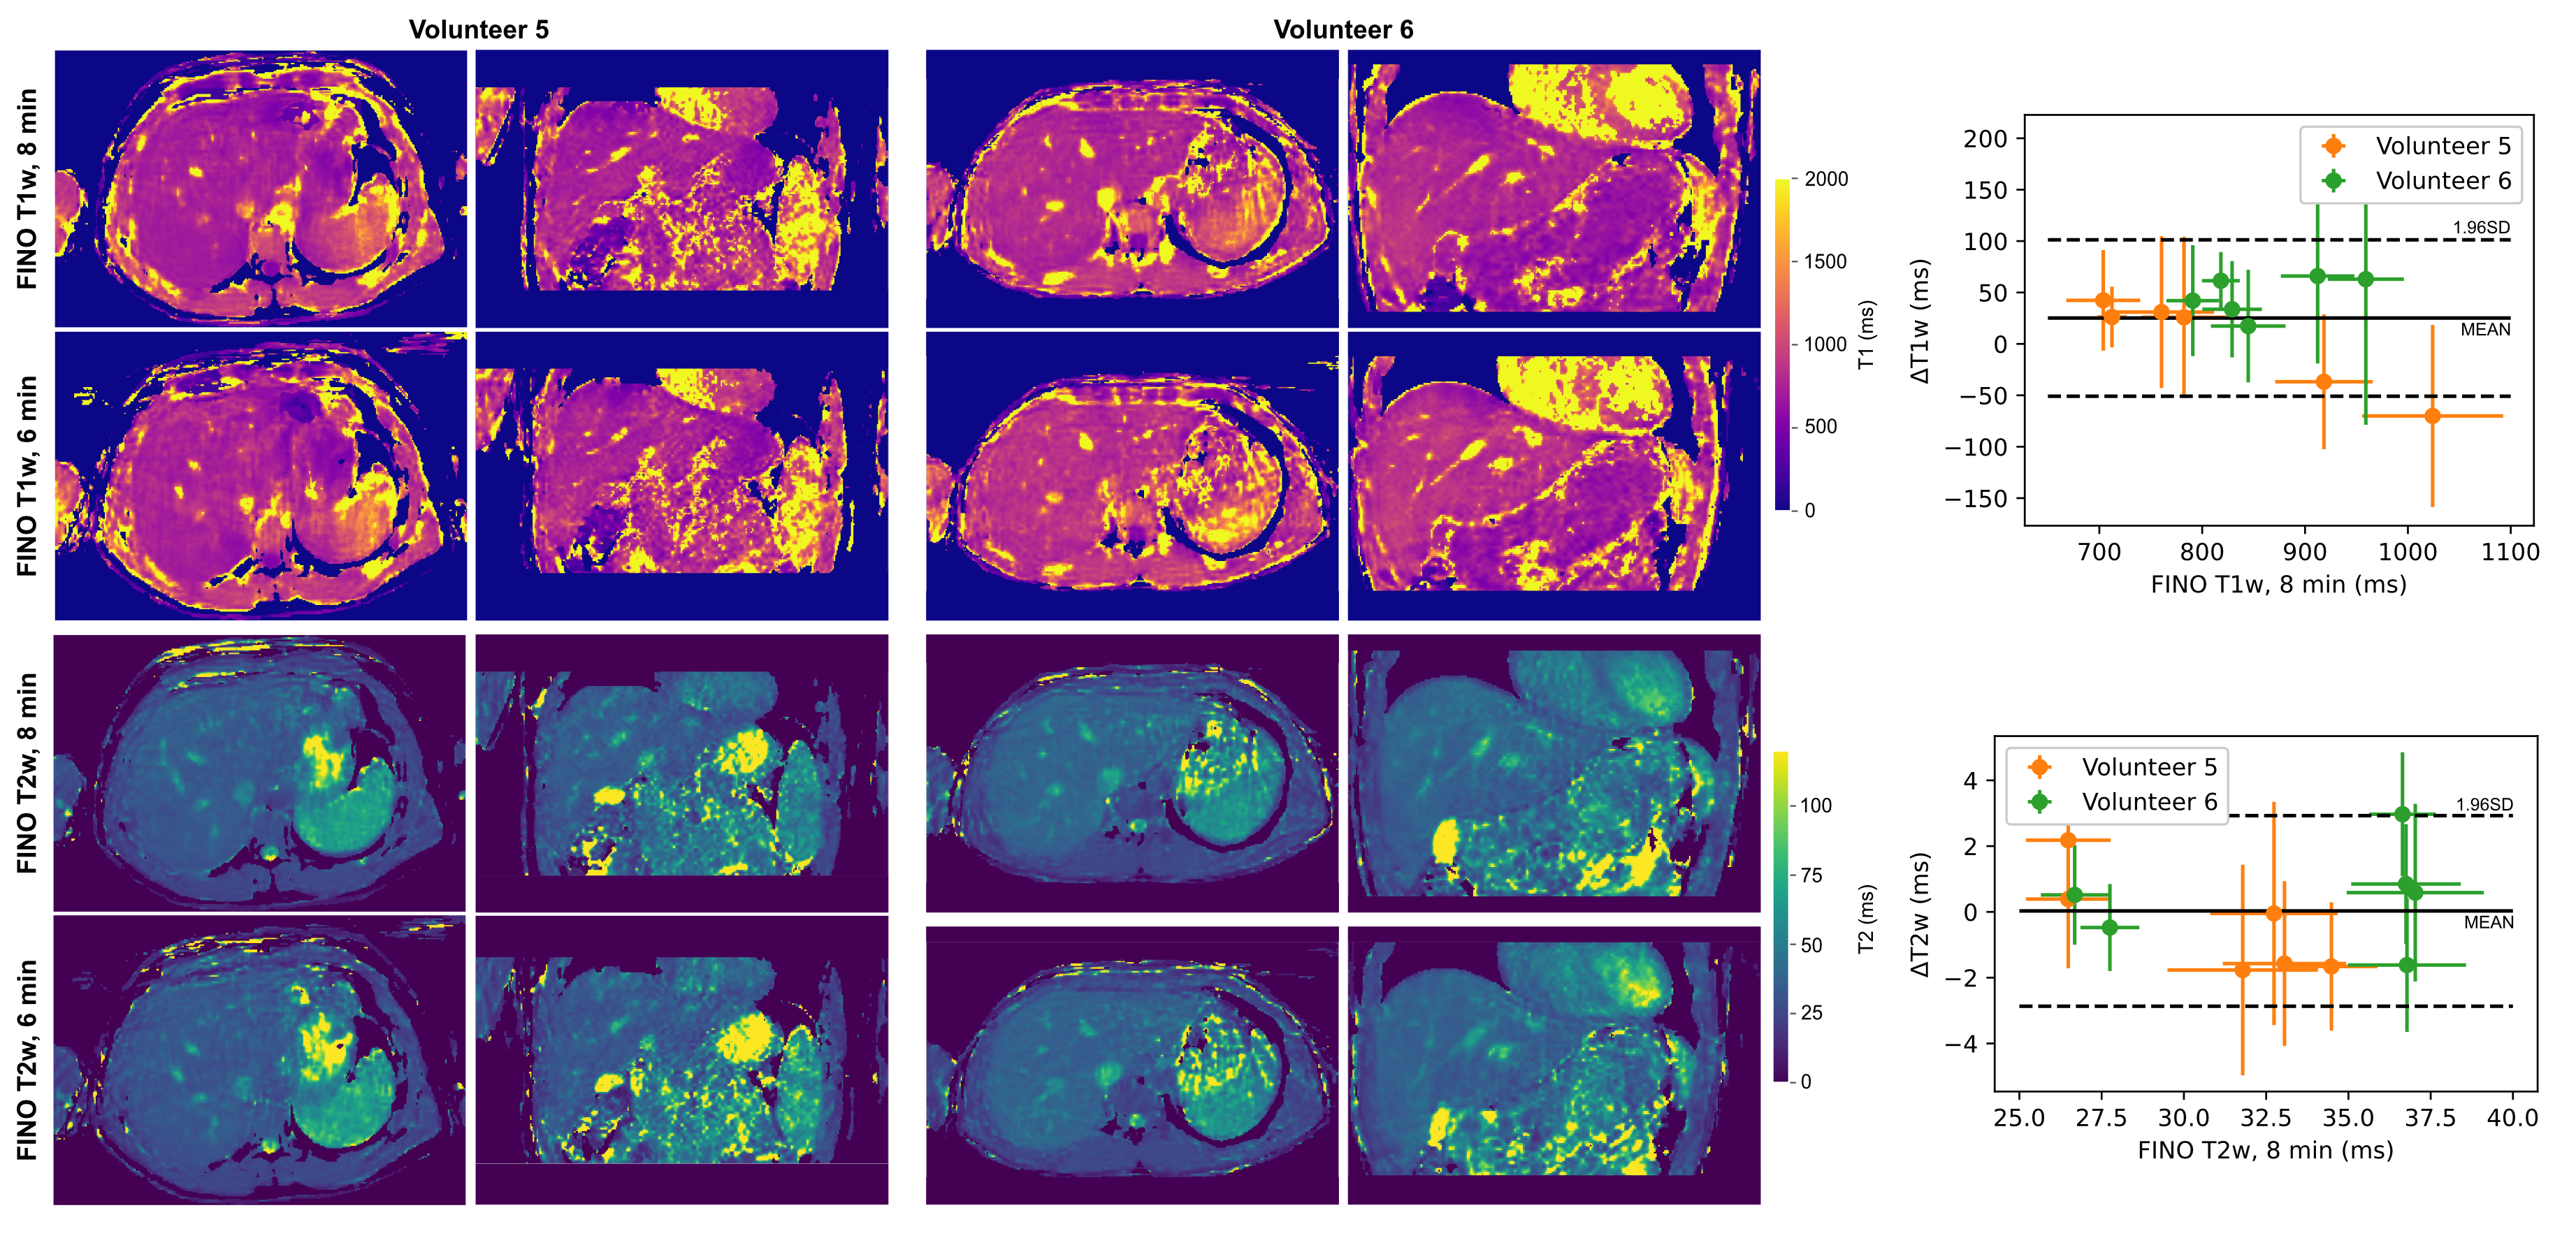
Phantom experiments show a good agreement of FINO T1w mapping with MOLLI and MRS (Fig.3). GRASE T2 was considerably higher than FINO T2w and MRS, whereas FINO T2w showed only a slight overestimation compared to MRS at smaller T2w values. Similar trends can be observed for the in vivo results with a slightly larger discrepancy between MOLLI and FINO (Fig.4). Fig.5 presents the reproducibility of the T1w/T2w-maps at two different levels of undersampling.Discussion
FINO showed a good quantification performance with small deviations compared to the reference. It is known that MOLLI and GRASE quantification could be biased18,19. The acquisition of only a single inversion contrast per preparation allows a higher flexibility in the selection of the feet-head (F/H) resolution, at the cost of some T1-blurring along the F/H axis. The acquisition of only a single inversion contrast per preparation additionally reduces the contrast variation across kz-projections and ensures the possibility to use the self-navigating properties of the stack-of-stars trajectory3.Conclusion
FINO allows whole-liver T1w and T2w quantification with high accuracy at an isotropic spatial resolution of 3mm in a fixed acquisition time of 6min during free breathing.Acknowledgements
The present work was supported by the TUM International Graduate School of Science and Engineering (TUM-ICL Joint Academy of Doctoral Studies). The authors also acknowledge research support from Philips Healthcare.References
[1] Hoffman DH, Ayoola A, Nickel D, Han F, Chandarana H, Shanbhogue KP. T1 mapping, T2 mapping and MR elastography of the liver for detection and staging of liver fibrosis. Abdominal Radiology 2019;45:692–700. 10.1007/s00261-019-02382-9.
[2] Guimaraes AR, Siqueira L, Uppal R, Alford J, Fuchs BC, Yamada S, Tanabe K, Chung RT, Lauwers G, Chew ML, Boland GW, Sahani DV, Vangel M, Hahn PF, Caravan P. T2 relaxation time is related to liver fibrosis severity. Quantitative Imaging in Medicine and Surgery 2016; 6:103–114. 10.21037/qims.2016.03.02.
[3] Feng L, Liu F, Soultanidis G, Liu C, Benkert T, Block KT, Fayad ZA, Yang Y. Magnetization-prepared GRASP MRI for rapid 3D T1 mapping and fat/water-separated T1 mapping. Magnetic Resonance in Medicine 2021; 86:97–114. 10.1002/mrm.28679.
[4] Wang N, Cao T, Han F, Xie Y, Zhong X, Ma S, Kwan A, Fan Z, Han H, Bi X, Noureddin M, Deshpande V, Christodoulou AG, Li D. Free-breathing multitasking multi-echo MRI for whole-liver water-specific T1, proton density fat fraction, and quantification. Magnetic Resonance in Medicine 2021; 87:120–137. 10.1002/mrm.28970.
[5] Roberts NT, Hinshaw LA, Colgan TJ, Ii T, Hernando D, Reeder SB. B0 and B1 inhomogeneities in the liver at 1.5 T and 3.0 T. Magnetic Resonance in Medicine 2020; 85:2212–2220. 10.1002/mrm.28549.
[6] Wang N, Serry FM, Cao T, Han F, Xie Y, Zhong X, Ma S, Bi X, Noureddin M, Hussain S, Deshpande V, Christodoulou AG, Li D. Free-Breathing Dual-Flip-Angle Multitasking Multi-Echo (MT-ME-dFA) MRI for Whole-Liver, B1+ Insensitive Quantification of T1, PDFF, and R2*. Proc Intl Soc Mag Reson Med 30 2022; p. 0110.
[7] Muslu Y, Cashen TA, Mandava S, Reeder SB. Free-Breathing, Fat- and B1-corrected T1 Mapping of the Liver with Chemical Shift Encoded Inversion Recovery MRI. Proc Intl Soc Mag Reson Med 30 2022; p.0115.
[8] Weidlich D, Schlaeger S, Kooijman H, Börnert P, Kirschke JS, Rummeny EJ, Haase A, Karampinos DC. T2 mapping with magnetization-prepared 3D TSE based on a modified BIR-4 T2 preparation. NMR in Biomedicine 2017; 30:e3773. 10.1002/nbm.3773.
[9] Zamskiy M, Weiss K, Harder FN, Ruschke S, Makowski MR, Braren RF, Karampinos DC. Isotropic resolution volumetric liver T2 mapping using a free-breathing navigator-gated radial stack-of-stars T2-prepared Dixon acquisition. Proc Intl Soc Mag Reson Med 30 2022; p. 2286.
[10] Feng L, Axel L, Chandarana H, Block KT, Sodickson DK, Otazo R. XD-GRASP: Golden-angle radial MRI with reconstruction of extra motion-state dimensions using compressed sensing. Magnetic Resonance in Medicine 2015; 75:775–788. 10.1002/mrm.25665.
[11] Knopp T, Grosser M. MRIReco.jl: An MRI reconstruction framework written in Julia. Magnetic Resonance in Medicine 2021; 86:1633–1646. 10.1002/mrm.28792.
[12] Uecker M, Lai P, Murphy MJ, Virtue P, Elad M, Pauly JM, Vasanawala SS, Lustig M. ESPIRiT-an eigenvalue approach to autocalibrating parallel MRI: Where SENSE meets GRAPPA. Magnetic Resonance in Medicine 2013; 71:990–1001. 10.1002/mrm.24751.
[13] Lustig M, Donoho D, Pauly JM. Sparse MRI: The application of compressed sensing for rapid MR imaging. Magnetic Resonance in Medicine 2007; 58:1182–1195. 10.1002/mrm.21391.
[14] Zhang T, Pauly JM, Levesque IR. Accelerating parameter mapping with a locally low rank constraint. Magnetic Resonance in Medicine 2014; 73:655–661. 10.1002/mrm.25161.
[15] Eggers H, Brendel B, Duijndam A, Herigault G. Dual-echo Dixon imaging with flexible choice of echo times. Magn Reson Med 2010; 65:96–107. 10.1002/mrm.22578.
[16] Stelter JK, Boehm C, Ruschke S, Weiss K, Diefenbach MN, Wu M, Borde T, Schmidt GP, Makowski MR, Fallenberg EM, Karampinos DC. Hierarchical Multi-Resolution Graph-Cuts for Water-Fat-Silicone Separation in Breast MRI. IEEE Transactions on Medical Imaging 2022; 41:3253–3265. 10.1109/tmi.2022.3180302.
[17] Ruschke S, Karampinos DC. ALFONSO: A versatiLe Formulation fOr N-dimensional Signal mOdel fitting of MR spectroscopy data and its application in MRS of body lipids. Proc Intl Soc Mag Reson Med 30 2022; p. 2776.
[18] Weingärtner S, Desmond KL, Obuchowski NA, Baessler B, Zhang Y, Biondetti E, Ma D, Golay X, Boss MA, Gunter JL, Keenan KE, and DH. Development, validation, qualification, and dissemination of quantitative MR methods: Overview and recommendations by the ISMRM quantitative MR study group. Magnetic Resonance in Medicine 2021; 87:1184–1206. 10.1002/mrm.29084.
[19] Baeßler B, Schaarschmidt F, Stehning C, Schnackenburg B, Maintz D, Bunck AC. Cardiac T2-mapping using a fast gradient echo spin echo sequence - first in vitro and in vivo experience. Journal of Cardiovascular Magnetic Resonance 2015; 17. 10.1186/s12968-015-0177-2.
Figures