0057
Comparing the accuracy of single- and dual-R2* fat-water models for assessing hepatic steatosis and iron overload using Monte Carlo simulations1The University of Memphis, Memphis, TN, United States, 2North Shore University Hospital/Northwell Health, Manhasset, NY, United States, 3University of Tennessee Health Science Center, Memphis, TN, United States, 4St. Jude Children’s Research Hospital, Memphis, TN, United States
Synopsis
Keywords: Liver, Liver
Hepatic iron concentration (HIC) and fat fraction (FF) is assessed by chemical-shift encoded multi-spectral fat-water model that incorporates single- or dual-R2* correction. In this study, we designed a realistic virtual liver model simulating the combined presence of hepatic steatosis and iron overload using histology data and synthesized MRI signal in the virtual model using Monte-Carlo simulation to compare the accuracy of the R2* models to quantify FF in the presence of iron. Our results show that single-R2* is consistent than dual-R2* in estimating FF for HIC<=10 mg Fe/g after which both R2* models show higher error.Introduction
Iron overload is common in patients with chronic liver disease and is known to coexist with hepatic steatosis in patients with non alcoholic fatty liver disease (NAFLD). Multi-spectral fat-water models with R2* correction are crucial for accurate and simultaneous quantification of R2* and fat fraction (FF) for assessment of hepatic iron content (HIC) and steatosis, respectively. However, water and fat protons are affected differently by magnetic perturbations because of their differences in molecular sizes and chemical environment1. Hence, correction models that assume same R2* for fat (R2*F) and water (R2*W) (single-R2*) which is commonly used due to its model simplicity and noise tolerance might not be accurate. Although phantom and patient studies have been published to investigate single vs. dual R2* models, they have limited data points1,2 and simulation studies do not incorporate true liver environment1. The purpose of this study is to compare the accuracy of R2* and FF quantification of single- and dual-R2* models in the presence of both iron and fat by designing virtual liver model with iron overload and steatosis using morphological descriptors from histology and synthesizing MRI signals using Monte-Carlo simulations covering relevant clinical spectrum of FF and HIC.Methods
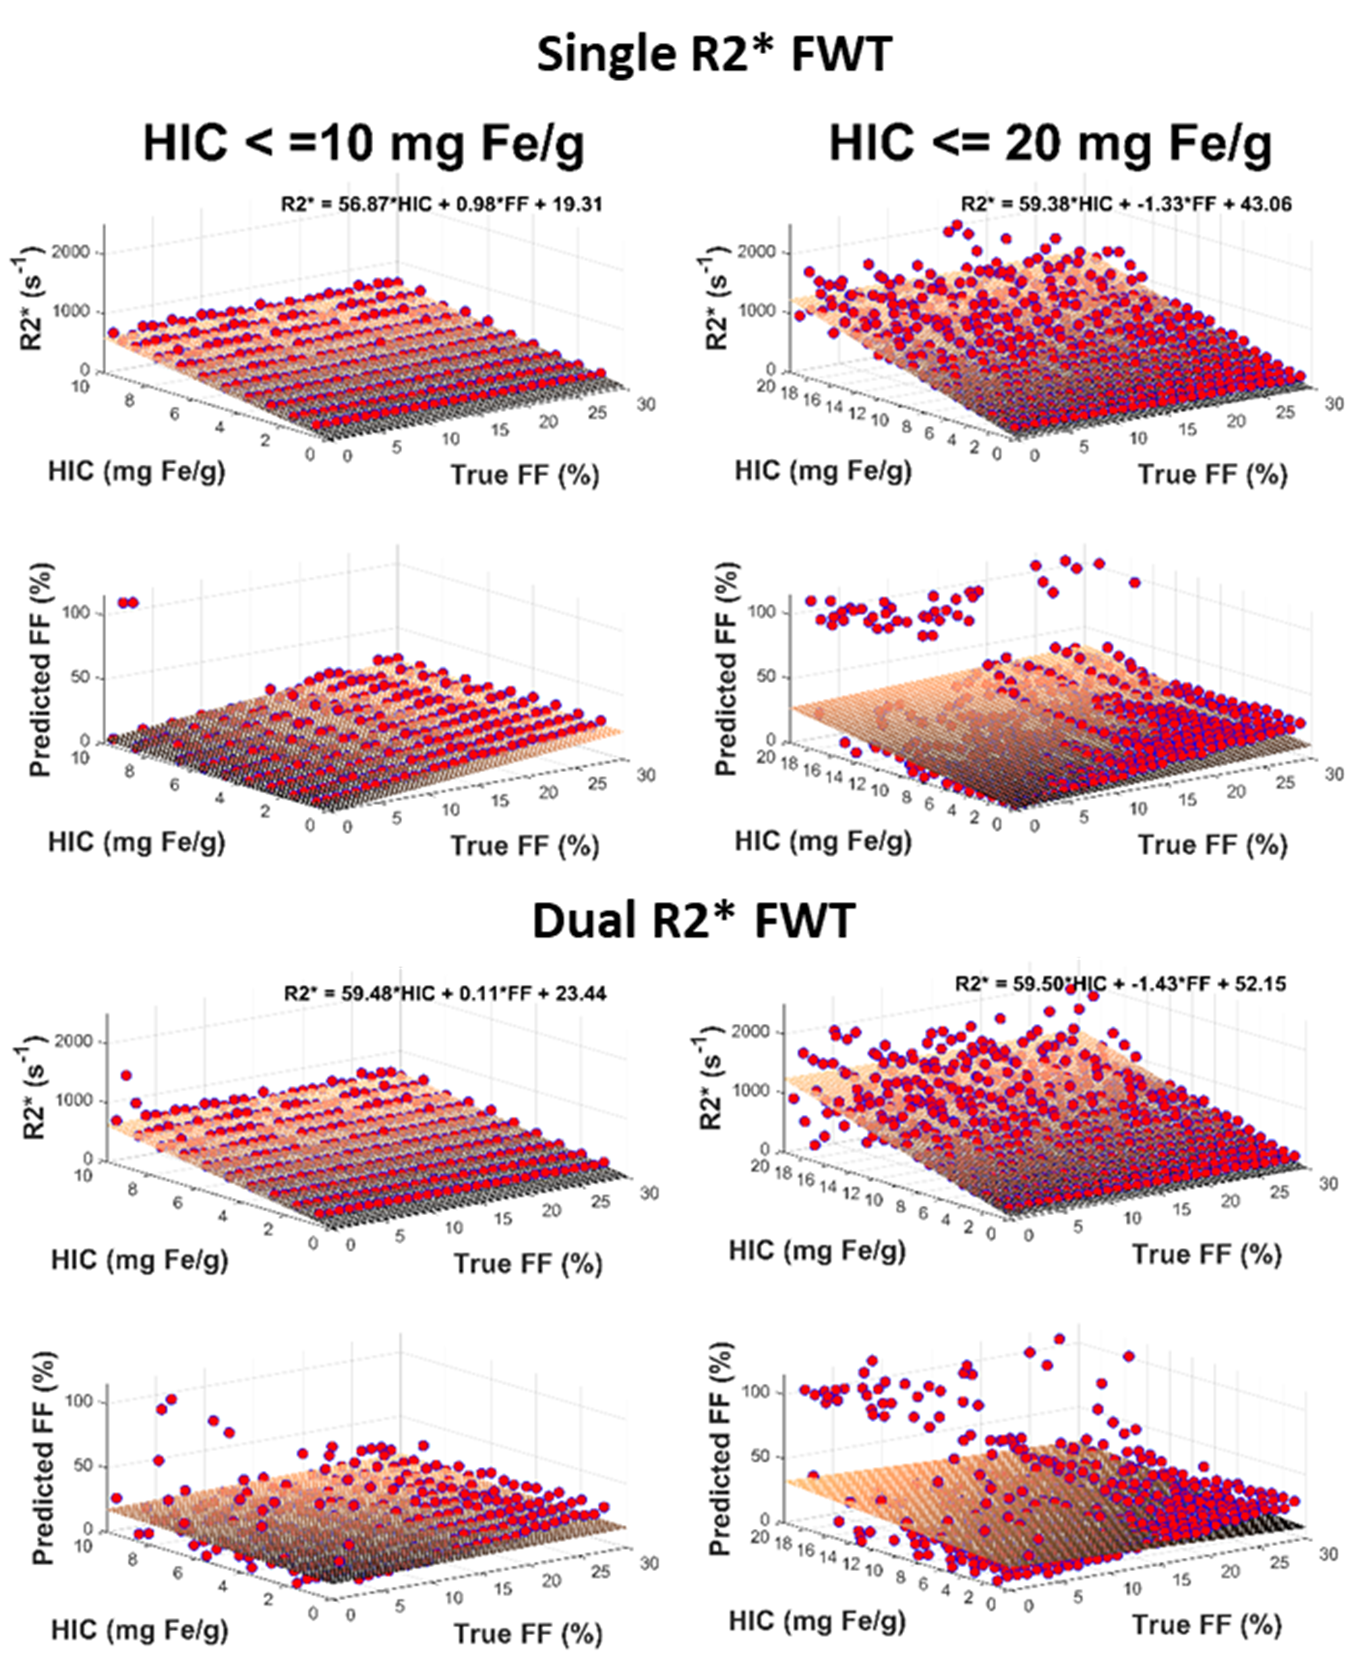
Combined virtual liver iron overload and steatosis models were generated for different FFs and HICs based on published studies and morphometric analysis on histology samples3,4. MRI signal was generated using the Monte-Carlo approach described in previous studies3,5, by accounting for both iron-induced and fat-induced susceptibilities as well as phase differences in water and fat protons. The MRI signals from water and fat were computed and superimposed to obtain the final combined MRI signal. The signals were synthesized for FFs ranging from 0-30% and for HICs 1-20 mg of iron/g of dry tissue weight with echo times (TE): 1, 1.5, 2, …, 14.5ms at both 1.5T and 3T. Fat water toolbox (FWT) was used to calculate R2* and FF for both single- and dual-R2* models. R2*-HIC relationship was compared with the in-vivo calibration and the relationship between R2*, FF and HIC was computed using multi-regression analysis.Results & Discussion
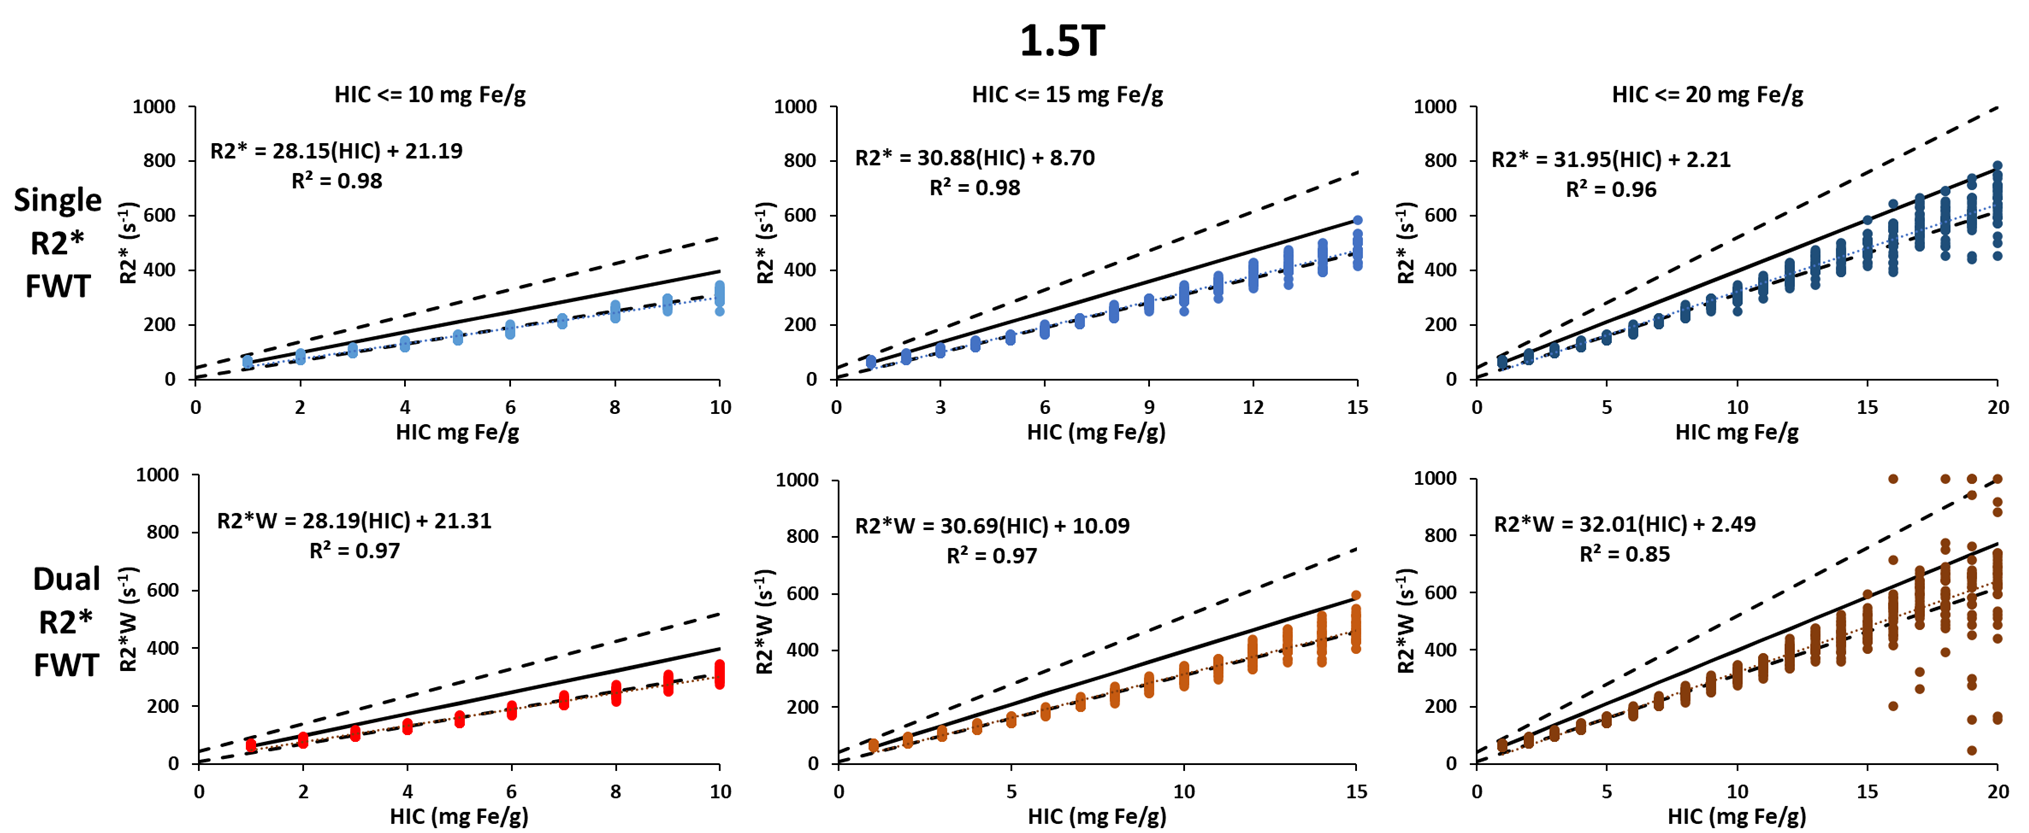
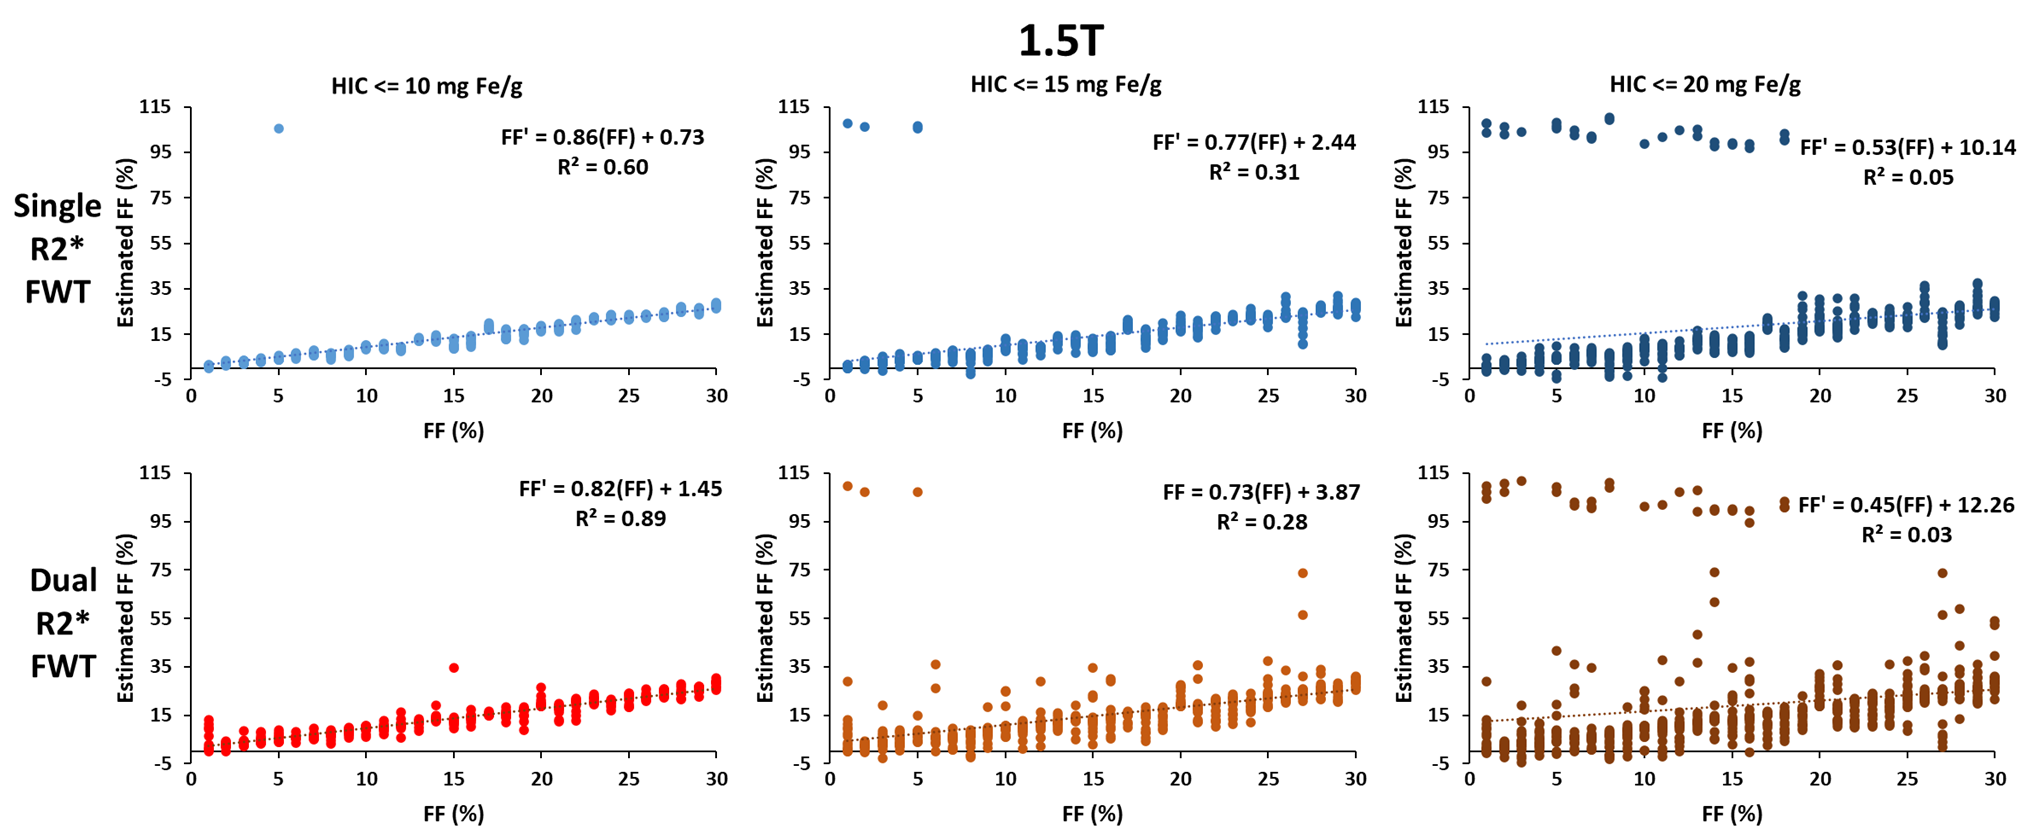
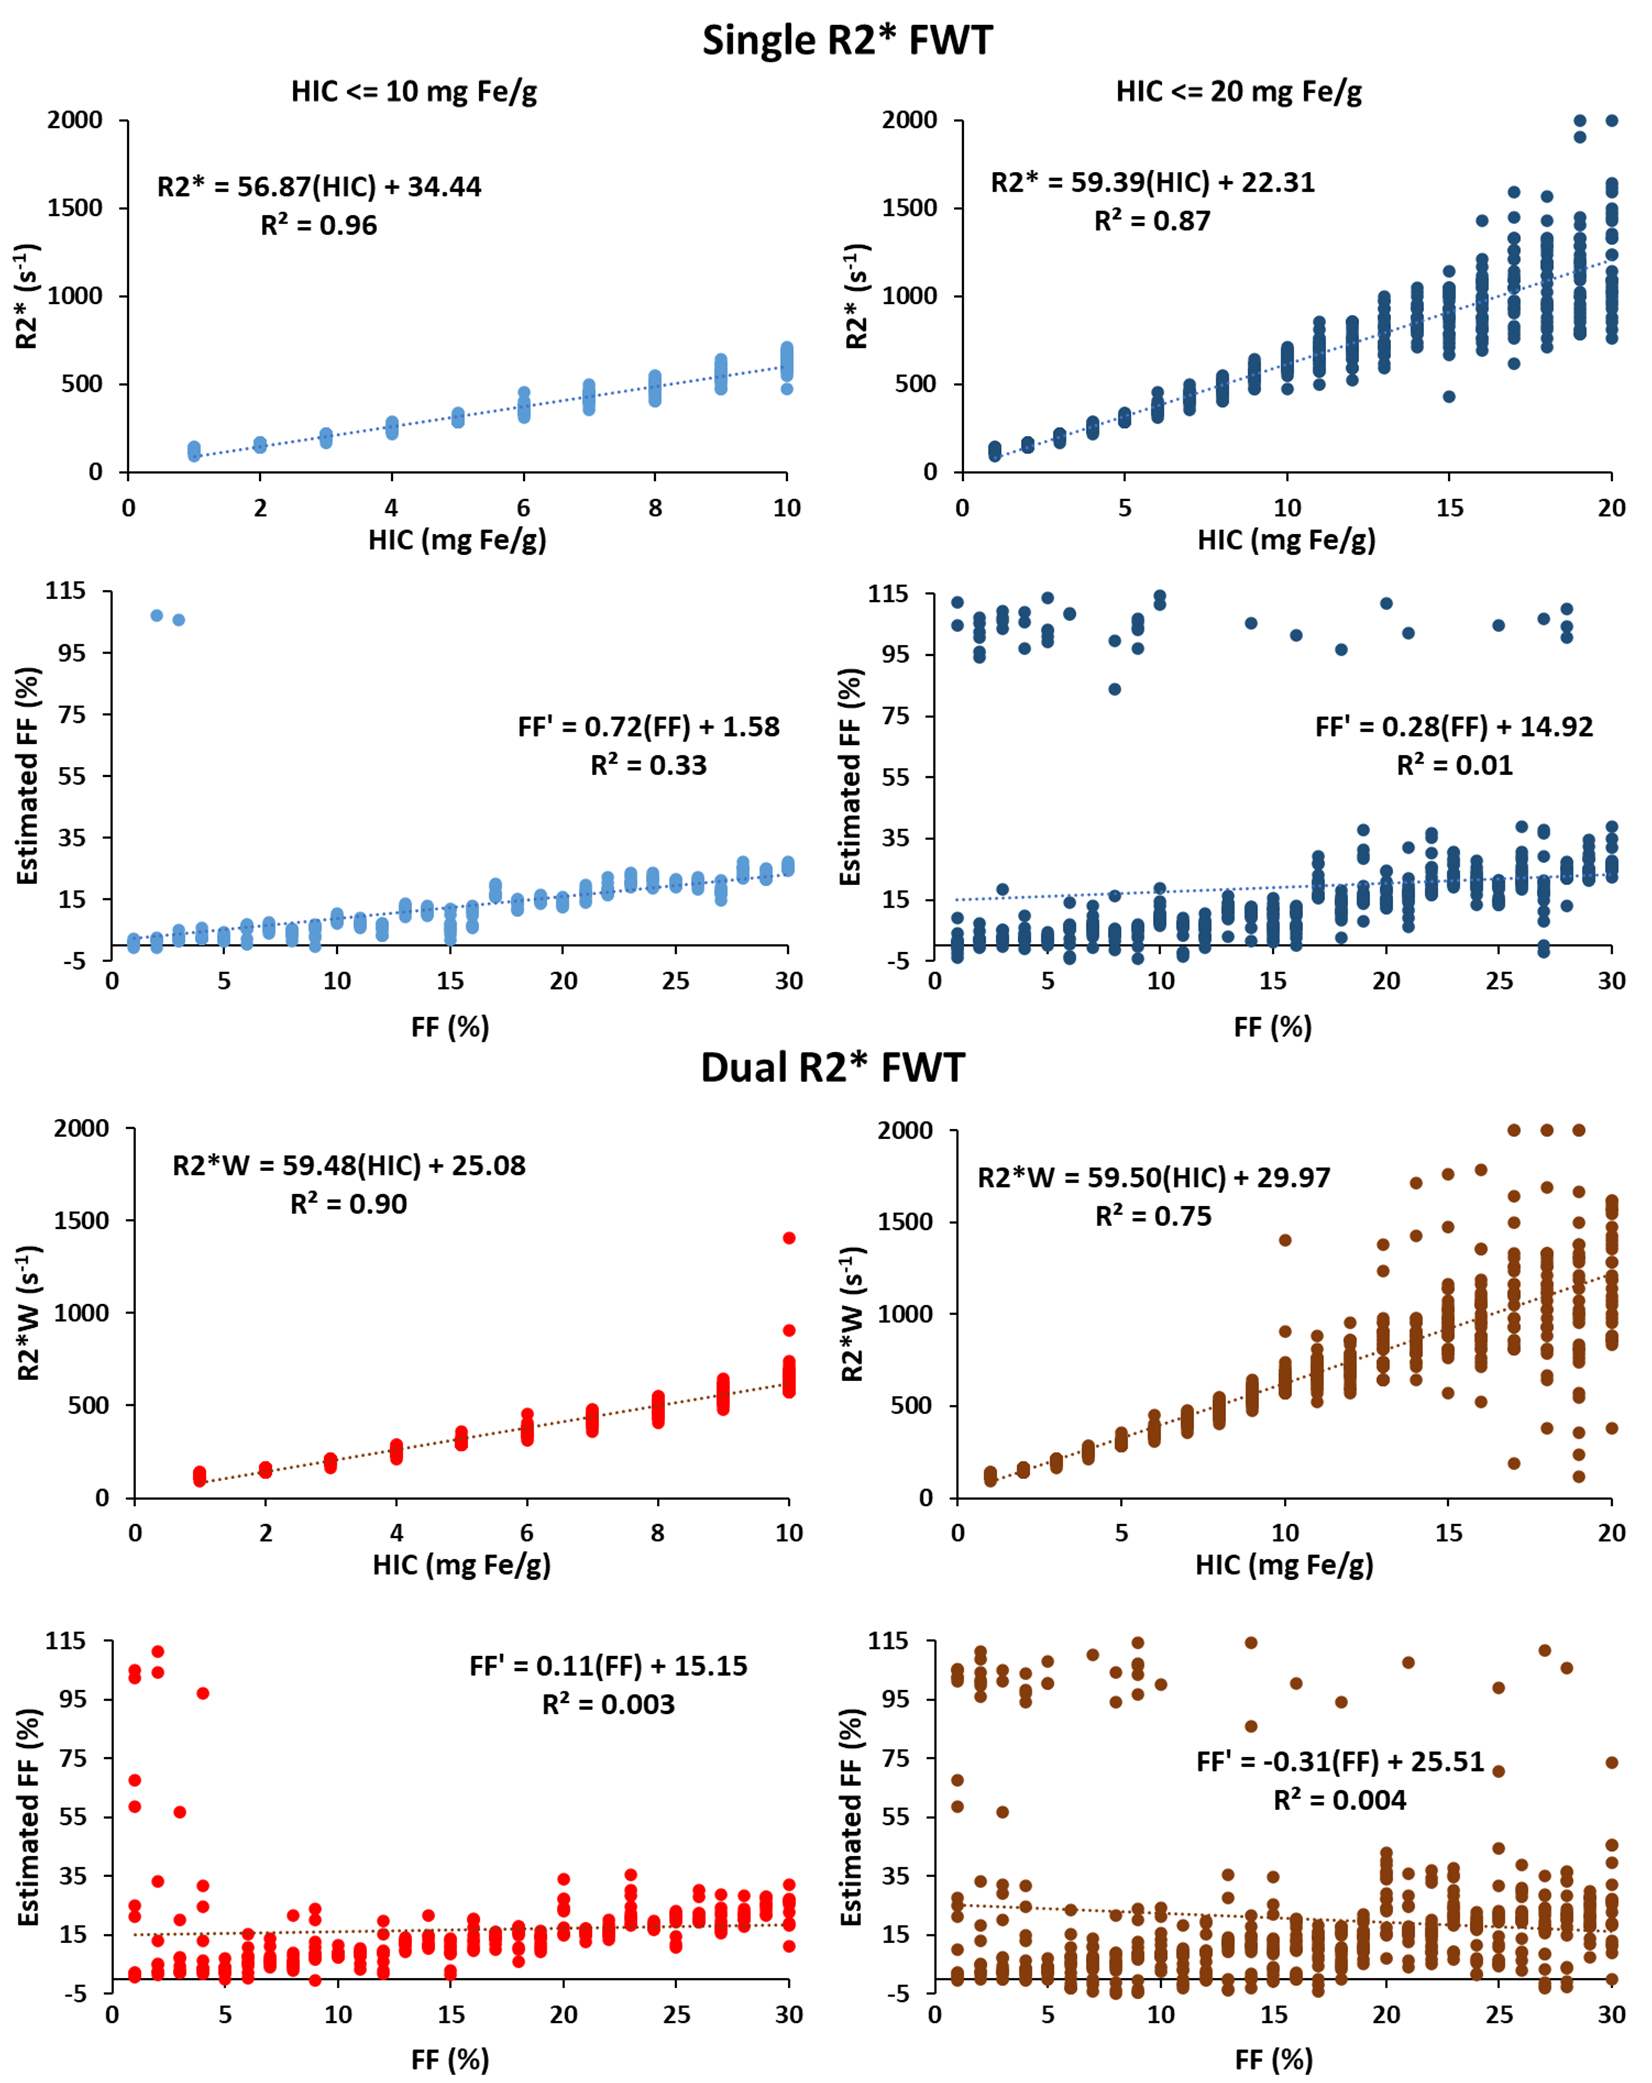
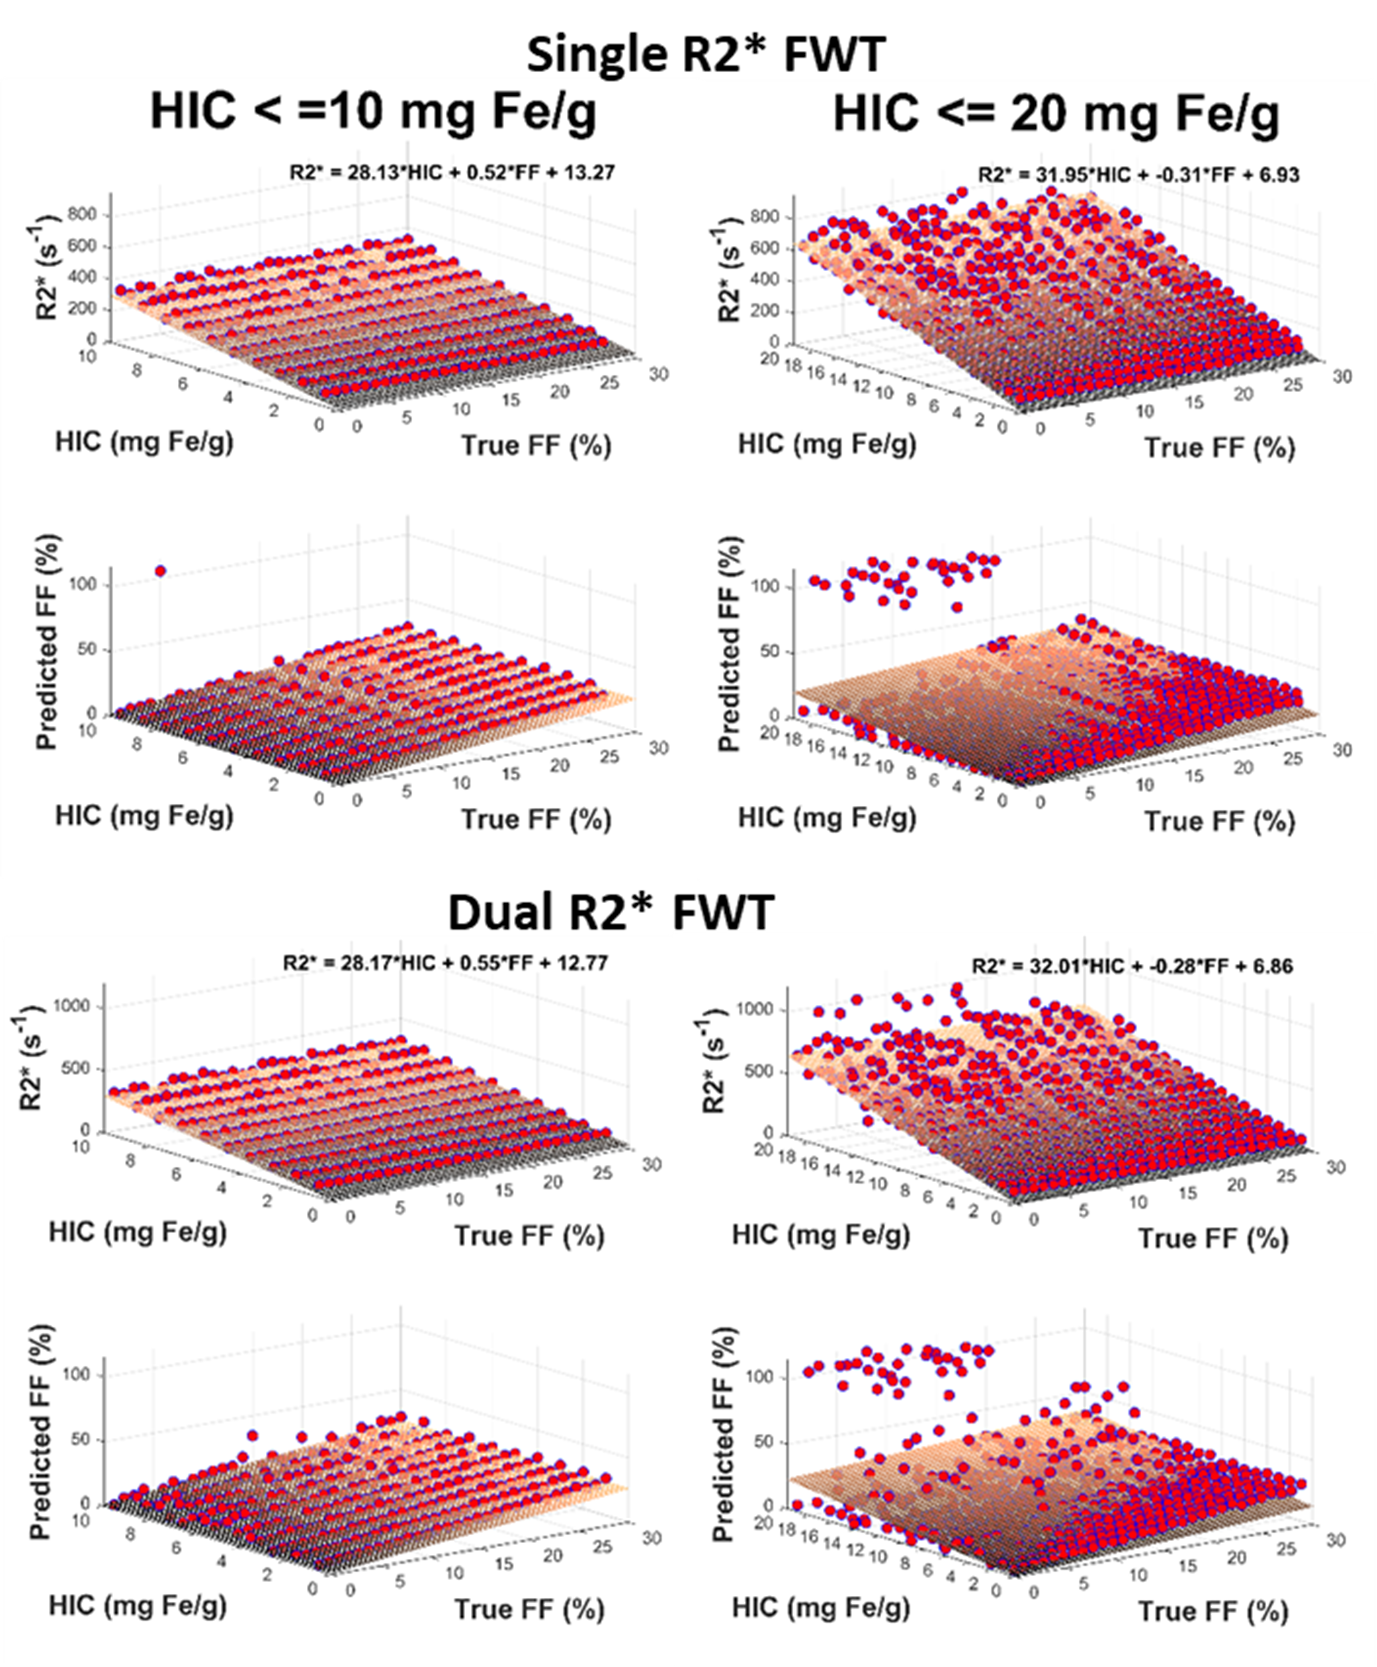
Figure 1 shows that the estimated R2*/R2*W-HIC relationship at 1.5T for both single and dual R2* models falls at the 95% confidence interval of the Wood calibration6, with dual R2* model deviating for higher HICs. Figure 2 shows that the FF is underestimated by both the single- and dual-R2* models in the presence of iron. With increasing HIC, the errors in FF estimation increased due to rapid signal decay. At 3.0T, as the signal decays faster, dual-R2* fails to estimate FF even for lower HIC whereas single-R2*, although underestimates the FF, produces consistent FF upto HIC<=10mg Fe/g. For higher HICs, both the R2* models show poor estimation of FF (Figure 3). R2*/R2*W-HIC relationship for both R2* models show similar slope and intercept values but the relationship is noisier for dual-R2* for higher HIC>10mg Fe/g (Figure 3). Figure 4 and 5 shows the 3D plot comparing R2*/R2*W, HIC and FF for 1.5T and 3.0T respectively. The relationship shows that the R2*/R2*W is strongly affected by HIC and FF has negligible effect on it. The effect of FF on R2*/R2*W value decreases with increasing HIC and field strength. Hence, our simulation data shows that single-R2* model performs slightly better than dual-R2* model for HIC<=10mg Fe/g at 1.5T but it clearly dominates at 3T under the condition of hepatic steatosis and iron overload. However, the performance of both the R2* models decrease for HIC>10mg Fe/g. The presence of iron causes rapid signal decay which can affect the fitting accuracy of multi-spectral fat model leading to errors in FF estimation1. Future work should focus on a thorough investigation of the susceptibility effects of iron on fat protons. Nevertheless, our study demonstrated the feasibility of creating realistic virtual liver models with coexisting pathologies and performing Monte-Carlo simulations for the estimation of R2* and FFConclusion
This study shows that the single-R2* model is superior in quantifying FF in the presence of both fat and iron in liver compared to dual R2* model, especially at 3T. However, the accuracy of both the R2* models decrease after HIC>10mg Fe/g and produces large errors with increasing HIC.Acknowledgements
No acknowledgement found.References
Horng DE, Hernando D, Reeder SB. Quantification of liver fat in the presence of iron overload. Journal of Magnetic Resonance Imaging. 2017;45(2):428-439.
2. Chebrolu VV, Hines CD, Yu H, et al. Independent estimation of T* 2 for water and fat for improved accuracy of fat quantification. Magnetic Resonance in Medicine: An Official Journal of the International Society for Magnetic Resonance in Medicine. 2010;63(4):849-857.
3. Ghugre NR, Wood JC. Relaxivity‐iron calibration in hepatic iron overload: probing underlying biophysical mechanisms using a Monte Carlo model. Magnetic resonance in medicine. 2011;65(3):837-847.
4. Satapathy SK, Tran QT, Kovalic AJ, et al. Clinical and genetic risk factors of recurrent nonalcoholic fatty liver disease after liver transplantation. Clinical and translational gastroenterology. 2021;12(2).
5. Shrestha U, van der Merwe M, Kumar N, et al. Morphological characterization of hepatic steatosis and Monte Carlo modeling of MRI signal for accurate quantification of fat fraction and relaxivity. NMR in Biomedicine. 2021;34(6):e4489.
6. Wood JC, Enriquez C, Ghugre N, et al. MRI R2 and R2* mapping accurately estimates hepatic iron concentration in transfusion-dependent thalassemia and sickle cell disease patients. Blood. 2005;106(4):1460-1465.
Figures