0056
Respiratory-motion-corrected simultaneous 3D T1, T2, and fat-fraction mapping at 0.55T, for comprehensive characterization of liver tissue1School of Biomedical Engineering and Imaging Sciences, King's College London, London, United Kingdom, 2MR Research Collaborations, Siemens Healthcare Limited, Camberley, United Kingdom, 3School of Engineering, Pontificia Universidad Católica de Chile, Santiago, Chile, 4Institute for Biological and Medical Engineering, Pontificia Universidad Católica de Chile, Santiago, Chile
Synopsis
Keywords: Liver, Low-Field MRI
Through T1, T2, and fat fraction mapping, MRI is a formidable tool for the comprehensive assessment of liver health, but has been held back by slow, 2D, single-parameter mapping sequences. We propose a novel respiratory-motion-corrected framework to acquire all three of these maps from a single 6.5-minute scan, on the latest generation of 0.55T scanner. The resulting maps are 3D, with 3 mm isotropic resolution, and co-registered, making them suitable for multiparametric assessment of tissue health. Liver joint T1, T2, and fat fraction maps are in good agreement with reference values and first in-vivo scans provide promising image quality.Introduction
Non-alcoholic fatty liver disease (NAFLD) represents a widespread and growing healthcare problem. MRI offers the ability to quantitatively map tissue parameters correlated with multiple aspects of NAFLD— including T1 for fibrosis, T2 for inflammation, and fat fraction for fat infiltration1-3—whilst avoiding the invasiveness of the current gold standard, liver biopsy. However, current clinical mapping sequences are acquired in sequential 2D scans at 1.5T or 3T, and require multiple time-consuming breathholds, and therefore are prone to misregistration between maps and provide only partial liver coverage. A 3D joint T1 and T2 mapping of the heart has been recently proposed at 1.5T4, which was preliminarily shown to also have potential for liver imaging5, but this approach has not been demonstrated at lower fields strengths which could make liver MRI more accessible and affordable. Here we propose a novel MRI framework providing co-registered, simultaneous, 3D T1, T2, and fat-fraction mapping with full liver coverage, from a single, accelerated, free-breathing scan with non-rigid motion-corrected reconstruction on the latest generation of 0.55T MR scanner.Methods
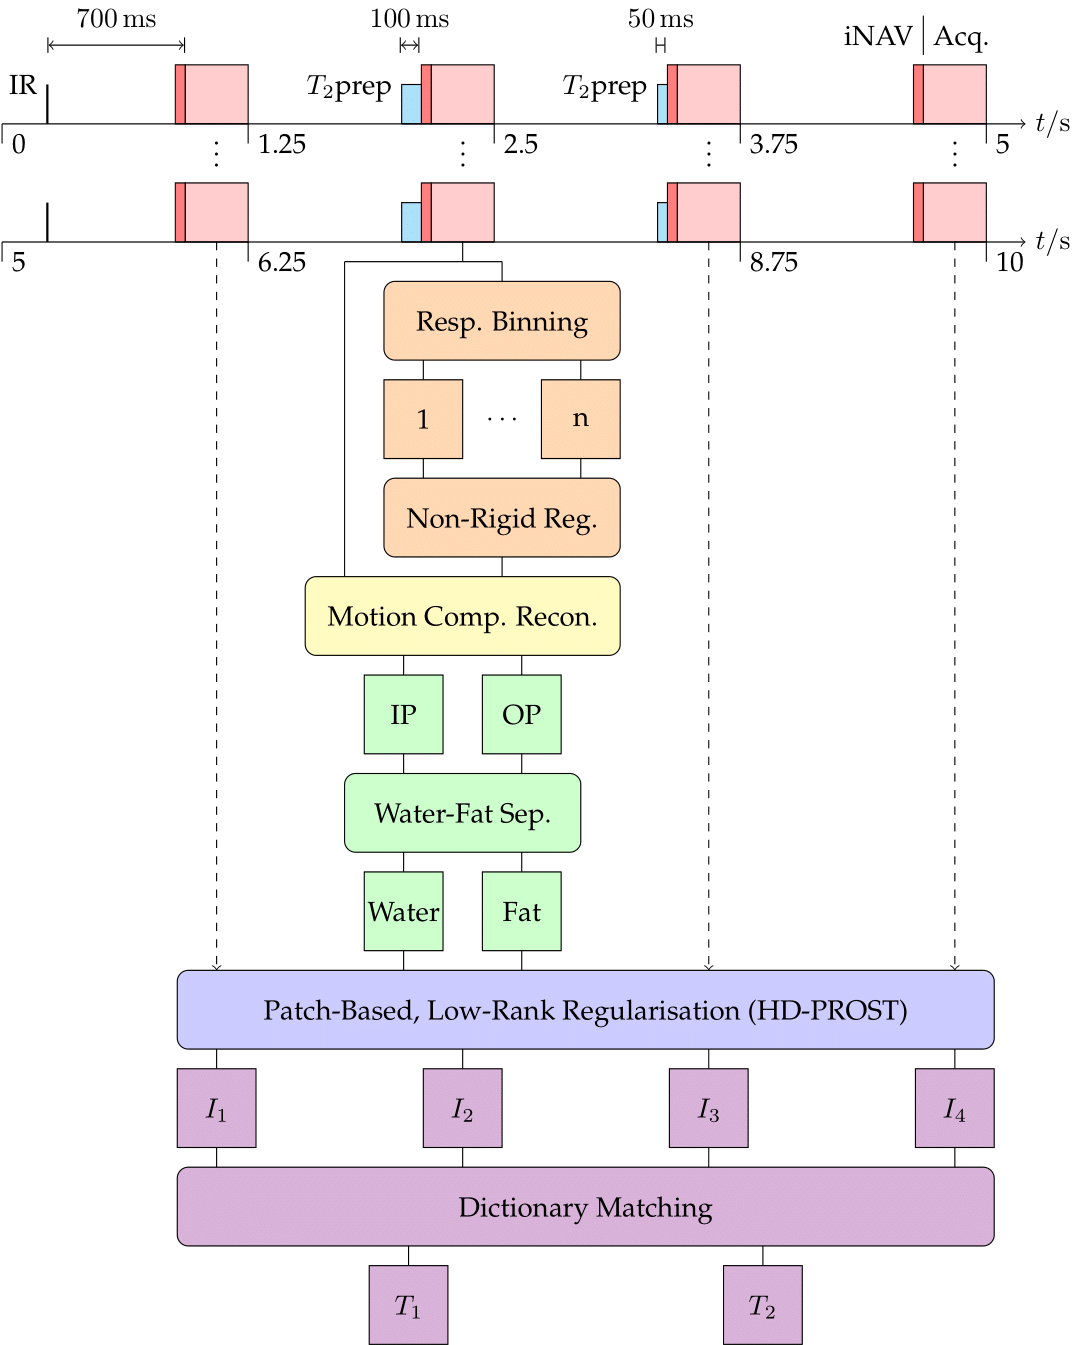
The pipeline of the proposed framework is shown in Fig. 1. A series of four interleaved acquisitions, with an undersampled, variable-density, spiral-like Cartesian trajectory6, and a two-echo gradient echo (GRE) readout, provide four in- (IP) and out-of-phase (OP) volumes. Inversion recovery (IR) and T2 preparation (T2prep) pulses encode each interleaved acquisition (I1,2,3,4) with mixed T1 and T2 contrast. Optimised 1D Bloch simulations were used in a Monte Carlo experiment to optimise the choice of preparations for greatest precision of the resulting maps. The resulting scheme—I1: IR (TI = 700 ms), I2: T2prep (100 ms), I3: T2prep (50 ms), I4: no preparation—offered significant improvement in simulations over the previously proposed 1.5T sequence4 for the tissues of the liver at 0.55T.2D image navigators (iNAVs)7 are acquired prior to the GRE imaging sequence of each spiral-like arm, to enable respiratory binning, intra-bin translational-motion correction, and subsequent inter-bin non-rigid-motion estimation8. After a non-rigid motion-corrected iterative SENSE reconstruction of the IP and OP volumes followed by Dixon water-fat separation, the four volumes are jointly denoised through a high-dimensionality, patch-based, low-rank regularisation (HD-PROST)9. T1 and T2 maps are then estimated from the four mixed-contrast volumes by matching the measured water signal to a precalculated dictionary, removing the need for pauses to allow magnetisation recovery. The fourth volume (with no preparation pulse) is used for fat-fraction mapping as it is furthest from the inversion pulse and hence exhibits the highest SNR and least T1 and T2 weighting.
The described research sequence was tested on a set of three phantoms (T1MES standardised 1.5T T1/T210, in-house T1/T2, in-house water/fat) and one healthy subject, on a 0.55T scanner (MAGNETOM Free.Max, Siemens Healthcare, Erlangen, Germany). Scan parameters included: two-echo bipolar GRE readout with flip angle = 8°, TE = 2.83 ms (pseudo IP) and 6.47 ms (OP), TR = 6.30 ms; resolution = 3 mm isotropic, undersampling factor = 4; iNAV flip angle = 3°, 14 single-echo readouts per iNAV; scan time ≈ 6.5 minutes. Conventional T1 and T2 maps (MOLLI and T2-prepared cardiac research sequences) were also acquired, along with a conventional Dixon sequence for fat-fraction estimation.
Results
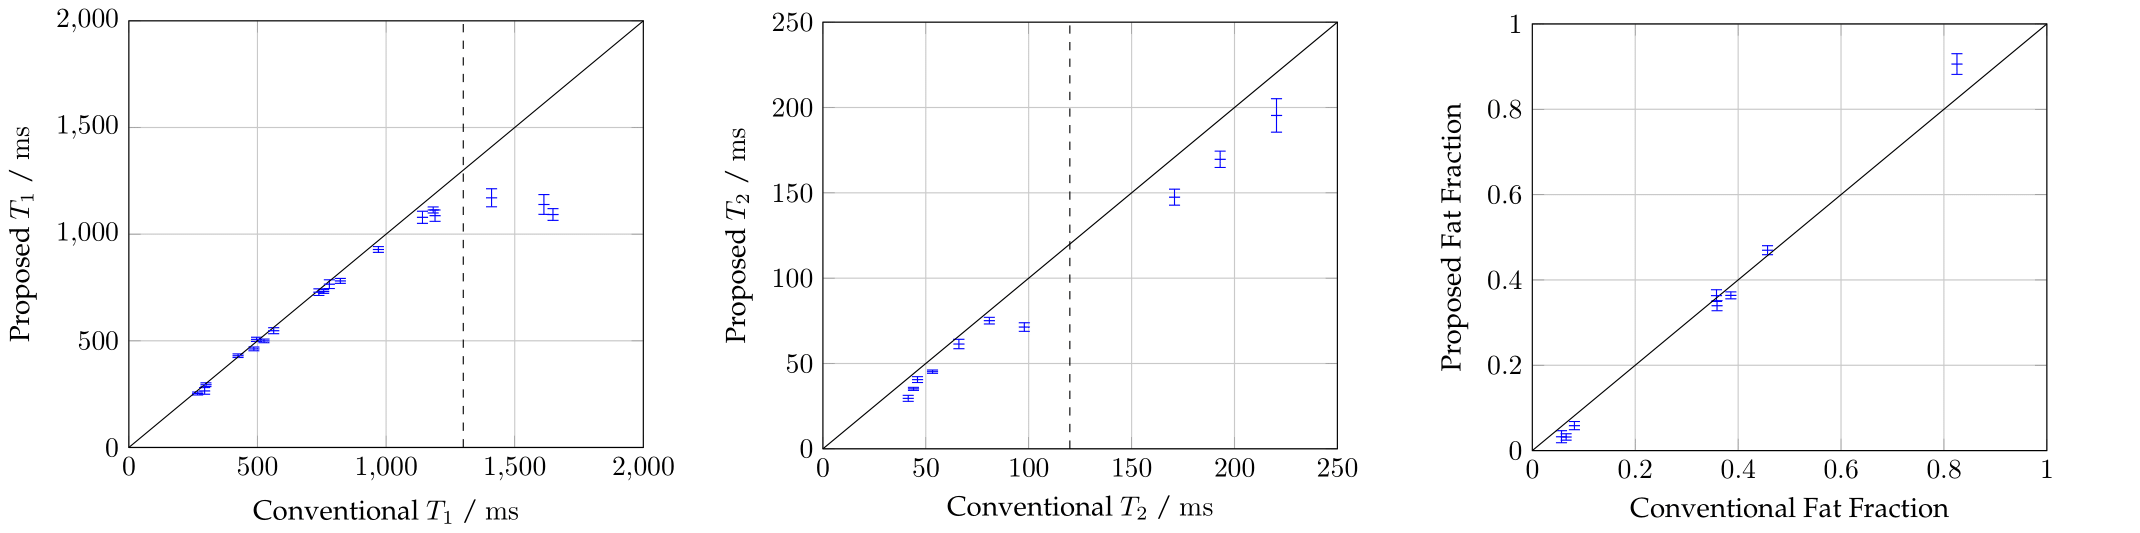
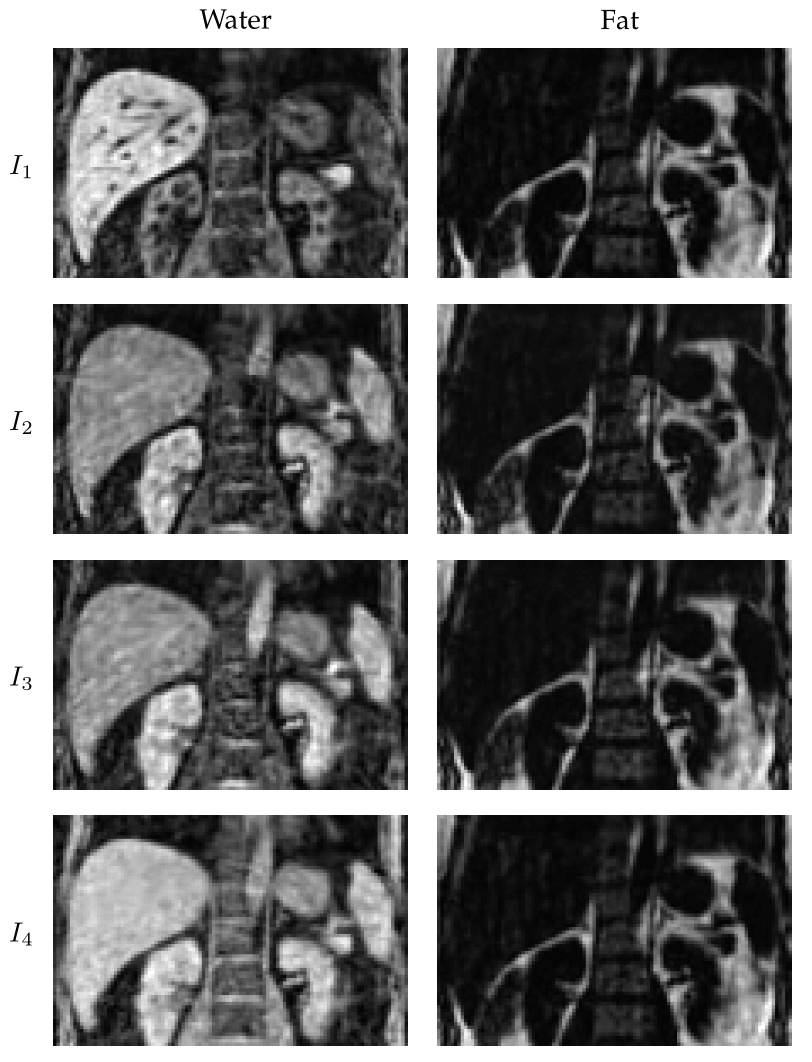
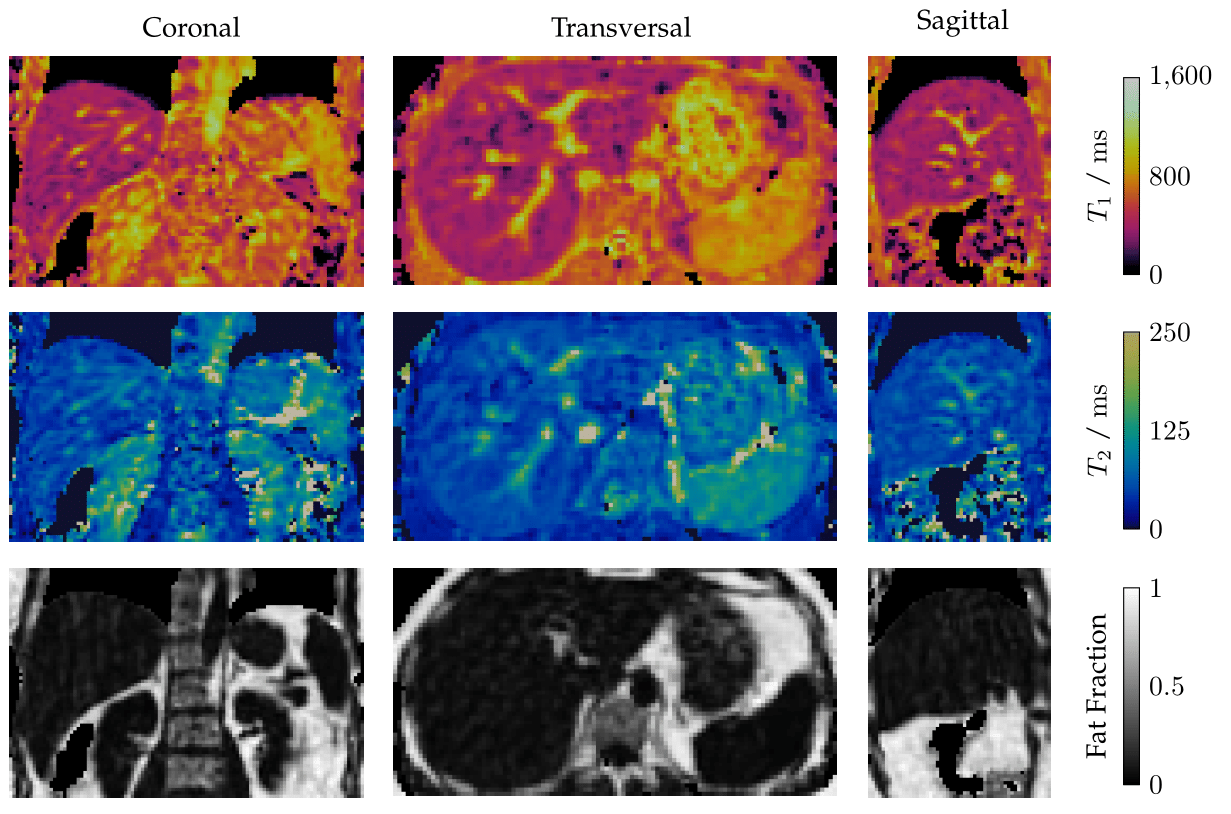
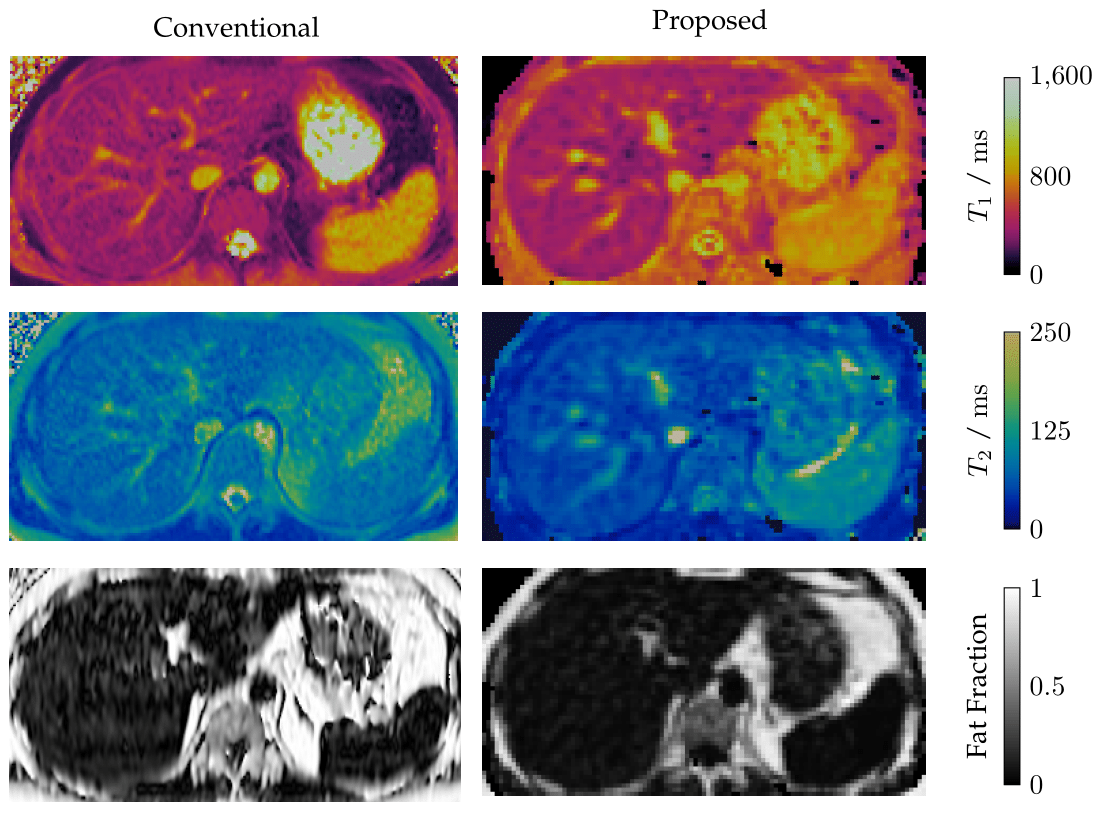
Phantom scans demonstrated good accuracy and precision for T1 and fat fraction within the design limits of the sequence, in comparison to 2D reference mapping sequences (Fig. 2) . These limits are taken from literature values for healthy and diseased liver tissue at 1.5 T1. T2 exhibited a negative bias of between 5 and 10 milliseconds, increasing to almost 30 milliseconds for long T2 values. Further investigation is needed to discern the cause of this offset. Initial in-vivo testing was also promising, with good image quality for the anatomical multi-contrast images (Fig 3.), and corresponding T1, T2, and fat fraction maps (Fig. 4) showing good direct qualitative comparison with conventional maps (Fig. 5). Values within the liver were within their expected values from literature, when accounting for the expected T1 dispersion11.Conclusions
Our preliminary results show promise for simultaneous, full-coverage T1, T2, and fat-fraction mapping of the liver at 0.55T, with the proposed non-rigid motion-corrected framework allowing a free-breathing scan in a clinically feasible scan time of less than seven minutes. High-dimensionality, patch-based, low-rank regularisation (HD-PROST) resulted in significant improvement of overall image quality and precision of T1, T2, and fat fraction mapping. Future work will include further optimisation of the framework for acquisition at 0.55T, aiming for a scan time of less than five minutes, as well as the addition of T2* mapping through an extended multi-echo GRE readout. This will be followed by testing in a larger cohort of healthy subjects and patients with liver disease.Acknowledgements
This work was supported by the following grants: (1) EPSRC P/V044087/1 and EP/S022104/1, (2) BHF programme grant RG/20/1/34802, (3) Wellcome/EPSRC Centre for Medical Engineering (WT 203148/Z/16/Z), (4) Millennium Institute for Intelligent Healthcare Engineering ICN2021_004, (5) FONDECYT 1210637 and 1210638, (6) IMPACT, Center of Interventional Medicine for Precision and Advanced Cellular Therapy, ANID FB210024.References
1. Heye T, Yang SR, Bock M, Brost S, Weigand K, Longerich T, Kauczor HU and Hosch W, ‘MR relaxometry of the liver: Significant elevation of T1 relaxation time in patients with liver cirrhosis,’ European radiology, vol. 22, no. 6, pp. 1224–1232, 2012.
2. Idilman IS, Keskin O, Celik A, Savas B, Halil El-han A, Idilman R and Karcaaltincaba M, ‘A comparison of liver fat content as determined by magnetic resonance imaging-proton density fat fraction and MRS versus liver histology in non-alcoholic fatty liver disease,’ Acta radiologica, vol. 57, no. 3, pp. 271–278, 2016.
3. Schaapman JJ, Tushuizen ME, Coenraad MJ and Lamb HJ, ‘Multiparametric MRI in patients with nonalcoholic fatty liver disease,’ Journal of Magnetic Resonance Imaging, vol. 53, no. 6, pp. 1623–1631, 2021.
4. Milotta G, Bustin A, Jaubert O, Neji R, Prieto C and Botnar RM, ‘3D whole-heart isotropic-resolution motion-compensated joint T1/T2 mapping and water/fat imaging,’ Magnetic Resonance in Medicine, vol. 84, no. 6, pp. 3009–3026, 2020.
5. Milotta G, Cruz G, Neji R, Prieto C and Botnar R, ‘3D isotropic-resolution non-rigid motion compensated liver T1, T2 and fat fraction mapping,’ in Proc. Intl. Soc. Mag. Reson. Med., vol. 29, 2021.
6. Prieto C, Doneva M, Usman M, Henningsson M, Greil G, Schaeffter T and Botnar RM, ‘Highly efficient respiratory motion compensated free-breathing coronary MRA using golden-step Cartesian acquisition,’ Journal of Magnetic Resonance Imaging, vol. 41, no. 3, pp. 738–746, 2015.
7. Henningsson M, Koken P, Stehning C, Razavi R, Prieto C and Botnar RM, ‘Whole-heart coronary MR angiography with 2D self-navigated image reconstruction,’ Magnetic resonance in medicine, vol. 67, no. 2, pp. 437–445, 2012.
8. Cruz G, Atkinson D, Henningsson M, Botnar RM and Prieto C, ‘Highly efficient nonrigid motion-corrected 3D whole-heart coronary vessel wall imaging,’ Magnetic resonance in medicine, vol. 77, no. 5, pp. 1894–1908, 2017.
9. Bustin A, Lima da Cruz G, Jaubert O, Lopez K, Botnar RM and Prieto C, ‘High-dimensionality undersampled patch-based reconstruction (HD-PROST) for accelerated multi-contrast MRI,’ Magnetic resonance in medicine, vol. 81, no. 6, pp. 3705–3719, 2019.
10. Captur G, Gatehouse P, Keenan KE et al., ‘A medical device-grade T1 and ECV phantom for global T1 mapping quality assurance—the T1 mapping and ECV standardization in cardiovascular magnetic resonance (T1MES) program,’ Journal of cardiovascular magnetic resonance, vol. 18, no. 1, pp. 1–20, 2016.
11. Bottomley PA, Foster TH, Argersinger RE and Pfeifer LM, ‘A review of normal tissue hydrogen NMR relaxation times and relaxation mechanisms from 1–100 MHz: Dependence on tissue type, NMR frequency, temperature, species, excision, and age,’ Medical physics, vol. 11, no. 4, pp. 425–448, 1984.
Figures