0054
Deep learning improves accuracy of proton-density fat fraction estimation from In-phase and out-of-phase T1-weighted MRI1Radiology, Stanford, Palo Alto, CA, United States, 2Radiology, University of Washington Medicine, Seattle, WA, United States, 3Department of Mathematics and Statistics, San Diego State University, San Diego, CA, United States, 4Radiology, UC San Diego, La Jolla, CA, United States, 5Department of Hepatology, UC San Diego, La Jolla, CA, United States, 6Texas Biomedical Research Institute, San Antonio, TX, United States, 7UC San Diego, La Jolla, CA, United States
Synopsis
Keywords: Liver, Quantitative Imaging, Fat, Data analysis
Proton density fat fraction (PDFF) is an established quantitative-imaging-biomarker for hepatic -fat quantification, but typically requires specialized confounder-corrected chemical-shift-encoded (CSE) magnetic-resonance-imaging (MRI) pulse sequences. We developed and assessed the feasibility of deep learning to infer hepatic PDFF maps from conventional T1-weighted-in-and-opposed-phase (T1w-IOP) MRI. Using PDFF maps reconstructed from CSE-MRI as reference, we trained a convolutional-neural-network (CNN) to infer voxel-wise PDFF maps from T1w-IOP MRI. The CNN was evaluated using both internal and external test datasets. Participant-level median CNN-inferred-PDFF were compared with reference CSE-MRI using linear regression, intraclass correlation, and Bland-Altman analysis. Median CNN-inferred PDFF agreed closely with reference CSE-MRI PDFF.INTRODUCTION
Proton density fat fraction (PDFF) is an established quantitative imaging biomarker for hepatic fat quantification, but typically requires specialized confounder-corrected chemical-shift-encoded (CSE) magnetic resonance imaging (MRI) pulse sequences [1]–[3]. Alternatively, hepatic fat quantification can be assessed by calculating the signal fat fraction (FF) from conventional T1-weighted in-and-opposed phase (IOP) fast spoiled gradient-recalled-echo (GRE) images, which are routine in virtual all abdominal MR protocols at most institutions [4]. However, this so-called 2-point Dixon method is T1 weighted and so is confounded by T1 bias; uses only two echoes and cannot simultaneously correct for T2*(1/R2*) effects[5], [6]. Recently, deep learning in the form of convolutional neural networks (CNNs) has demonstrated great potential in many medical imaging applications [7]–[9]. We hypothesized that CNNs could infer hepatic PDFF from conventional T1-weighted IOP images. The purposes of this study were to 1) evaluate the feasibility and accuracy of CNN-inferred PDFF, 2) compare the accuracy of CNN-inferred PDFF versus FF calculated from the currently available 2-point Dixon method for fat quantification.METHODS
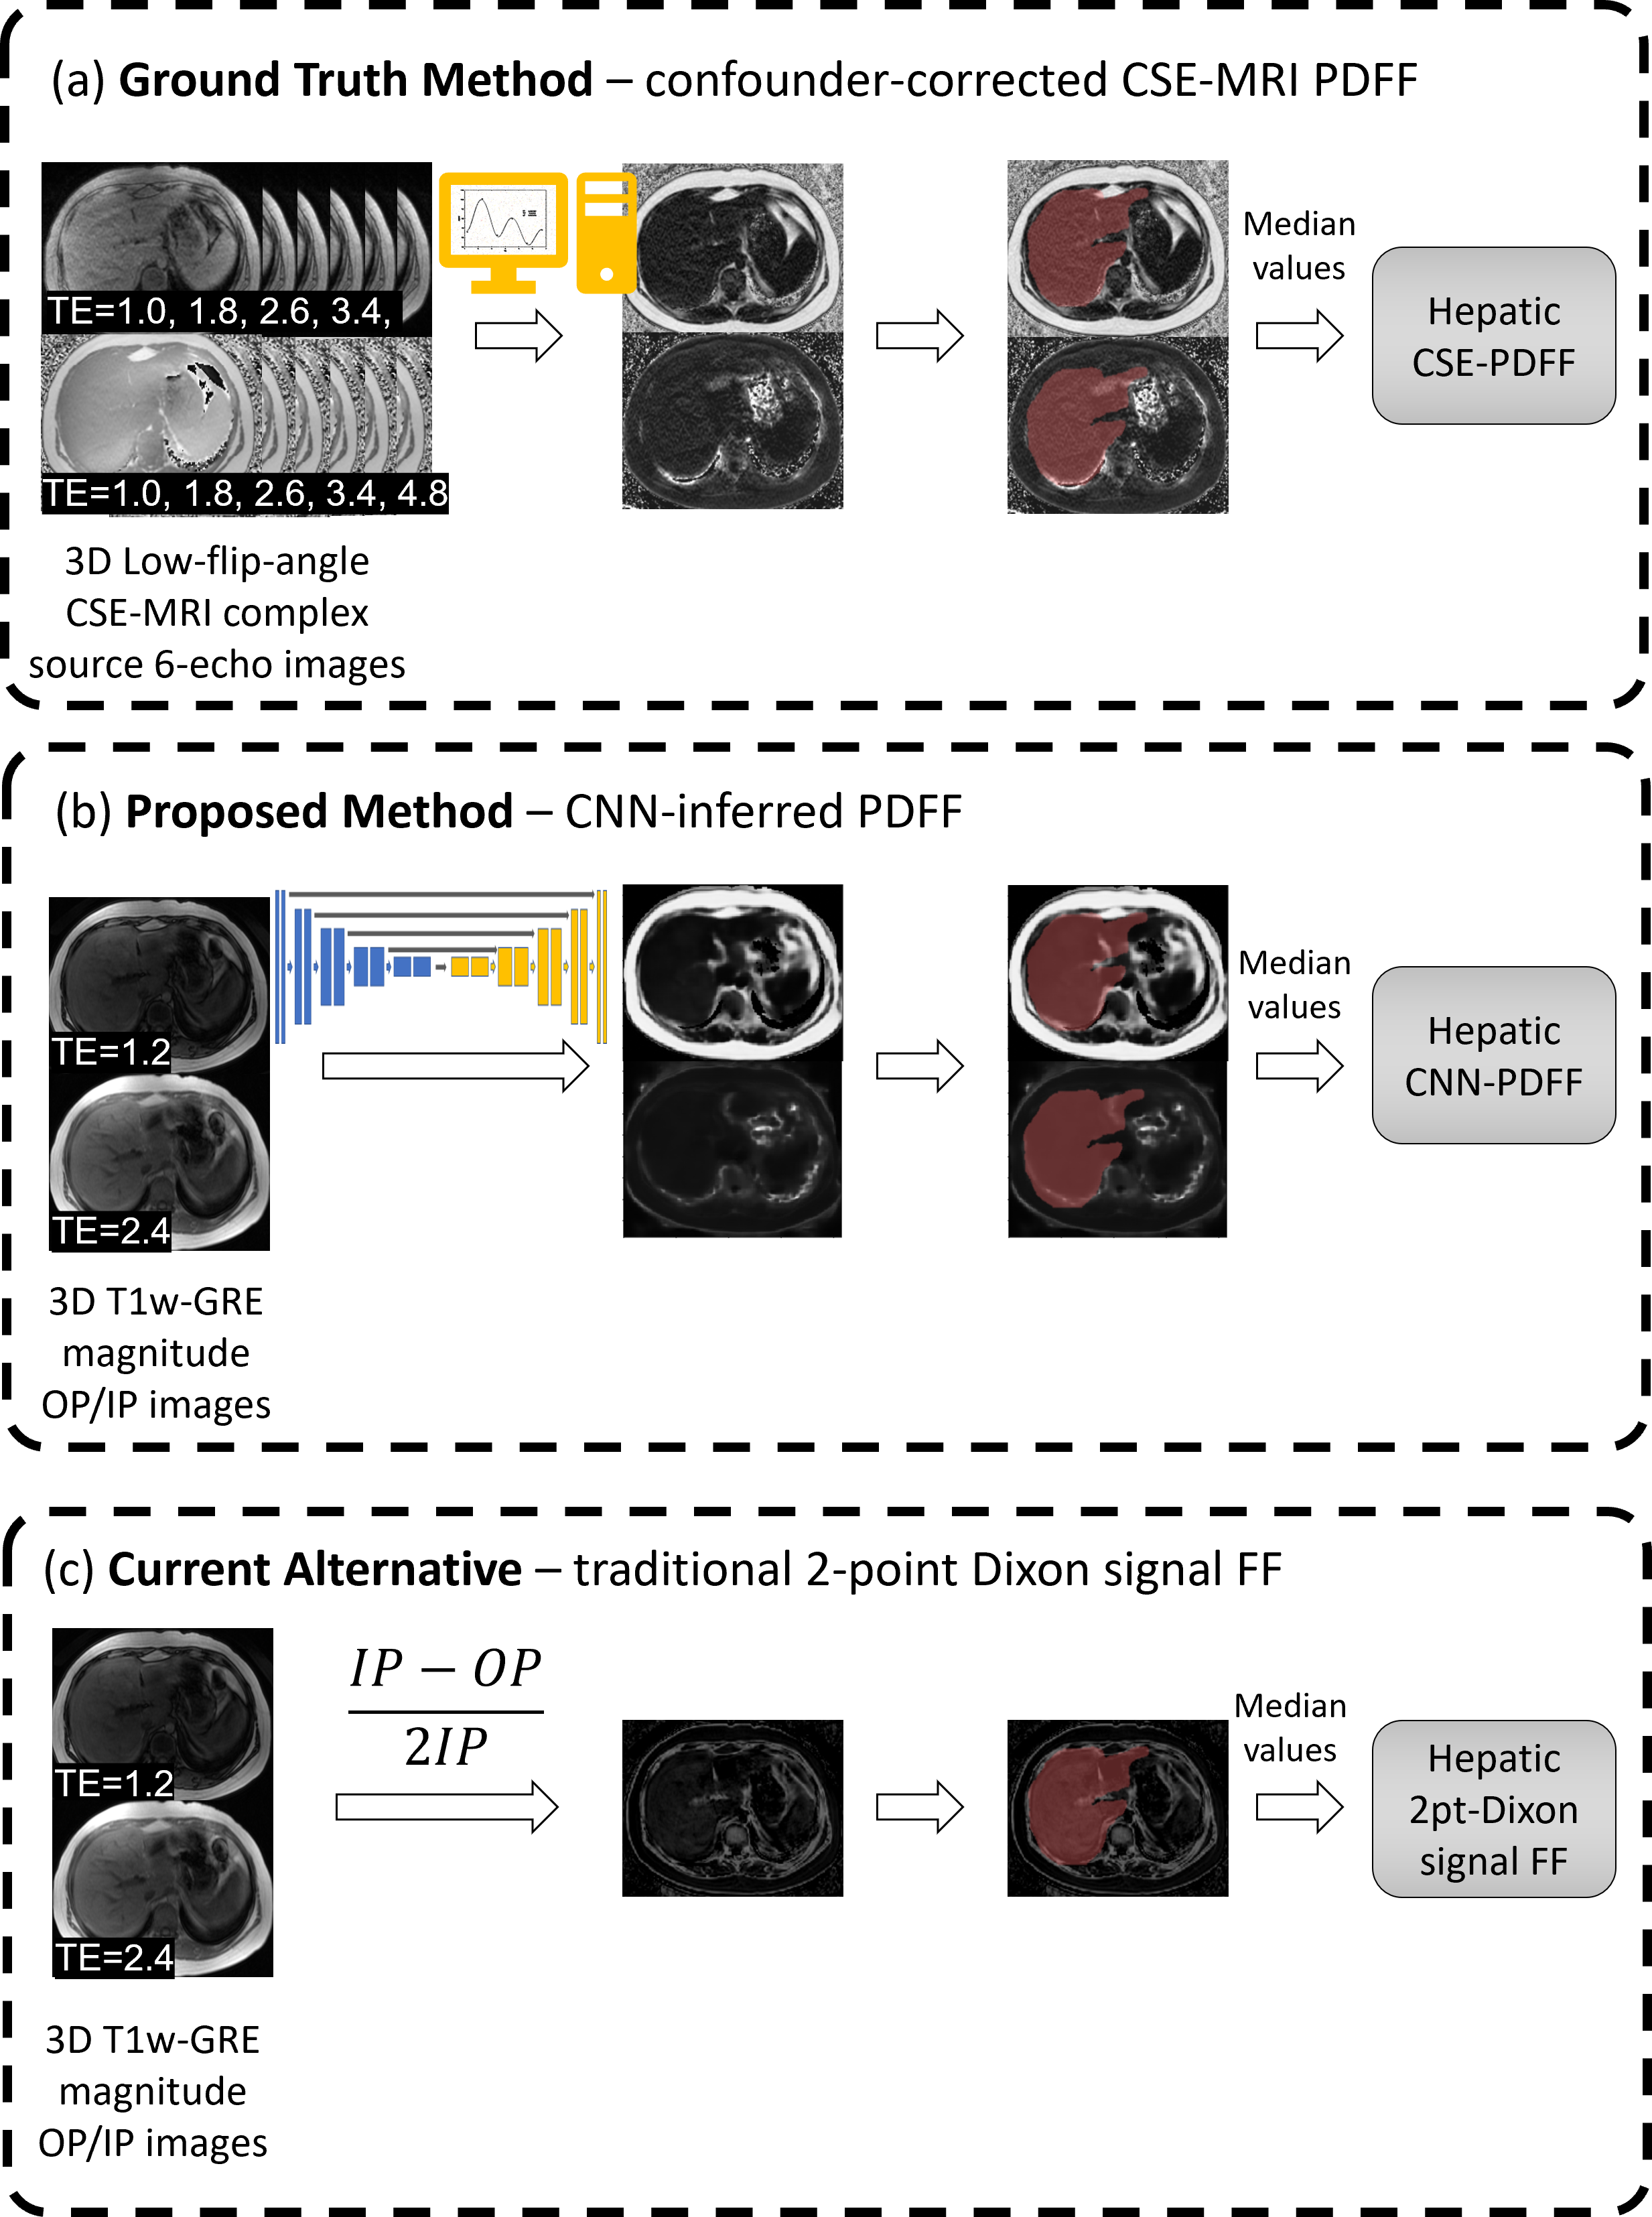
We retrospectively curated 292 liver MRI exams performed from 2017 to 2020 for hepatic fat quantification as part of a two-site prospectively designed research study. Exams included CSE-MRI and T1w-IOP MRI. Exams were randomly split into training (75%, n=216) and internal test (25%, n=76) set. Additionally, 198 MR exams pooled from research studies distinct from the initial dataset were used as external test dataset. Using PDFF maps reconstructed from CSE-MRI as reference, we trained a convolutional neural network (CNN) to infer voxel-wise PDFF maps from T1w-IOP MRI. Three different sets of fat fraction parametric maps were generated, the reference CSE-PDFF maps, 2-point Dixon signal FF maps, and CNN-inferred PDFF maps (Figure 1). Reference CSE-R2* maps from CSE-MRI were also generated. Parametric maps were analyzed automatically. For each participant, a previously developed liver segmentation algorithm was used to automatically segment the liver from each parametric map [10]. Median values from all voxels contained within the liver segmentation mask were computed. Four sets of median values were recorded for each participant: CSE-PDFF, CSE-R2*, 2-point Dixon signal FF, and CNN-inferred PDFF. We assessed participant-level agreement of median hepatic PDFF values inferred from the CNN model (CNN-inferred PDFF) and by the reference method (CSE-PDFF) by computing linear regression, intraclass correlation (ICC), and Bland-Altman analyses. In a similar manner, we assessed agreement of median hepatic signal FF estimated from 2-point Dixon method (2-point Dixon FF) and reference CSE-PDFF.RESULTS
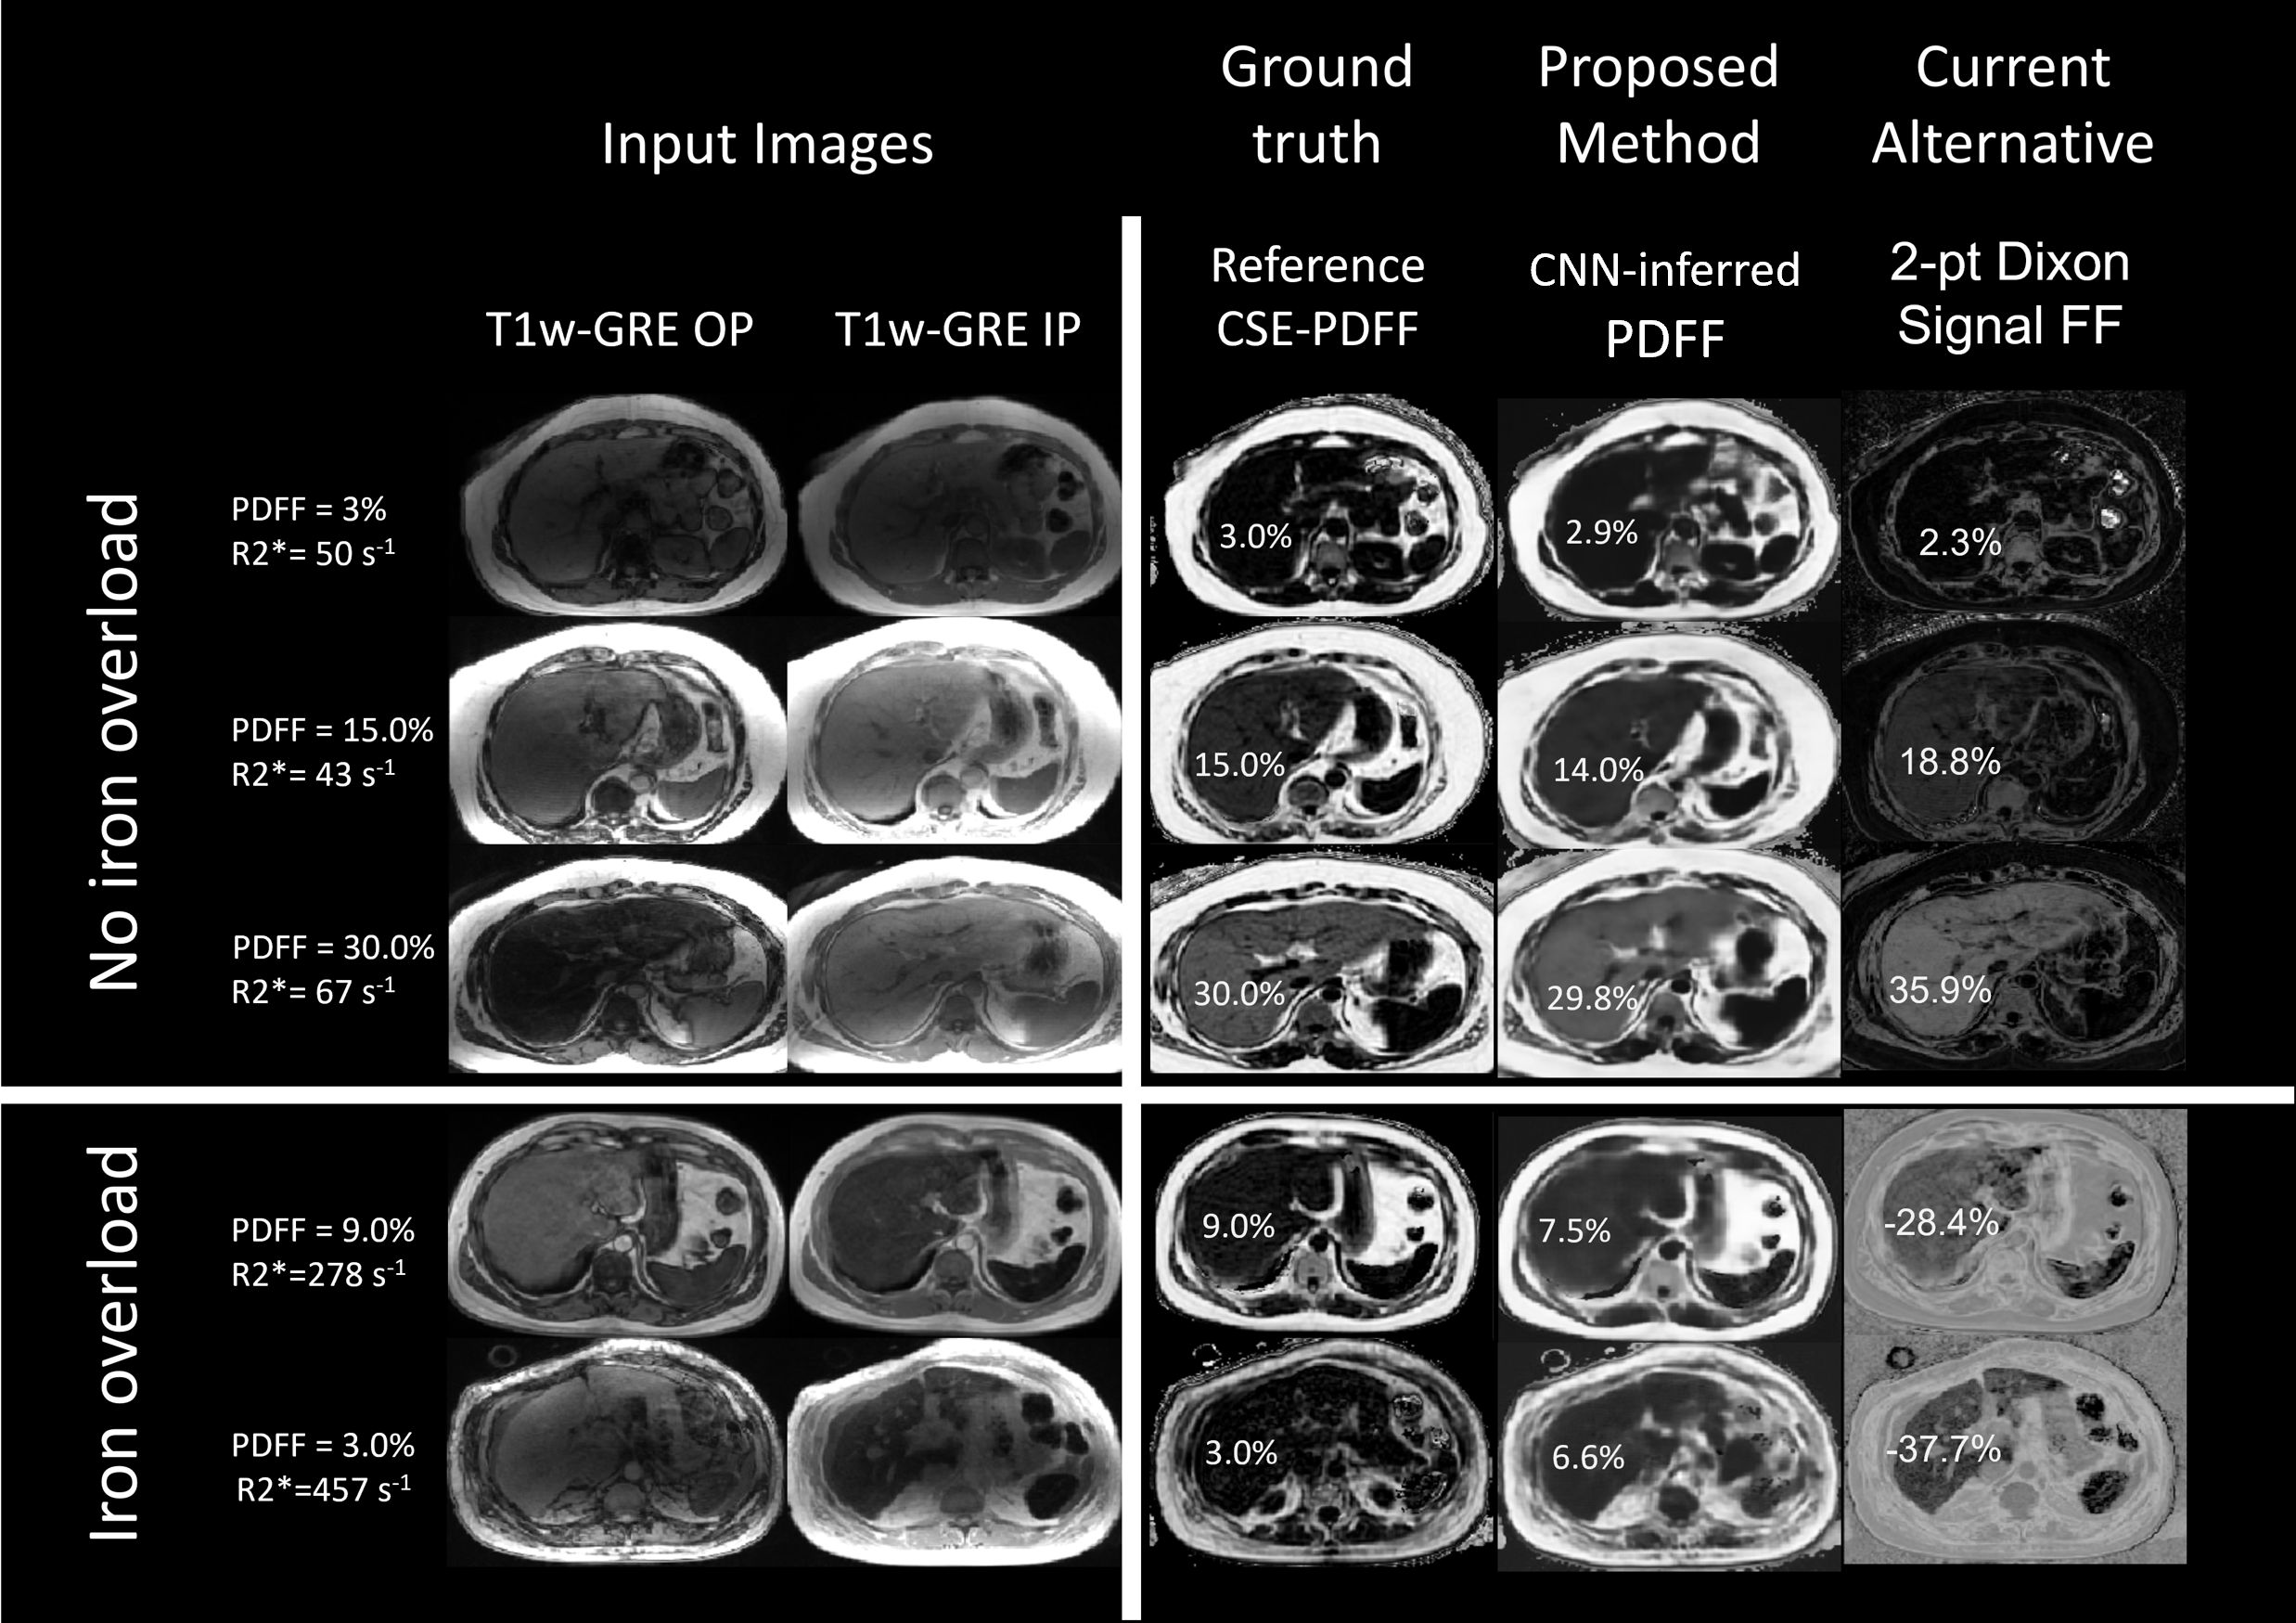
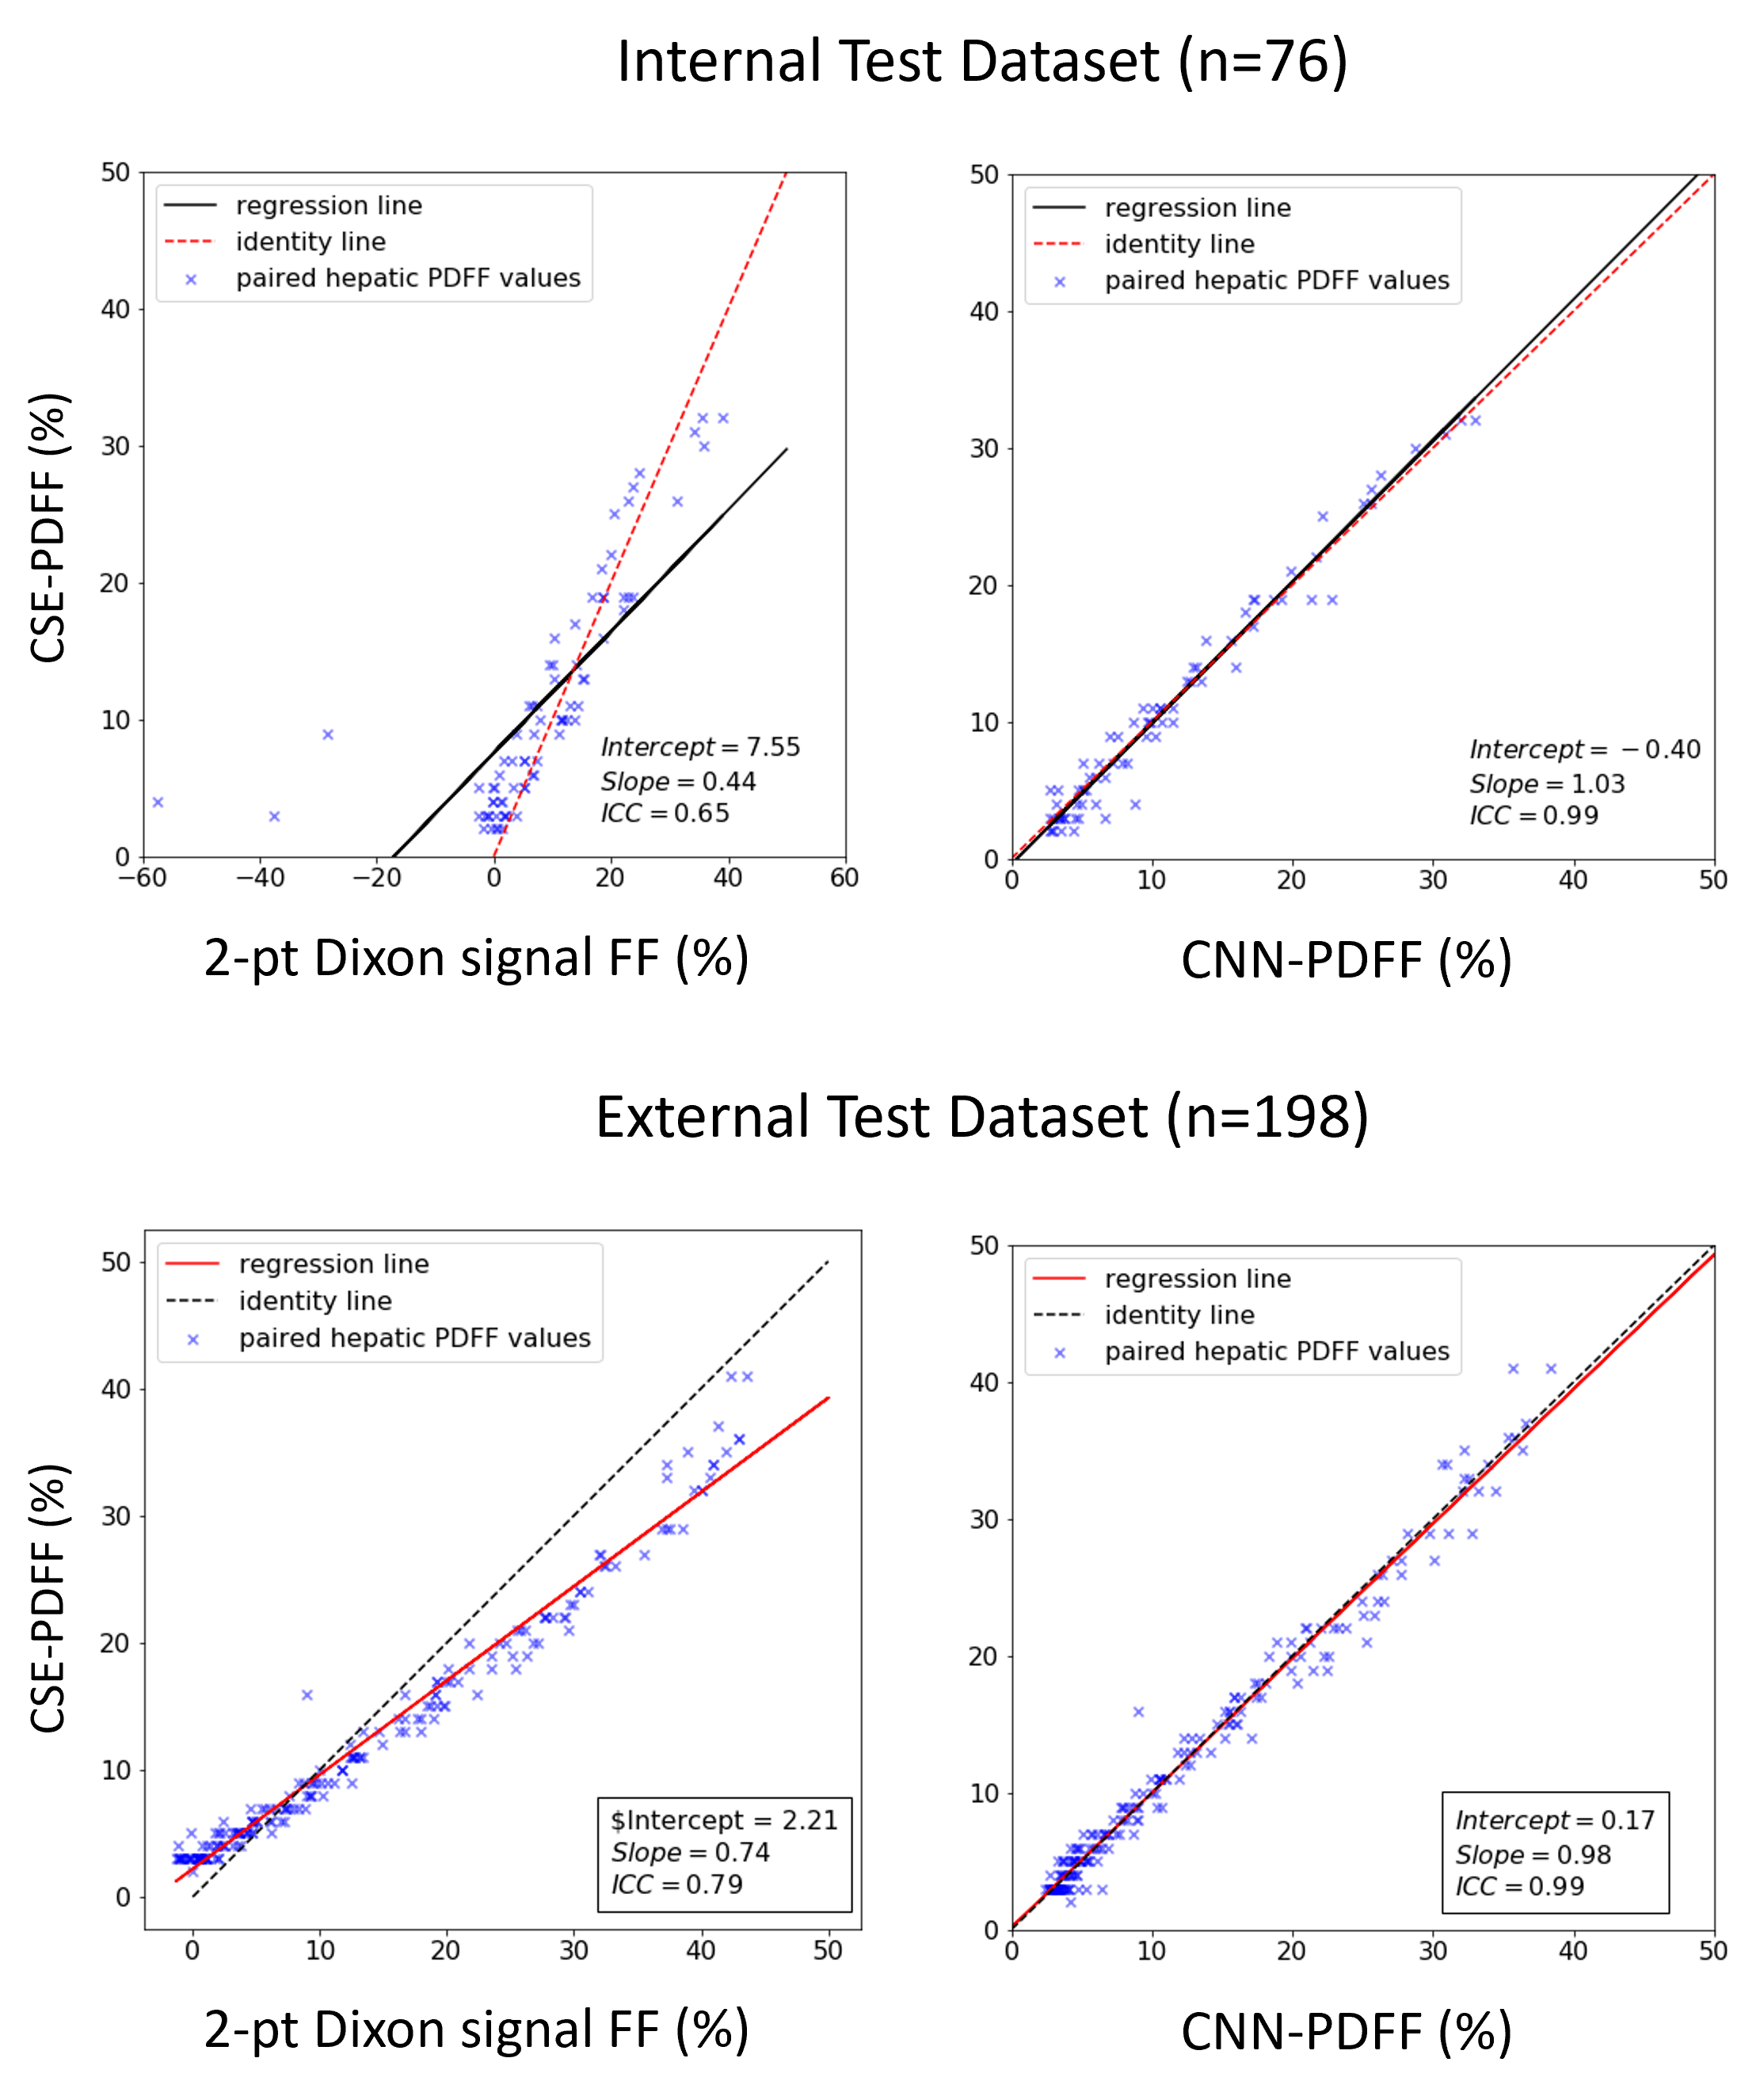
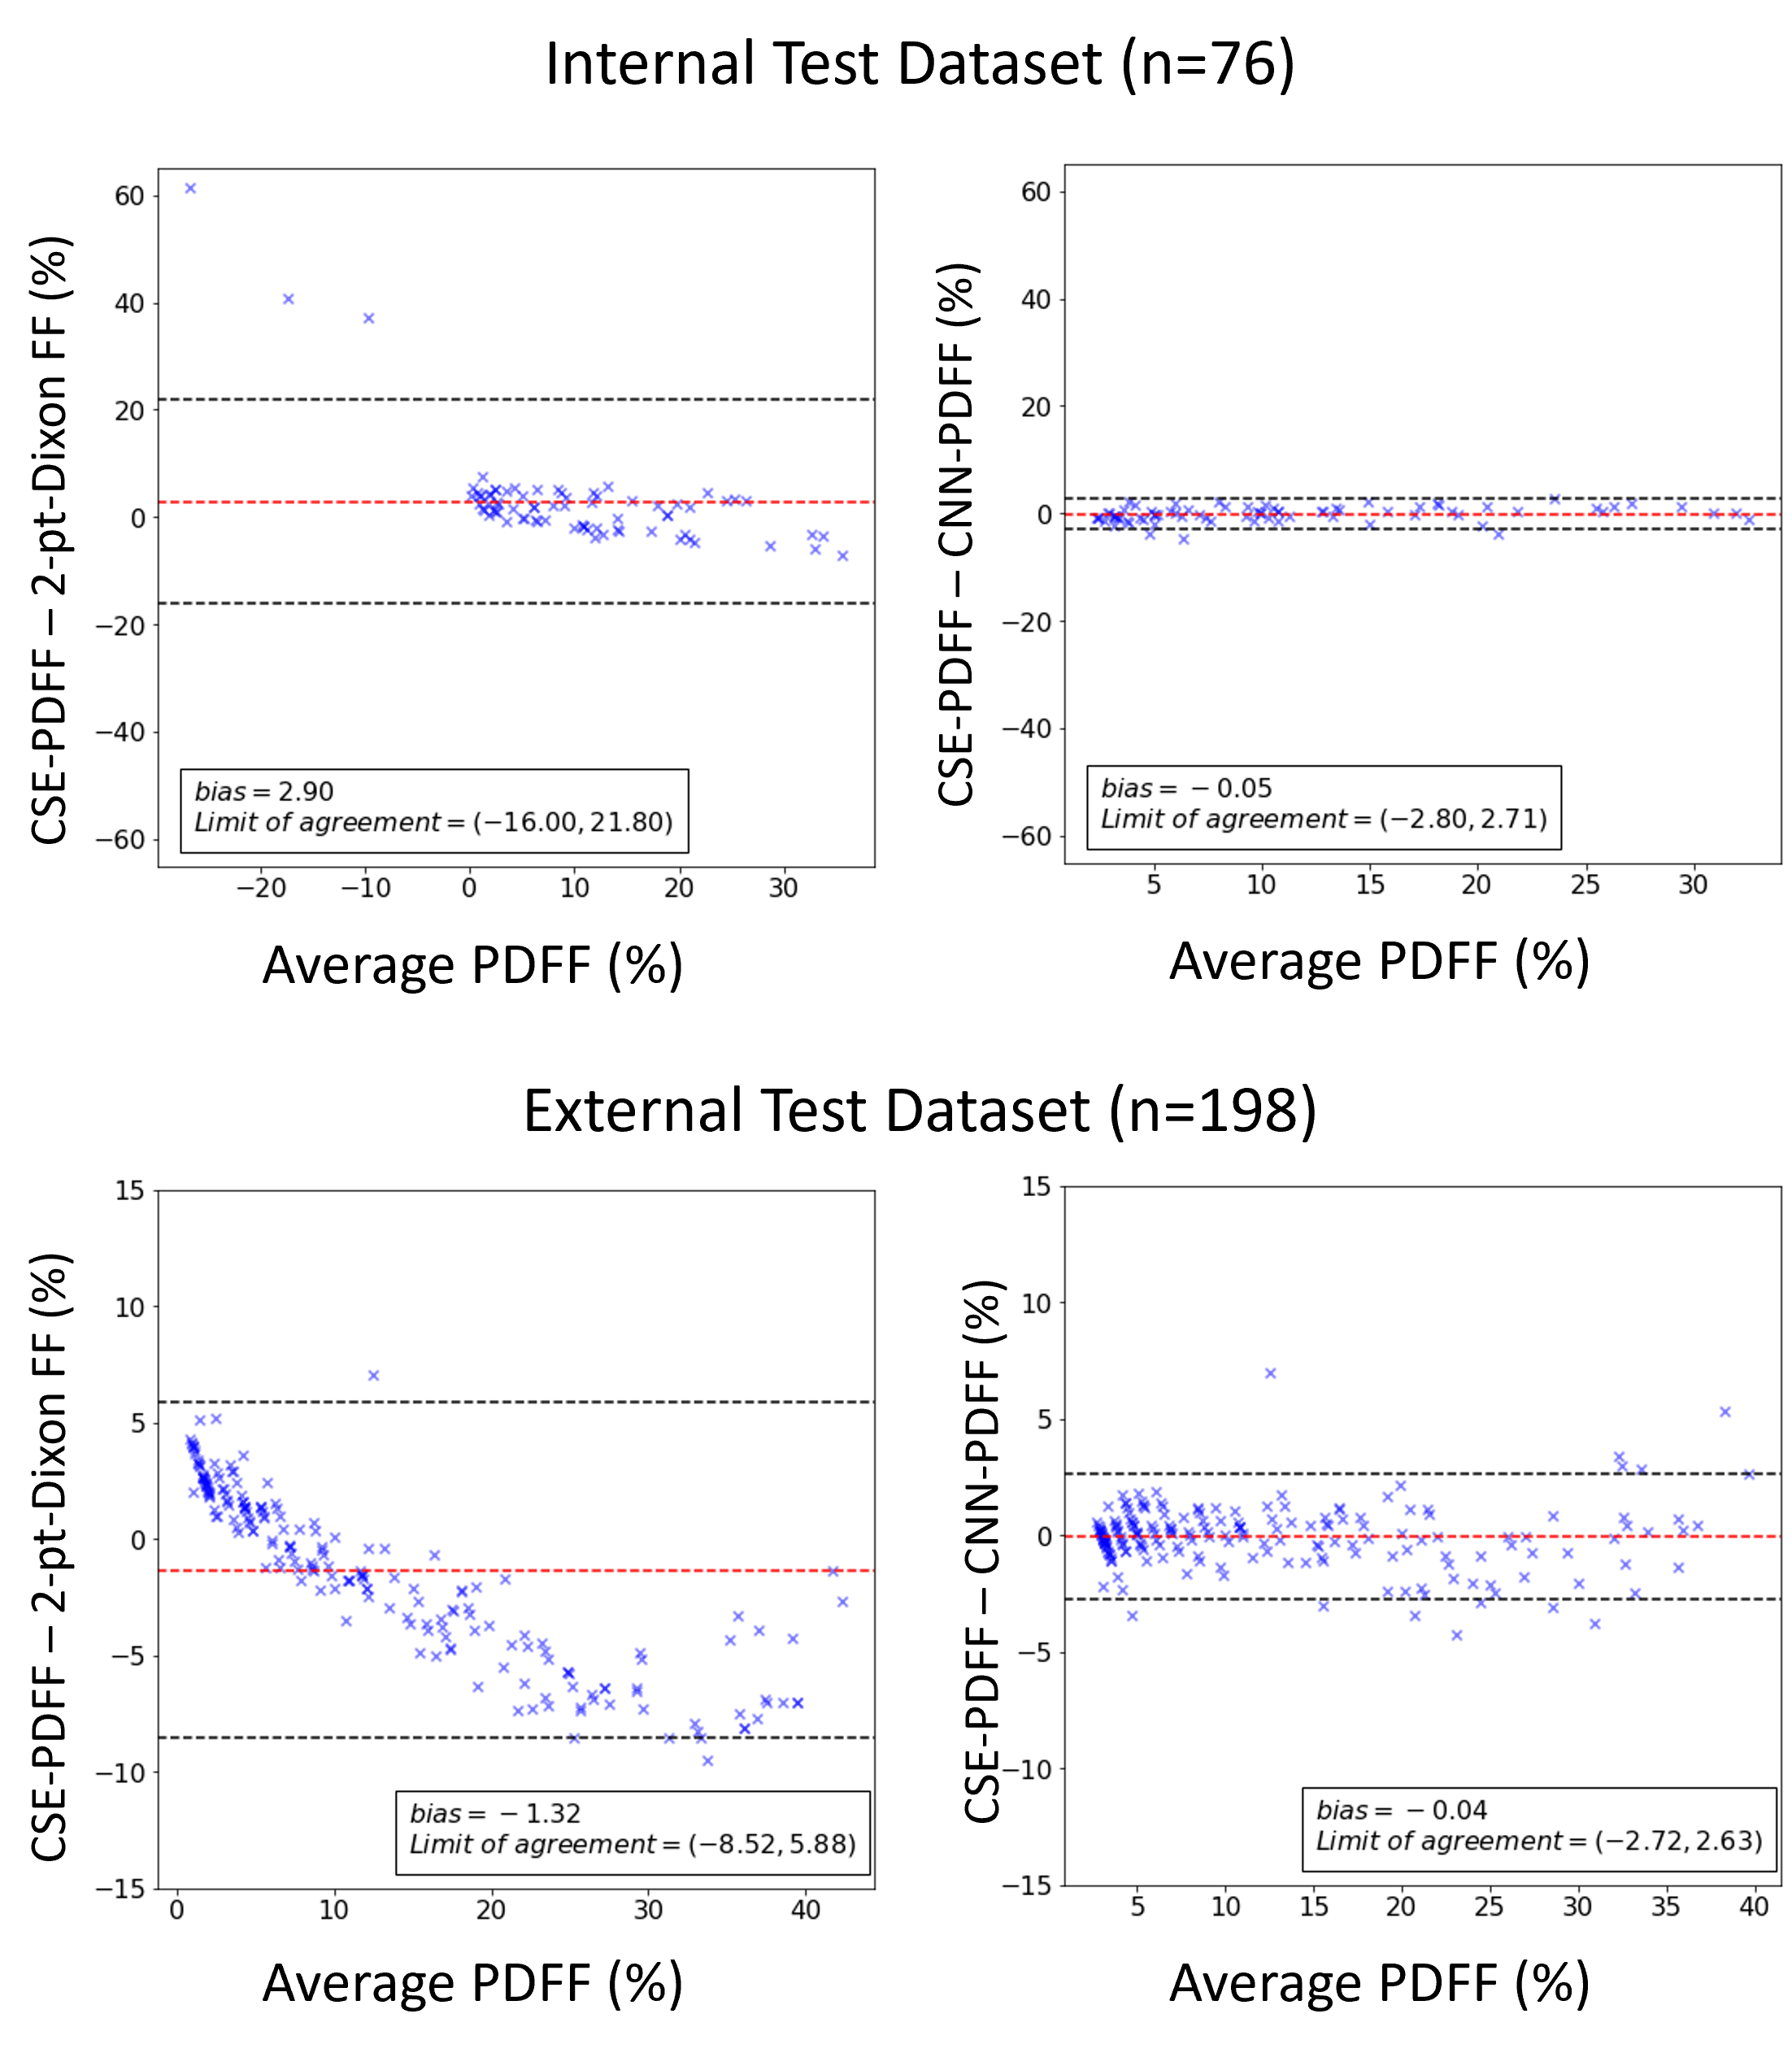
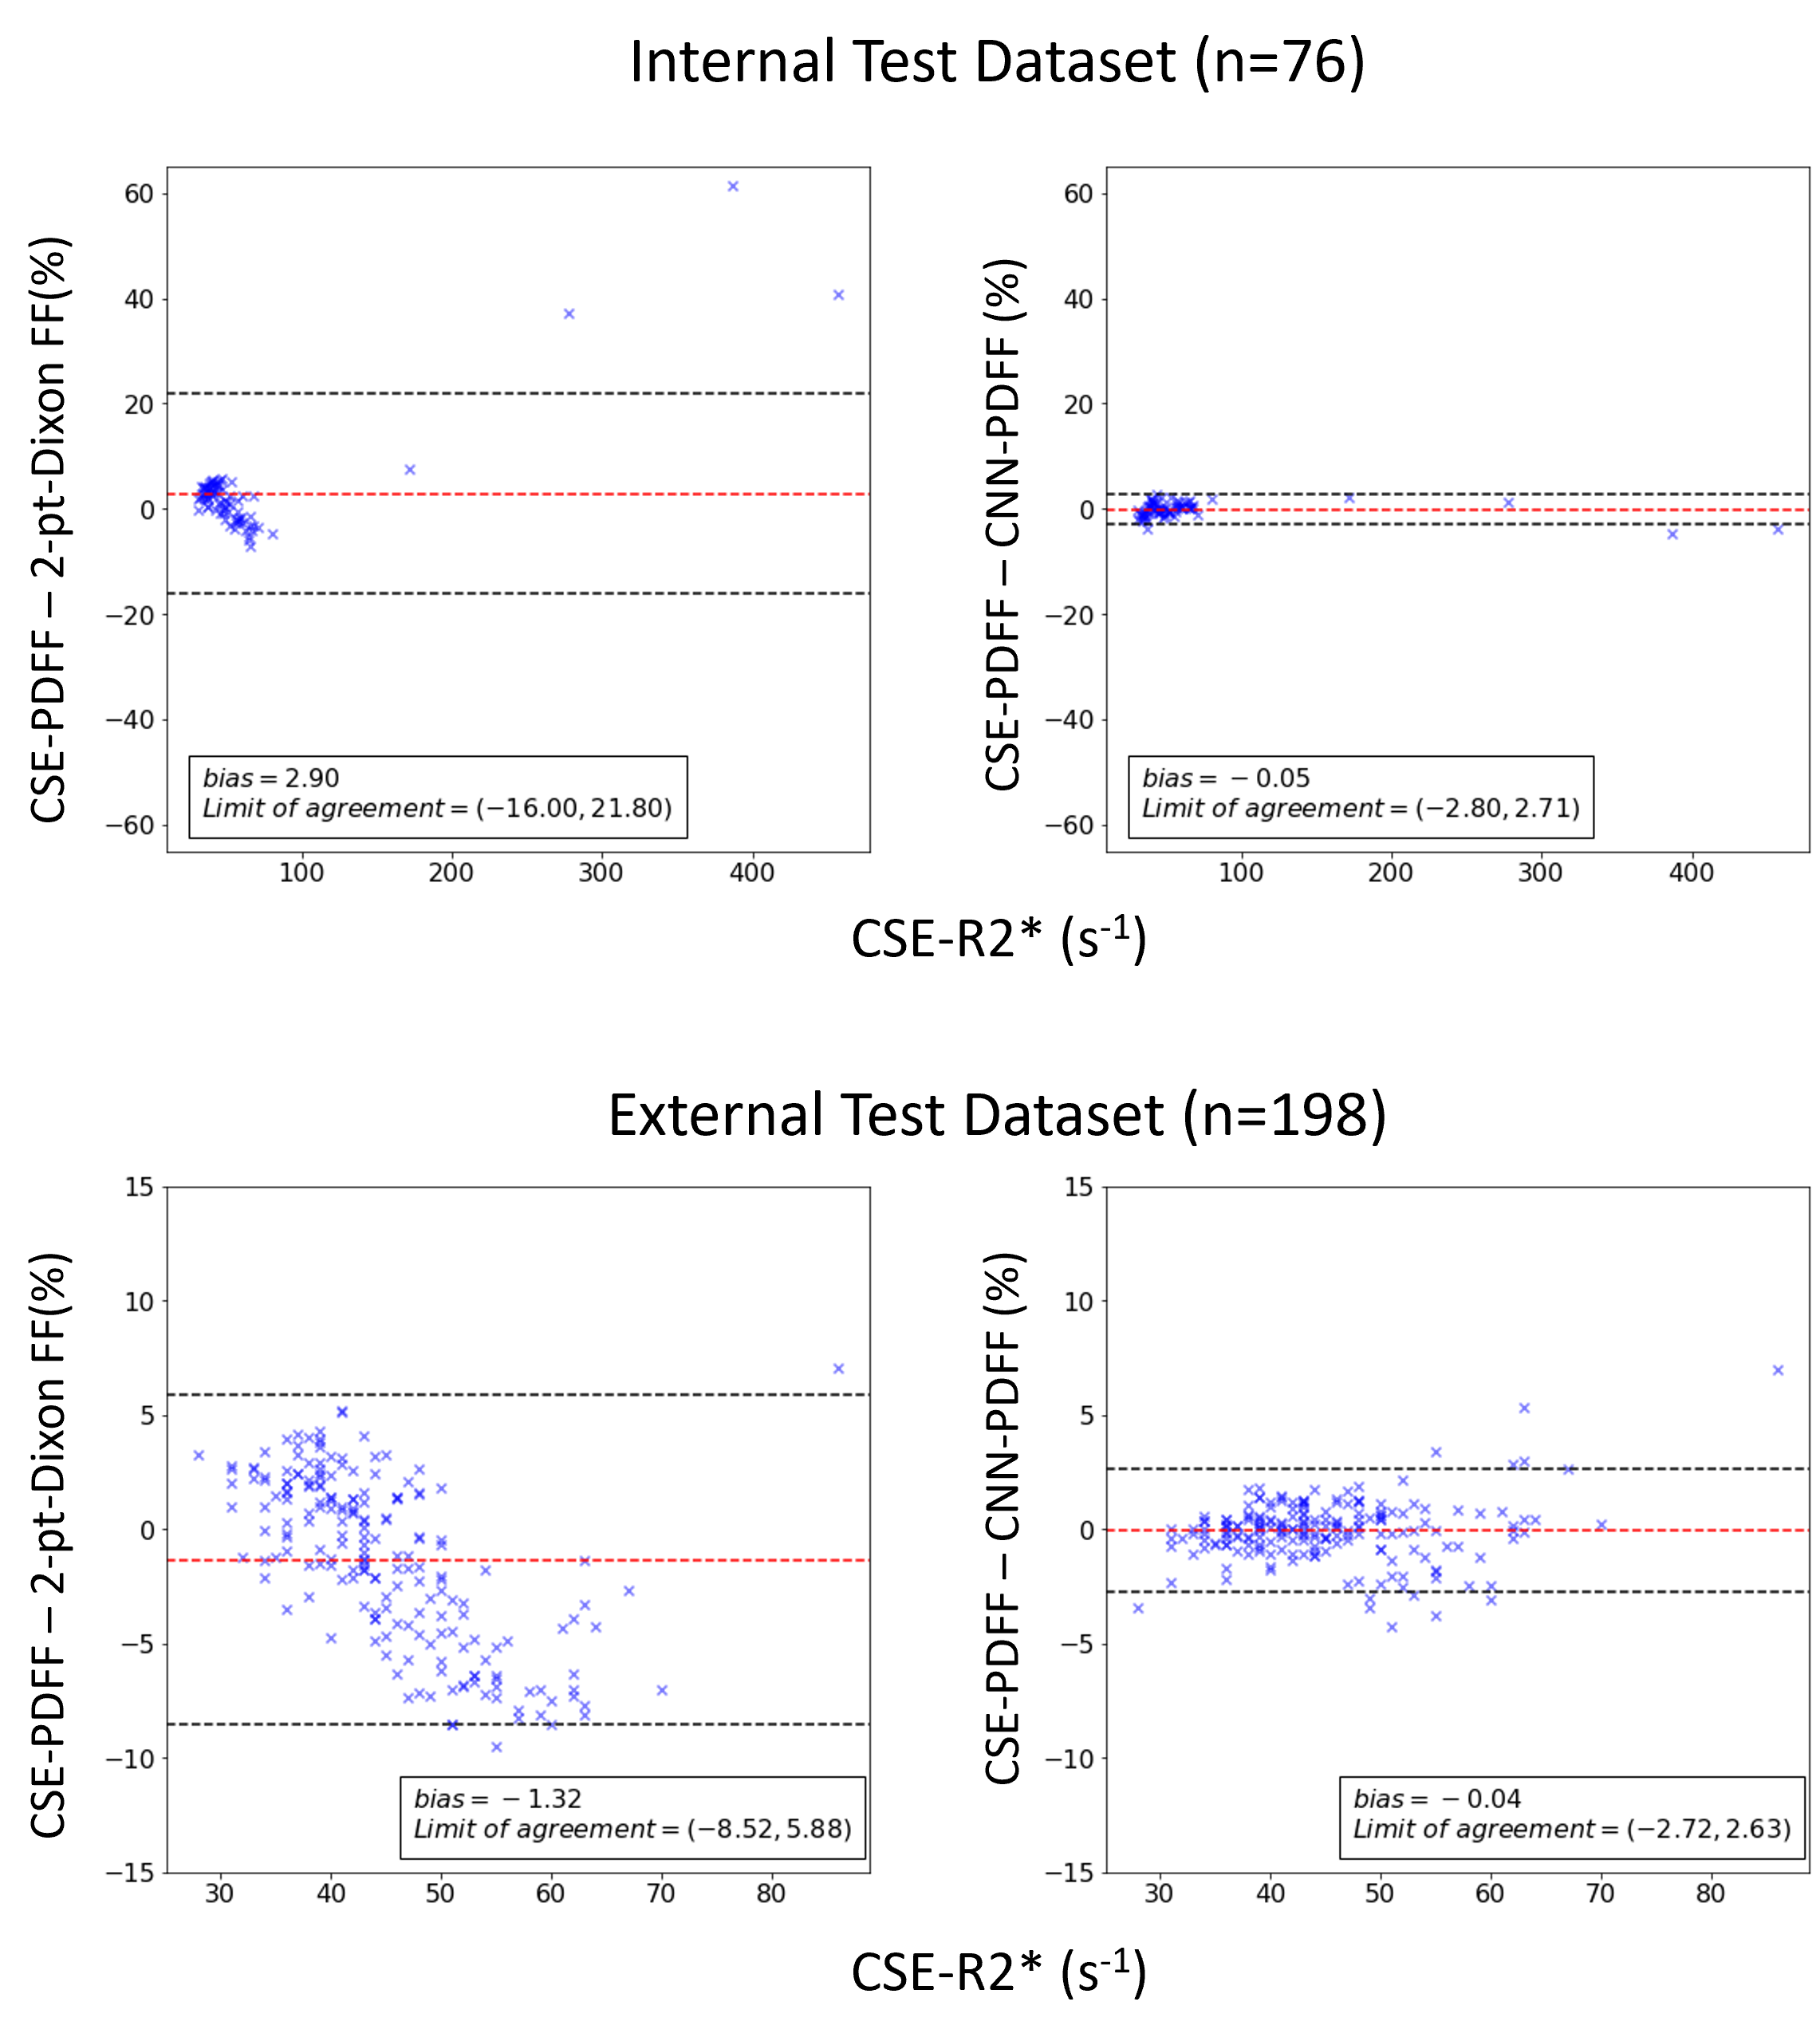
Median reference CSE-PDFF ranged from 1% to 32% for the internal test dataset and 1% to 45% for the external test dataset. Figure 2 shows examples of input images (T1w-GRE OP/IP), reference CSE-PDFF maps, CNN-inferred PDFF maps, and 2-point Dixon signal FF maps. For internal test dataset, agreement was modest for the 2-point Dixon signal FF (ICC=0.65, bias = -2.9%, LOA = [-16.0%, 21.8%], Figure 2 and 3). Signal FFs from 2-point Dixon tends to overestimate PDFF when R2* values are small and underestimate PDFF when R2* values are large (Figure 5). In addition, 14/76 (18%) participants had nonsensical negative signal FFs in the internal test dataset (Figure 3). The 2-point Dixon method tends to produce large nonsensical negative signal FFs when hepatic CSE-R2* > 200 s-1; Figure 5). On the contrary, agreement was close for CNN-inferred PDFF without significant bias (ICC=0.99, bias = 0.05%, LoA = [-2.80%, 2.71%]) over a wide range of R2*. Similar trends were observed in the external dataset. Agreement was modest for the 2-point Dixon signal FF (ICC=0.74, bias = -1.32, LOA = [-8,5%, 5.9%]), while agreement was close for CNN-inferred PDFF (ICC=0.99, bias = -0.04%, LoA = [-2.72%, 2.63%]) (Figure 4). R2*-dependent PDFF estimation bias seen in 2-point Dixon was not observed in the CNN-based method.DISCUSSION
For hepatic fat quantification, 2-point Dixon signal FF is known to introduce non-negligible bias with respect to reference CSE-PDFF that depends nonlinearly on CSE-R2*(1/T2*) and CSE-PDFF [11]. Thus, 2-point Dixon signal FF for hepatic fat quantification is particularly problematic in patients with iron overload, which increases R2* and causes significant errors in hepatic fat fraction estimation. On the contrary, our study suggested that CNN-inferred PDFF closely agreed with reference CSE-PDFF even for cases where CSE-R2* values are high (e.g., R2* > 200 s-1), although the current study is underpowered to perform this assessment thoroughly due to the few cases with high R2* values. The CNN-based method offers a convenient way to quantify hepatic fat when CSE-MRI is not available or not indicated prospectively in an imaging study. Almost all clinical abdominal MR exams include T1w-IOP MRI sequences. The ubiquity of these sequences will potentially allow wider adoption of hepatic PDFF as a quantitative imaging biomarker for hepatic fat assessment, and therefore offers expanded opportunity to screen patients for hepatic steatosis.CONCLUSION
Deep learning inference of PDFF from conventional T1w-IOP MRI is feasible. CNN-inferred PDFF agreed closely with reference PDFF in both internal and external test data.Acknowledgements
This project was supported, in part, by T32EB005970.References
[1] J. Ma, “Dixon techniques for water and fat imaging,” J. Magn. Reson. Imaging JMRI, vol. 28, no. 3, pp. 543–558, Sep. 2008, doi: 10.1002/jmri.21492.
[2] G. H. Glover and E. Schneider, “Three-point Dixon technique for true water/fat decomposition with B0 inhomogeneity correction,” Magn. Reson. Med., vol. 18, no. 2, pp. 371–383, Apr. 1991, doi: 10.1002/mrm.1910180211.
[3] S. B. Reeder et al., “Iterative decomposition of water and fat with echo asymmetry and least-squares estimation (IDEAL): application with fast spin-echo imaging,” Magn. Reson. Med., vol. 54, no. 3, pp. 636–644, Sep. 2005, doi: 10.1002/mrm.20624.
[4] “Body MR imaging: Sequences we use and why.” https://appliedradiology.com/articles/body-mr-imaging-sequences-we-use-and-why (accessed Nov. 24, 2019).
[5] E. Gong, J. M. Pauly, M. Wintermark, and G. Zaharchuk, “Deep learning enables reduced gadolinium dose for contrast-enhanced brain MRI,” J. Magn. Reson. Imaging, vol. 48, no. 2, pp. 330–340, 2018, doi: 10.1002/jmri.25970.
[6] S. B. Reeder and C. Sirlin, “Quantification of Liver Fat with Magnetic Resonance Imaging,” Magn. Reson. Imaging Clin. N. Am., vol. 18, no. 3, pp. 337–357, Aug. 2010, doi: 10.1016/j.mric.2010.08.013. [7] H. Chen et al., “Low-Dose CT With a Residual Encoder-Decoder Convolutional Neural Network,” IEEE Trans. Med. Imaging, vol. 36, no. 12, pp. 2524–2535, 2017, doi: 10.1109/TMI.2017.2715284.
[8] M. Ran et al., “Denoising of 3D magnetic resonance images using a residual encoder–decoder Wasserstein generative adversarial network,” Med. Image Anal., vol. 55, pp. 165–180, Jul. 2019, doi: 10.1016/j.media.2019.05.001.
[9] P. Sadda and T. Qarni, “Real-Time Medical Video Denoising with Deep Learning: Application to Angiography,” Int. J. Appl. Inf. Syst., vol. 12, no. 13, pp. 22–28, May 2018, doi: 10.5120/ijais2018451755. [10] “Automated CT and MRI Liver Segmentation and Biometry Using a Generalized Convolutional Neural Network | Radiology: Artificial Intelligence.” https://pubs.rsna.org/doi/full/10.1148/ryai.2019180022 (accessed May 24, 2019).
[11] M. Bydder et al., “Relaxation effects in the quantification of fat using gradient echo imaging,” Magn. Reson. Imaging, vol. 26, no. 3, pp. 347–359, Apr. 2008, doi: 10.1016/j.mri.2007.08.012.
[12] J.-P. Kuhn et al., “T1 Bias in Chemical Shift-Encoded Liver Fat-Fraction: Role of the Flip Angle,” J. Magn. Reson. Imaging JMRI, vol. 40, no. 4, pp. 875–883, Oct. 2014, doi: 10.1002/jmri.24457.
[13] Y. Wang, D. Li, E. M. Haacke, and J. J. Brown, “A three-point Dixon method for water and fat separation using 2D and 3D gradient-echo techniques,” J. Magn. Reson. Imaging JMRI, vol. 8, no. 3, pp. 703–710, Jun. 1998, doi: 10.1002/jmri.1880080329.
[14] S. B. Reeder et al., “Multicoil Dixon chemical species separation with an iterative least-squares estimation method,” Magn. Reson. Med., vol. 51, no. 1, pp. 35–45, Jan. 2004, doi: 10.1002/mrm.10675.
Figures