0050
Optimization of the T2-weighted MRI contrast in 0-6-month-old infant brain based on extended phase graph theory1Key Laboratory for Biomedical Engineering of Ministry of Education, Department of Biomedical Engineering, College of Biomedical Engineering & Instrument Science, Zhejiang University, Hangzhou, China, 2Department of Radiology, Children's Hospital, Zhejiang University School of Medicine, Hangzhou, China
Synopsis
Keywords: Pulse Sequence Design, Contrast Mechanisms
3D T2-weighted MRI using fast spin-echo (FSE) with variable flip angles has been widely for anatomical imaging. However, 3D FSE of infant brains exhibits poor contrast due to the inherently close and rapidly changing T2 relaxation times between white matter and grey matter. Here we proposed an extended-phase-graph-based method to optimize the flip angles in FSE sequence for maximizing the white/grey matter contrast in 0 to 6 month-old infant brains at 3T, based on T2 values acquired from 37 infant brains. Results demonstrated improved relative contrasts in infant brains by 1.6-2 folds at different ages in different regions of interest.Introduction
Three-dimensional fast-spin-echo (FSE) sequence with variable refocusing flip angles (VFA) is utilized for 3D T2w MRI for its high acquisition efficiency1 and rich image contrast. However, the conventional 3D-FSE T2-weighted imaging was designed for the adult brain, and its contrast was relatively poor in the infant brains due to the inherently close and rapidly changing T2 relaxation time between white matter (WM) and grey matter (GM)2. The weak contrast poses a challenge for automated segmentation and quantitative analysis. We proposed an optimization strategy to design variable-flip-angle trains with improved contrast based on the inverse extended phase graph (EPG) theory in 0-6 month-old infant brains, and compared the results with the default VFA designed for the adult brains.Methods
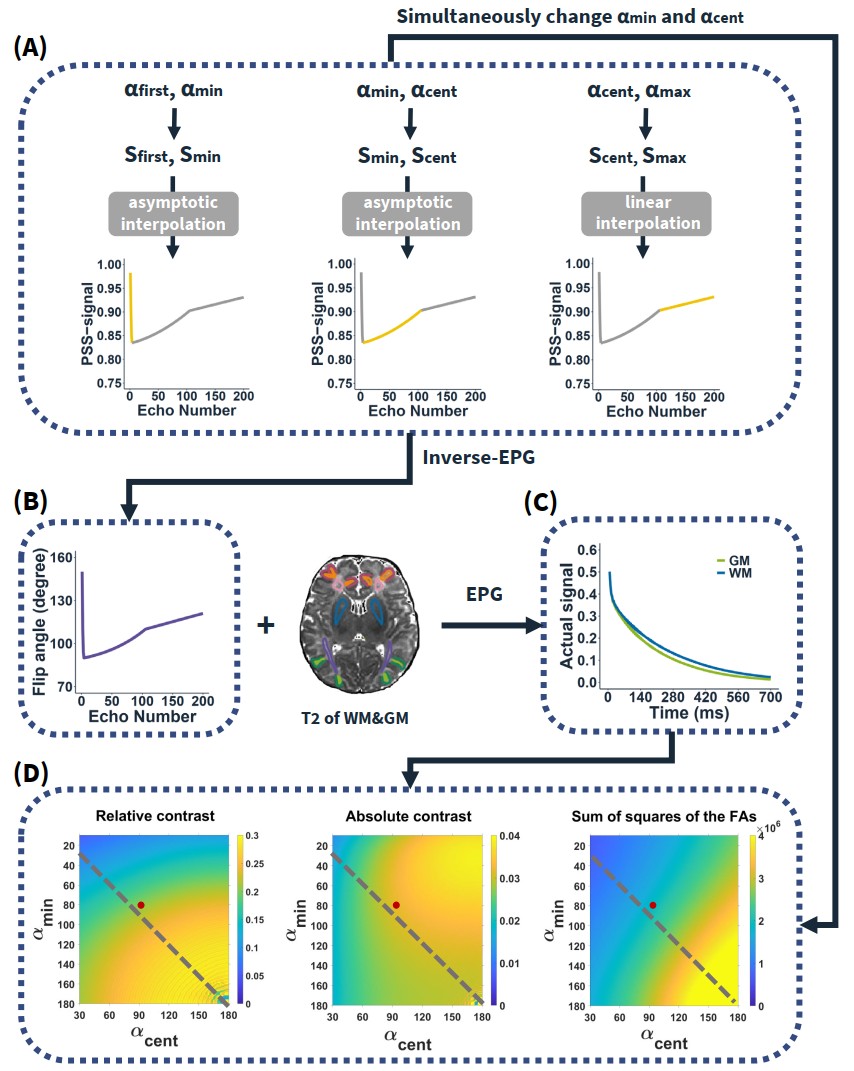
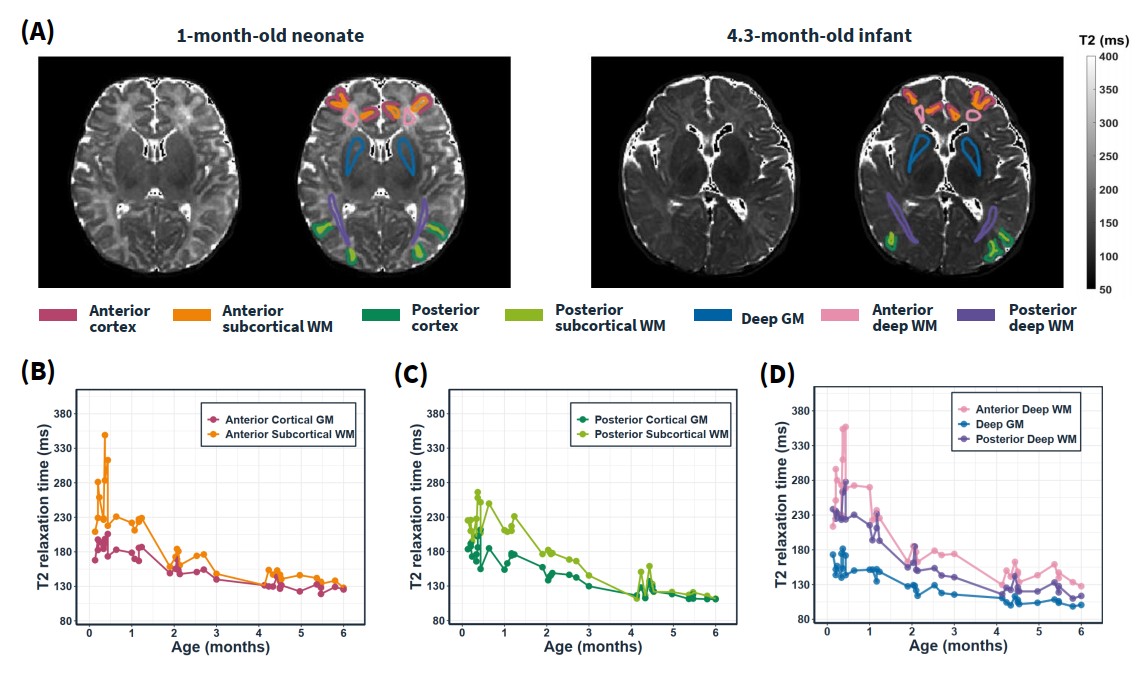
Relaxometry mapping: T1, T2 and proton density (PD) maps were simultaneously quantified using a vendor-preset “MIX” sequence3 in 37 infant brains aged 0-6 months. T2 relaxation times of cortical GM, subcortical WM, and deep brain GM were then obtained in manually defined regions of interest (ROI) on the T2 maps (Figure 2A) of individual subjects, which were then averaged for the following optimization analysis.Contrast optimization: Figure 1 shows the pipeline of the proposed contrast optimization strategy. The refocusing VFA train was determined by four control angles (αfirst, αmin, αcent, αmax). αfirst was determined by αmin to set a sweep of asymptotic angles at the beginning of the train. αmax was set at 120°. The four control angles were used to determine the corresponding target signal intensities based on the pseudo-steady state (PSS) principle4,5:
$$S_{PSS}(\alpha)=(sin \frac{\alpha}{2})^{1/2}P_{-1/2}[sin \frac{\alpha}{2} (1+\frac{sin^2\alpha}{8 sin^4 \frac{\alpha}{2}})]$$
where P(·) is a Legendre polynomial. Other PSS signals along the echo train were calculated by interpolation6. Inverse-EPG7 was then used to calculate the refocusing VFA train according to the predefined PSS signal profile. Then we utilized the EPG algorithm8 to simulate the actual signal evolution based on the VFA train and T2 relaxation times in GM and WM. Linear encoding was used to fill the k-space, and thereby, the echo at the center of the echo train determined the contrast of the image. The flexible parameters αmin and αcent were designed to maximize the relative contrast [(SWM – SGM) / (SWM + SGM)] between the two tissues, while retaining sufficient signal-to-noise ratio (SNR) and constraining specific absorption rate (SAR). Here, we used absolute contrast (SWM – SGM) and the sum of squares of the flip angles to infer SNR and SAR, respectively9,10.
Data acquisition: All experiments were performed on a 3T Philips Achieva MRI scanner. 3D T2-weighted images of 9 infant brains were acquired with field of view of 200 mm × 200 mm × 150 mm, resolution = 1.0 mm × 2.5 mm × 1.0 mm, sagittal orientation, TR/TE=2000/404ms, turbo factor=200, and SENSE factor of 2.
Results
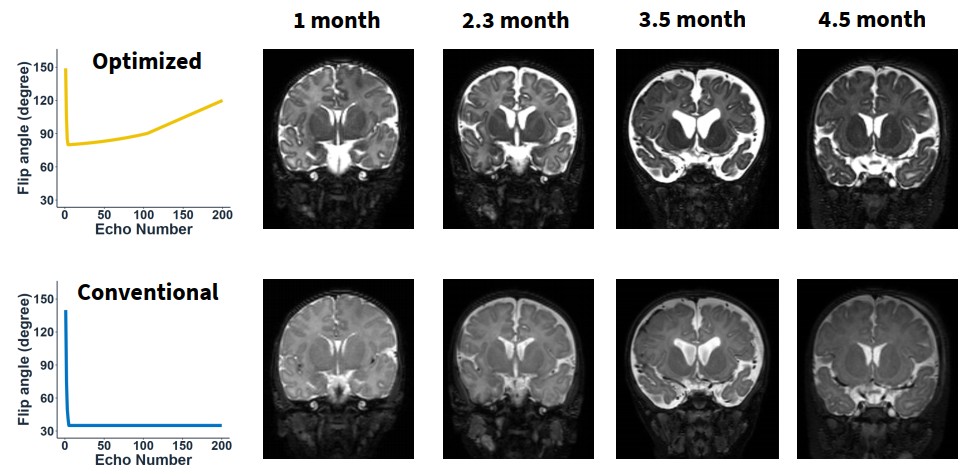
Figure 2 shows the T2 relaxation times measured in manually delineated anterior and posterior WM and GM and deep GM ROIs from 0 to 6 month-old infant brains. T2 values in both the GM and WM rapidly dropped with age, and they gradually became similar, indicating reducing contrast at the later infantile stage. Besides, the deep brain regions reached the iso-intense pattern later than the cortical regions.Figure 3 compares the T2w images of infant brains using the optimized VFA train for 0-6 month-old infant brains and the default VFA train used for adult brains. In the optimized VFA train, the two control angles αmin and αcent were set to 80° and 90°, respectively. In the conventional VFA train, an initial flip-angle ramp was followed by constant 35° refocusing RF pulses.
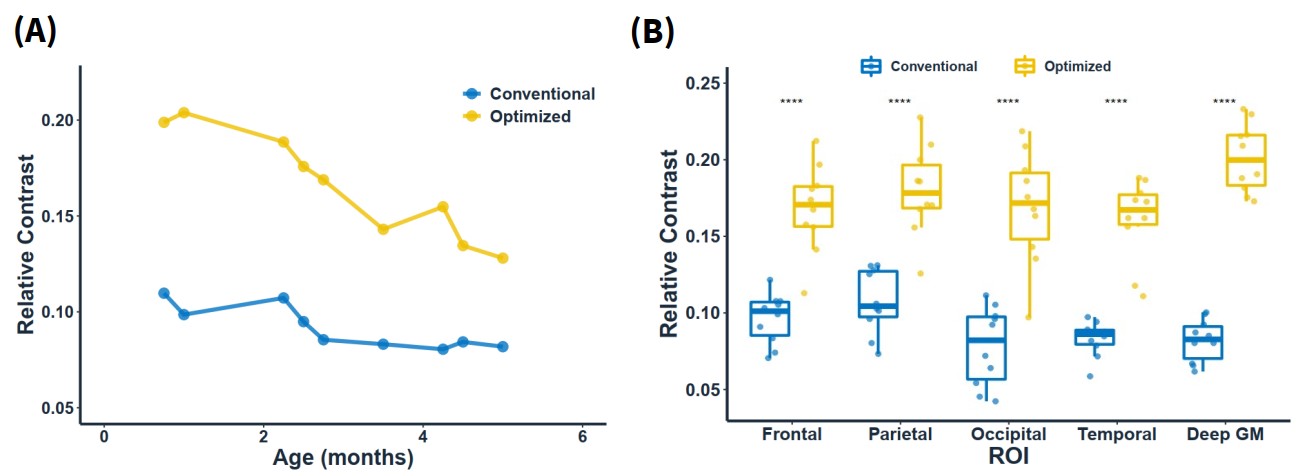
Figure 4 illustrates the relative contrast in 0-6-month-old infant brains before and after optimization in different brain regions. The relative contrast was improved by an average rate of 1.98 folds with the optimized VFA train, with the highest improvement in the deep GM (2.44 folds), occipital lobe (2.22 folds), and temporal lobe (1.9 folds).
Discussion and Conclusion
An effective strategy was proposed to improve the contrast of T2-weighted images of the infant brains by optimizing the flip angles of the RF pulses. This method significantly improved GM/WM contrast in 0-6-month-old infant brains, which was especially useful for 4-6-month-old infants when the images were nearly isointense. Our next step is to apply this scheme to a wider age range of infant brains, e.g., from 0 to 18 month-old. Besides, whether the segmentation accuracy can be improved by the optimized VFA sequence needs to be examined in future studies.Acknowledgements
This work was supported by the Ministry of Science and Technology of the People’s Republic of China (2021ZD0200202, 2018YFE0114600), the National Natural Science Foundation of China (81971606, 82122032), and the Science and Technology Department of Zhejiang Province (202006140, 2022C03057).References
1. Mugler, J.P., III. Optimized three-dimensional fast-spin-echo MRI. J. Magn. Reson. Imaging. 2014;39:745-767.
2. Dubois, J., Dehaene-Lambertz, G., Kulikova, S., et al. The early development of brain white matter: a review of imaging studies in fetuses, newborns and infants. Neuroscience. 2014;276:48–71.
3. In den Kleef JJ, Cuppen JJ. RLSQ: T1, T2, and rho calculations, combining ratios and least squares. Magn. Reson. Med. 1987;5(6):513-524.
4. Alsop D. C. The sensitivity of low flip angle RARE imaging. Magn. Reson. Med. 1997;37(2):176–184.
5. Keerthivasan, M. B., Galons, J. P., Johnson, K., et al. Abdominal T2-Weighted Imaging and T2 Mapping Using a Variable Flip Angle Radial Turbo Spin-Echo Technique. J. Magn. Reson. Imaging. 2022;55(1):289–300.
6. Liang, X., Connelly, A., Tournier, J. D., et al. A variable flip angle-based method for reducing blurring in 3D GRASE ASL. Physics in medicine and biology. 2014;59(18):5559–5573.
7. Hennig, J., Weigel, M., & Scheffler, K. Calculation of flip angles for echo trains with predefined amplitudes with the extended phase graph (EPG)-algorithm: principles and applications to hyperecho and TRAPS sequences. Magn. Reson. Med. 2004;51(1):68–80.
8. Weigel M. Extended phase graphs: dephasing, RF pulses, and echoes - pure and simple. J. Magn. Reson. Imaging. 2015;41(2):266–295.
9. Zhang, H., Lai, C., Liu, R., et al. Age-specific optimization of T1-weighted brain MRI throughout infancy. NeuroImage. 2019;199:387–395.
10. Panych, L. P., & Madore, B. The physics of MRI safety. J. Magn. Reson. Imaging. 2018;47(1):28–43.
Figures