0047
Macrovasculature-suppressed ASL MRI in neonates: quantification of cerebral blood flow and arterial transit time1Department of Biomedical Engineering, Johns Hopkins University School of Medicine, Baltimore, MD, United States, 2Department of Radiology, Johns Hopkins University School of Medicine, Baltimore, MD, United States, 3Department of Pediatrics, Johns Hopkins University School of Medicine, Baltimore, MD, United States, 4Department of Diagnostic Radiology and Nuclear Medicine, University of Maryland School of Medicine, Baltimore, MD, United States, 5F.M. Kirby Research Center for Functional Brain Imaging, Kennedy Krieger Research Institute, Baltimore, MD, United States
Synopsis
Keywords: Neonatal, Perfusion
A prominent feature in neonatal cerebral blood flow (CBF) measurement is the hyperperfusion in the deep brain region. Given the rich presence of large arteries in this region, it is plausible that macrovascular artifacts may play a major role in the hyperintense signals observed. This study presented a new MRI technique, pCASL with arterial suppression and flow suppression (AFS-pCASL) to minimize the macrovascular artifacts in neonates. We demonstrated that macrovascular artifacts in neonatal pCASL can be substantially suppressed, from which quantitative CBF and arterial transit time can be measured when applying the sequence in a multi-delay setting.
INTRODUCTION
Cerebral blood flow (CBF) is an important physiological parameter of the neonatal brain as it can index metabolic demand during brain development and aberration in diseased states. 1-3 Arterial spin labeling (ASL) MRI has been widely applied in adults for the assessment of CBF4. However, its application in neonates remains challenging due to significantly smaller brain size as well as several physiological factors including lower blood flow velocity,5 lower brain perfusion,6 faster heart rate and greater pulsation. A prominent feature in prior neonatal ASL CBF images is the hyperintense signal in the deep brain region, spanning from the mid-brain to the deep gray nuclei.7,8 Previous 15O-PET studies have suggested that thalamic and basal ganglia perfusion in neonates are indeed higher than cortical tissue; 9 given the rich presence of large arteries in these regions, it is plausible that macrovascular artifacts may play a major role in the hyperintense signals observed. Therefore, in this study, we developed a new scheme to suppress macrovascular signals in pseudo-continuous ASL (pCASL) and quantified CBF and arterial transit time (ATT) in healthy term-born neonates.METHODS
Pulse sequences: Two macrovasculature-suppression schemes (Figures 1b and c) were developed and compared with a standard 3D GRASE pCASL sequence (Figure 1a).Figure 1b depicts pCASL with arterial suppression (AS-pCASL), where a RF pulse train was applied during PLD to suppress the incoming arterial blood after the labeling module has ended. The parameters of the arterial suppression pulses were: FA = 90°, interval = 30ms, suppression thickness = 30mm, the suppression slab was placed to be immediately below the labeling plane (Figure 1d).
Figure 1c shows the diagram of pCASL with arterial suppression and flow suppression (dubbed AFS-pCASL). Compared to AS-pCASL, an additional flow-suppression preparation module (Figure 1c) was applied before the excitation to attenuate the remaining macrovascular signals. We used a flow-suppression preparation module rather than a bipolar gradient so that the 3D GRASE can still be used in the acquisition. The encoding-velocity (Venc) was 4cm/s. All three orthogonal directions, i.e., readout, phase-encoding, and slice-selective, were tested.
General experimental method: A unique resource at our institution is that we have established a successful pipeline to recruit healthy neonates (<5 days after birth) for research-dedicated (instead of clinical add-on) MRI scans. This has two advantages: 1) the neonates are truly healthy and we can establish normative values; 2) we have sufficient scan time to systematically test novel sequences like the ones proposed here.
All MR scans were performed on a Siemens 3T Prisma system. During scanning, the neonates were wrapped with a vacuum immobilizer and retained in natural sleep. Two sub-studies were performed.
Study 1: Evaluation of microvasculature-suppression schemes: 8 neonates (5 females, gestational age 39.2±1.1weeks) were studied. The three sequences described in Figure 1 were performed: labeling duration=1800ms, PLD=3000ms, FOV=140×140×72 mm³, voxel size=3.5×3.5×4mm³, TR/TE=5370/24.76ms.
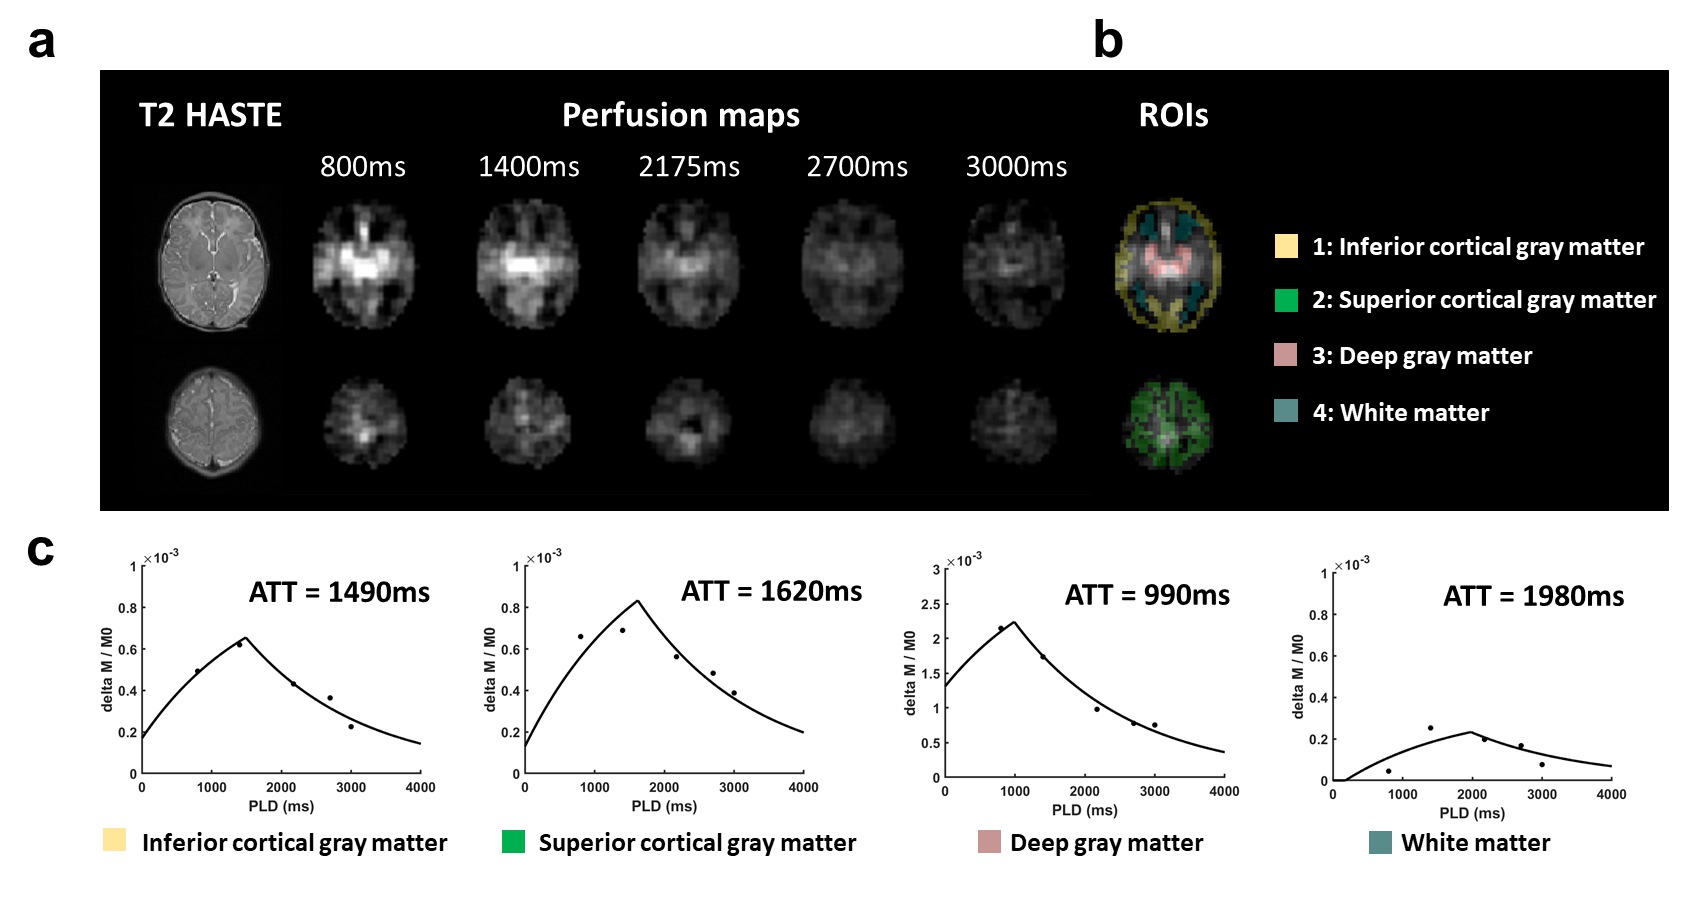
Study 2: Multi-delay scan to estimate CBF and ATT: A multi-delay pCASL study was performed in 3 healthy neonates (1 female, gestational age 38.3±0.3weeks). Based on results of Study 1 (see below), the AFS-pCASL sequence was used to minimize macrovascular contaminations. Flow suppression was applied along the slice-selective direction. 5 PLDs were acquired: 800ms, 1400ms, 2175ms, 2700ms and 3000ms. ATT was estimated in 4 ROIs (inferior cortical gray matter, superior cortical gray matter, deep gray matter, white matter) using the method of signal-weighted delay.10 CBF values were also calculated.
RESULTS AND DISCUSSION
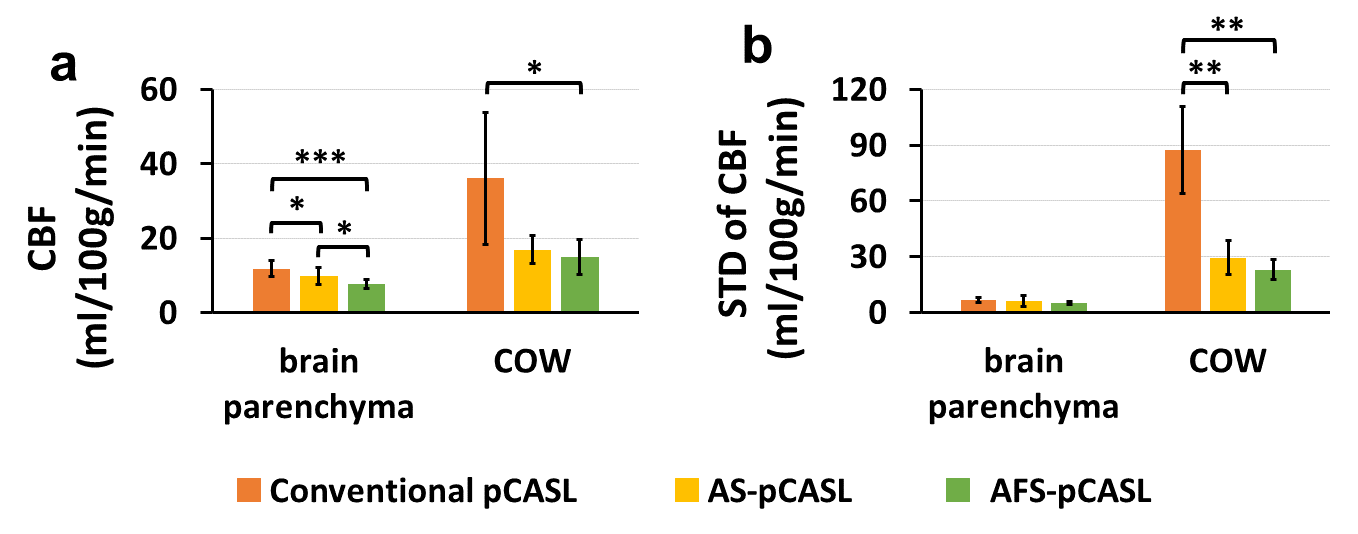
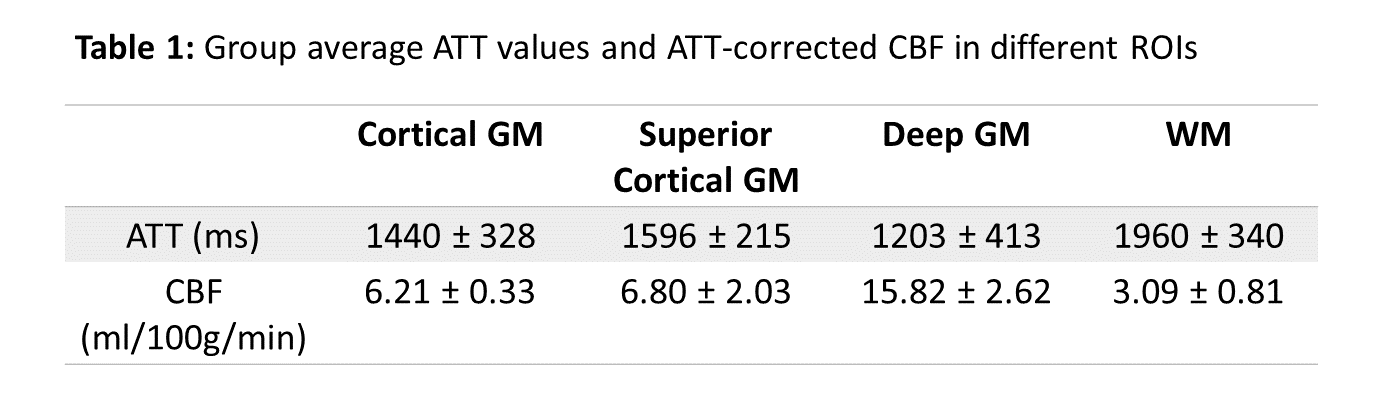
Figure 2a displays the average CBF maps in JHU-Neonate-Atlas space acquired with the three pCASL sequences. A map of temporal standard deviations (STD) across dynamics/measurements is also shown (Figure 2b) to illustrate where the signal variation/pulsation is most prominent. Despite the long PLD of 3000ms, a hyperintense macrovascular signal can still be observed in the conventional pCASL sequence. After applying the arterial suppression pulses, the hyperintensities were attenuated, which were further reduced after applying flow suppression (all three flow-suppression directions showed similar results). The STD map revealed that the pulsatile signals in the standard pCASL followed the trajectories of large arteries of the brain (e.g. near Circle of Willis, COW), which were reduced with macrovascular suppression. Figure 3 shows quantitative values of CBF and STD within the COW and brain parenchyma. It can be seen that the CBF signal in the COW was reduced by 53% and 59% in the AS-pCASL and AFS-pCASL, respectively, with a similar reduction in the STD. In contrast, the microvasculature-suppressed parenchymal CBF and STD did not alter much, despite still showing a statistically significant decrease in CBF.Figure 4a displays the PLD-dependent ASL images of a representative subject. Quantitative ASL kinetic curves in 4 ROIs (Figure 4b) are also shown (Figure 4c). Table 1 summarizes the average ATT and CBF values. We found a shorter arterial transit time in cortical gray matter when compared with white matter. Of note, a short ATT and high CBF were observed in the deep gray matter, in concordance with a higher perfusion value observed in 15O-PET studies.
CONCLUSION
Using an AFS-pCASL sequence, we demonstrated that macrovascular artifacts in neonatal pCASL can be substantially suppressed, from which quantitative CBF and ATT in neonates can be measured when applying the sequence in a multi-delay setting.Acknowledgements
No acknowledgement found.References
1. Proisy M, Corouge I, Legouhy A, Nicolas A, Charon V, Mazille N, Leroux S, Bruneau B, Barillot C, Ferre JC. Changes in brain perfusion in successive arterial spin labeling MRI scans in neonates with hypoxic-ischemic encephalopathy. Neuroimage Clin 2019;24:101939.2. Mabray P, Thewamit R, Whitehead MT, Kao A, Scafidi J, Gaillard WD, Chang T, Tsuchida TN. Increased cerebral blood flow on arterial spin labeling magnetic resonance imaging can localize to seizure focus in newborns: A report of 3 cases. Epilepsia 2018;59:e63-e67.
3. Tortora D, Lo Russo FM, Severino M, Parodi A, Massirio P, Ramenghi LA, Rossi A. Regional impairment of cortical and deep gray matter perfusion in preterm neonates with low-grade germinal matrix-intraventricular hemorrhage: an ASL study. Neuroradiology 2020;62:1689-1699.
4. Alsop DC, Detre JA, Golay X et al. Recommended implementation of arterial spin-labeled perfusion MRI for clinical applications: A consensus of the ISMRM perfusion study group and the European consortium for ASL in dementia. Magn Reson Med 2015;73:102-116.
5. Liu P, Qi Y, Lin Z, Guo Q, Wang X, Lu H. Assessment of cerebral blood flow in neonates and infants: A phase-contrast MRI study. Neuroimage 2019;185:926-933.
6. Tortora D, Severino M, Rossi A. Arterial spin labeling perfusion in neonates. Semin Fetal Neonatal Med 2020;25:101130.
7. Tortora D, Mattei PA, Navarra R, Panara V, Salomone R, Rossi A, Detre JA, Caulo M. Prematurity and brain perfusion: Arterial spin labeling MRI. Neuroimage Clin 2017;15:401-407.
8. Kim HG, Lee JH, Choi JW, Han M, Gho SM, Moon Y. Multidelay Arterial Spin-Labeling MRI in Neonates and Infants: Cerebral Perfusion Changes during Brain Maturation. AJNR Am J Neuroradiol 2018;39:1912-1918.
9. Andersen JB, Lindberg U, Olesen OV, Benoit D, Ladefoged CN, Larsson HB, Hojgaard L, Greisen G, Law I. Hybrid PET/MRI imaging in healthy unsedated newborn infants with quantitative rCBF measurements using (15)O-water PET. J Cereb Blood Flow Metab 2019;39:782-793.
10. Dai W, Robson PM, Shankaranarayanan A, Alsop DC. Reduced resolution transit delay prescan for quantitative continuous arterial spin labeling perfusion imaging. Magn Reson Med 2012;67:1252-1265.
Figures
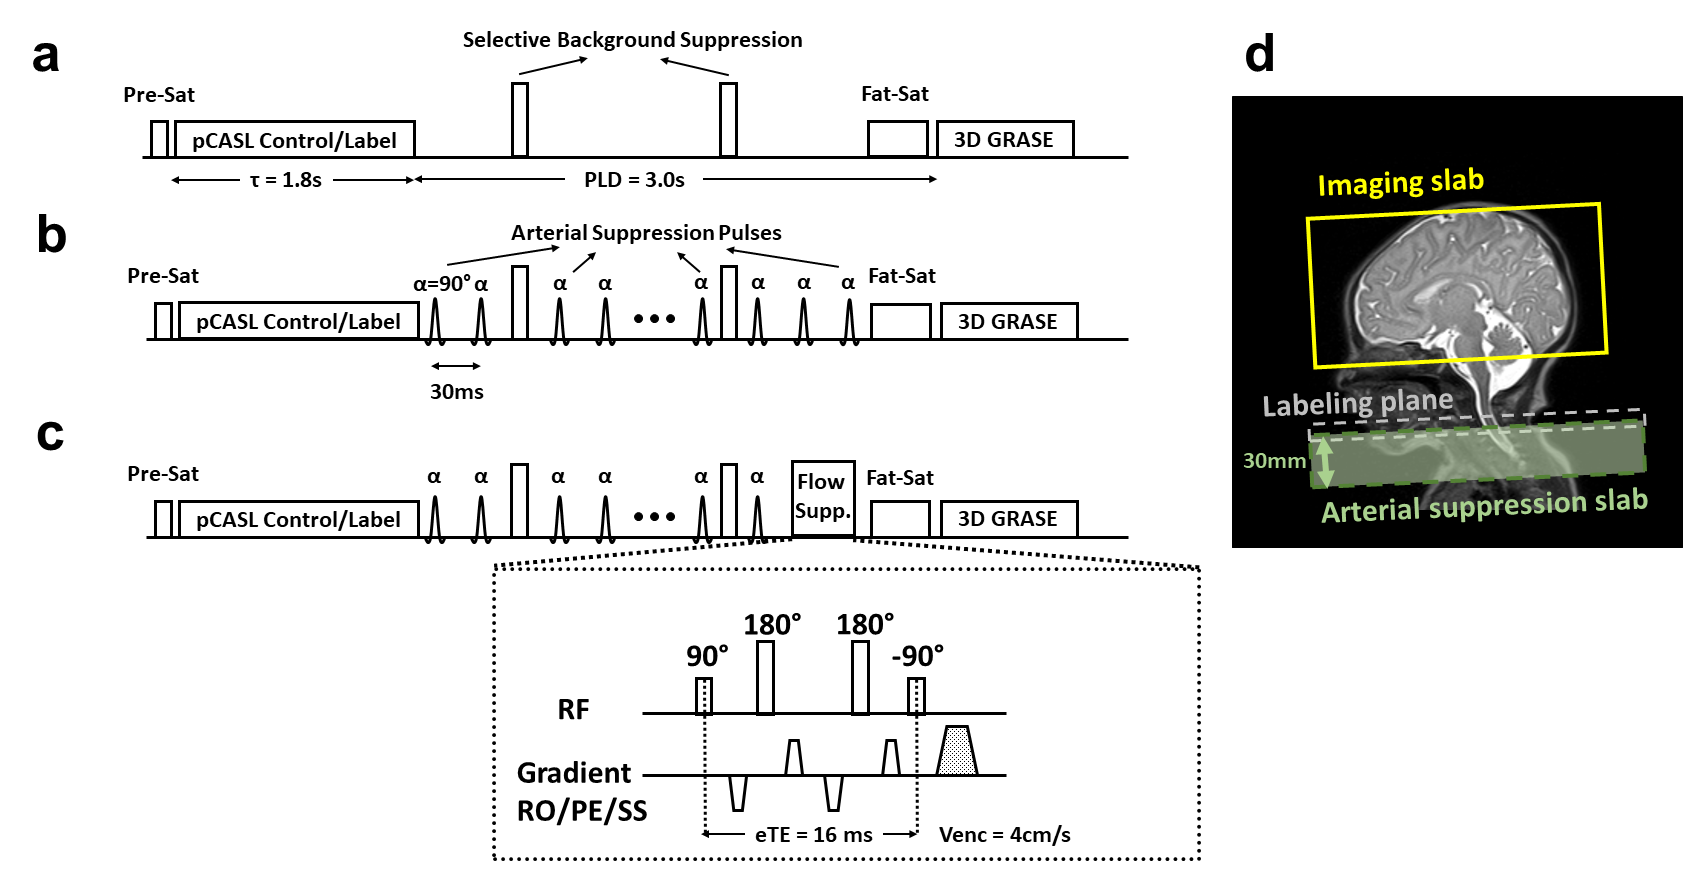
Figure 1. Pulse sequences. (a) Conventional pCASL. (b) pCASL with arterial suppression (AS-pCASL). (c) pCASL with arterial suppression and flow suppression (AFS-pCASL). (d) Positioning of arterial suppression slab
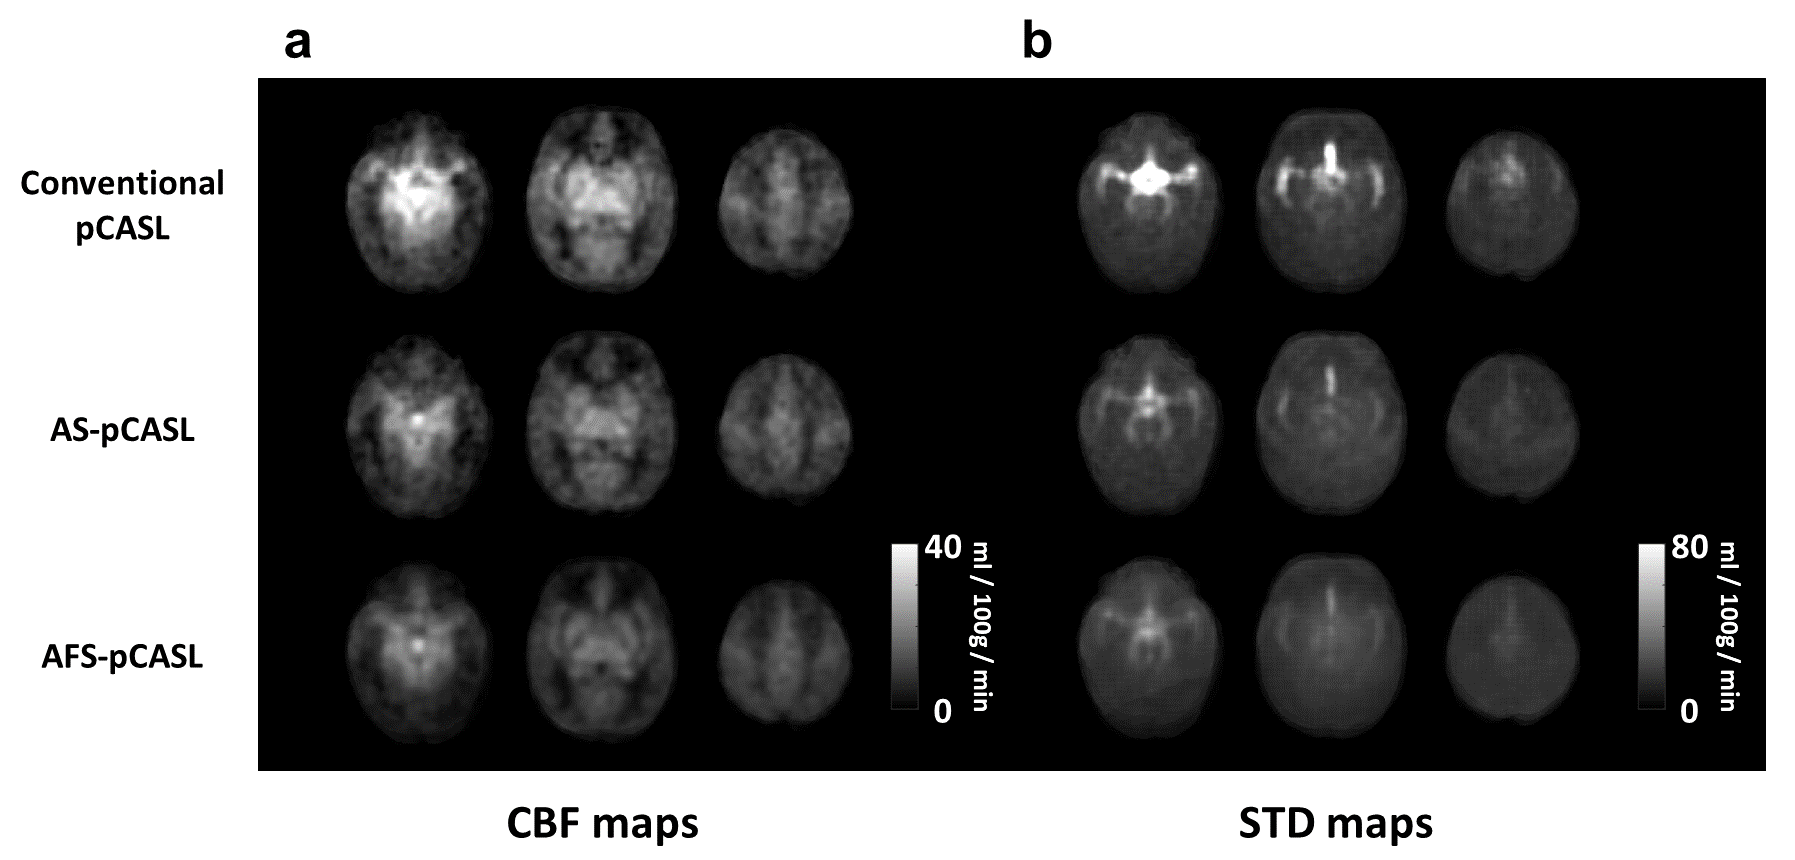
Figure 2. Comparison among macrovascular suppression techniques. (a) Average CBF maps and (b) temporal standard deviation maps acquired from conventional pCASL (1st row), AS-pCASL (2nd row), and AFS-pCASL (3rd row).