0042
Dynamic functional network connectivity in neonatal brain1Key Laboratory for Biomedical Engineering of Ministry of Education, Department of Biomedical Engineering, College of Biomedical Engineering & Instrument Science, Zhejiang University, Hangzhou, China
Synopsis
Keywords: Neonatal, Normal development, brain network
The study aimed to explore the changes of dynamic functional network connectivity (FNC) with age in neonatal brain. We used independent component analysis to extract 17 resting-state networks, and calculated their static and dynamic FNC (sFNC/dFNC). We found that the variance of dFNC significantly correlated with GA, and the sFNC significantly correlated with PMA controlling GA as a covariate. Moreover, the preterm- than term-born neonates showed decreased variances of dFNC between almost all networks, and altered sFNC between several networks. These findings suggest that the time-varying FNCs are modulated more by maternal environment than postnatal experience during early brain development.Introduction
A recent neonatal study has uncovered that early brain development obeys a primary-to-higher-order sequence of maturation, alongside emerging connectivity in immature high-order resting-state networks (RSNs), and preterm birth is associated with reduced functional connectivity across all RSNs1. However, this study only focused on the connections within the RSNs, and those between the RSNs remained unexplored so far. Moreover, previous studies have demonstrated that functional brain connections are dynamic, and static connectivity metrics fail to capture time-varying properties of functional connections2-4. Therefore, the present study applied both static and dynamic functional network connectivity (sFNC/dFNC) analyses to investigate FNC change with age in neonatal brains, and compare the difference between term- and preterm-born neonates.Methods
Data acquisition: We screened 244 full-term (female=108) and 36 pre-term neonates (female=13) scanned at 37.5-43.5 weeks postmenstrual age (PMA), with the smallest head motion during resting-state fMRI scanning, from the second release of dHCP dataset. The rs-fMRI data were acquired using EPI sequence with the following parameters: TE/TR= 38/392ms, voxel size = 2.15 × 2.15 × 2.15 mm3, and 2300 volumes.Data processing: After dHCP fMRI pipeline5, the data were spatially normalized to a 40-week template using FLIRT method and resampled into a voxel size of 2.5 × 2.5 × 2.5 mm3. Then, the normalized data were smoothed by convolution with an isotropic Gaussian kernel at full width half maximum (FWHM) of 5 mm. Next, a group-level independent component analysis (ICA) was used to extract the RSNs in term-born infants scanned at 43.5-44.5 week PMA (n = 27). Subsequently, the group-level spatial maps (RSN signal components) were used to generate subject-specific versions of the spatial maps and associated time series of the subjects scanned at 37-43.5 weeks PMA using dual regression6. Finally, a Pearson’s correlations analysis and a sliding window method were used to compute each subject's sFNC and dFNC.
Statistical analysis: To explore the difference between groups (term versus preterm birth, sex) in the FNC, two-sample t-tests were performed. A partial correlation analysis was used to test for the relationships between the FNC and PMA/GA. In the model evaluating the effect of PMA (244 term-born infants), the covariates were GA, sex and motion; in the model evaluating the effect of GA (155 term-born neonates with PMA-GA < 1 week), the covariates were PMA, sex and motion; in the model evaluating the effect of sex (126 male and 108 female matched), the covariates were PMA, GA and motion; in the model evaluating the effect of term versus preterm (36 term and 36 preterm matched), the covariates were PMA, sex and motion. Since the preterm sample size is relatively small (n = 36), we used a leave-one-out cross validation (LOOCV) to detect the effect of preterm birth. The family-wise error (FWE) correction was used to control the false discoveries due to multiple comparisons between the RSNs.
Results
Seventeen RSNs were identified by group ICA in a subsample of term-born infants scanned at the 44-week PMA, including seven low-order networks (e.g. motor, visual and auditory networks) and ten high-order networks (e.g. prefrontal, posterior parietal and frontoparietal networks) (Fig.1). Group-average matrixes of sFNC and variance of dFNC at each week were shown in Fig .2. The sFNC showed more significant correlations with PMA than those with GA, whereas the variance of dFNC displayed a contrast pattern in term-born neonates (Fig .3). Also, the decreasing sFNC changes with age emerged between low- and high-order RSNs, different from the dFNC changes showing between low-order RSNs, high-order RSNs, and between low- and high-order RSNs. Moreover, compared with term-born infants, preterm-born infants showed decreased dFNC variance between almost all RSNs, and decreased sFNC between low- and high-order RSNs (Fig. 4), which showed a high reproducibility by the LOOCV. Also, the dFNC showed more significant correlations with GA than those with PMA in preterm-born neonates (Fig. 5), indicating that preterm birth significantly affects time-varying functional network change. However, the sFNC had no significant correlations with PMA/GA in preterm. There was no significant difference between male and female infants in the FNC after FWE correction.Discussion and Conclusion
For the first time, the present study provided a detailed characterization of the development of large-scale functional network connectivity in the neonatal brain. We found that 1) seven low-order networks and ten high-order networks in term-born neonates scanned at the 44-week PMA, which were similar to a recent report1 2) the sFNC presented a number of negative correlations with PMA, while the variance of dFNC showed strong positive correlations with GA, suggesting that the time-varying FNC may be more associated with the maternal environment than postnatal experience during early brain development7; 3) preterm-born infants showed decreased dFNC variance in almost all FNCs relative to term-born ones, and their dFNC variance also positively correlated with the GA at birth. This is in accordance with the observation of previous studies that prematurity leads to a reduction in the variance of intrinsic fMRI activity8-10. In summary, the results revealed a time-varying large-scale functional connectivity change with age and further demonstrated a significant effect of preterm birth on FNC, which contributed to the understanding of brain development during infancy.Acknowledgements
This work was supported by the Ministry of Science and Technology of the People’s Republic of China (2018YFE0114600, 2021ZD0200202), the National Natural Science Foundation of China (81971606, 82122032), and the Science and Technology Department of Zhejiang Province (202006140, 2022C03057).References
1. Eyre M, Fitzgibbon SP, Ciarrusta J, Cordero-Grande L, Price AN, Poppe T, Schuh A, Hughes E, O'Keeffe C, Brandon J, Cromb D, Vecchiato K, Andersson J, Duff EP, Counsell SJ, Smith SM, Rueckert D, Hajnal JV, Arichi T, O'Muircheartaigh J, Batalle D, Edwards AD. The Developing Human Connectome Project: typical and disrupted perinatal functional connectivity. Brain. 2021;144(7):2199-2213.
2. Sun F, Zhao Z, Lan M, Xu Y, Huang M, Xu D. Abnormal dynamic functional network connectivity of the mirror neuron system network and the mentalizing network in patients with adolescent-onset, first-episode, drug-naïve schizophrenia. Neurosci Res. 2021; 162:63-70.
3. Smith‐Collins, A. P., Luyt, K., Heep, A., & Kauppinen, R. A. High frequency functional brain networks in neonates revealed by rapid acquisition resting state fMRI. Hum Brian Mapp. 2015; 36(7):2483-2494.
4. Zhi, D., Calhoun, V. D., Lv, L., Ma, X., Ke, Q., Fu, Z., ... & Sui, J. Aberrant dynamic functional network connectivity and graph properties in major depressive disorder. Front Psychiatry. 2018; 9: 339.
5. Fitzgibbon SP, Harrison SJ, Jenkinson M, Baxter L, Robinson EC, Bastiani M, Bozek J, Karolis V, Cordero Grande L, Price AN, Hughes E, Makropoulos A, Passerat-Palmbach J, Schuh A, Gao J, Farahibozorg SR, O'Muircheartaigh J, Ciarrusta J, O'Keeffe C, Brandon J, Arichi T, Rueckert D, Hajnal JV, Edwards AD, Smith SM, Duff E, Andersson J. The developing Human Connectome Project (dHCP) automated resting-state functional processing framework for newborn infants. Neuroimage. 2020; 223:117303.
6. Nickerson LD, Smith SM, Öngür D, Beckmann CF. Using Dual Regression to Investigate Network Shape and Amplitude in Functional Connectivity Analyses. Front Aging Neurosci. 2017; 11:115.
7. Thomason, M. E., Dassanayake, M. T., Shen, S., Katkuri, Y., Alexis, M., Anderson, A. L., ... & Romero, R. Cross-hemispheric functional connectivity in the human fetal brain. Sci Transl Med. 2013;5(173): 173ra24-173ra24.
8. Smyser, C. D., Snyder, A. Z., Shimony, J. S., Mitra, A., Inder, T. E., & Neil, J. J. Resting-State Network Complexity and Magnitude Are Reduced in Prematurely Born Infants. Cereb Cortex. 2016;26(1): 322–333.
9. Gozdas, E., Parikh, N. A., Merhar, S. L., Tkach, J. A., He, L., & Holland, S. K. Altered functional network connectivity in preterm infants: antecedents of cognitive and motor impairments? Brain Struct and Funct. 2018;223(8): 3665-3680.
10. Hoff, G. A. J., Van den Heuvel, M. P., Benders, M. J., Kersbergen, K. J., & De Vries, L. S. On development of functional brain connectivity in the young brain. Front Hum Neurosci. 2013;7: 650.
Figures
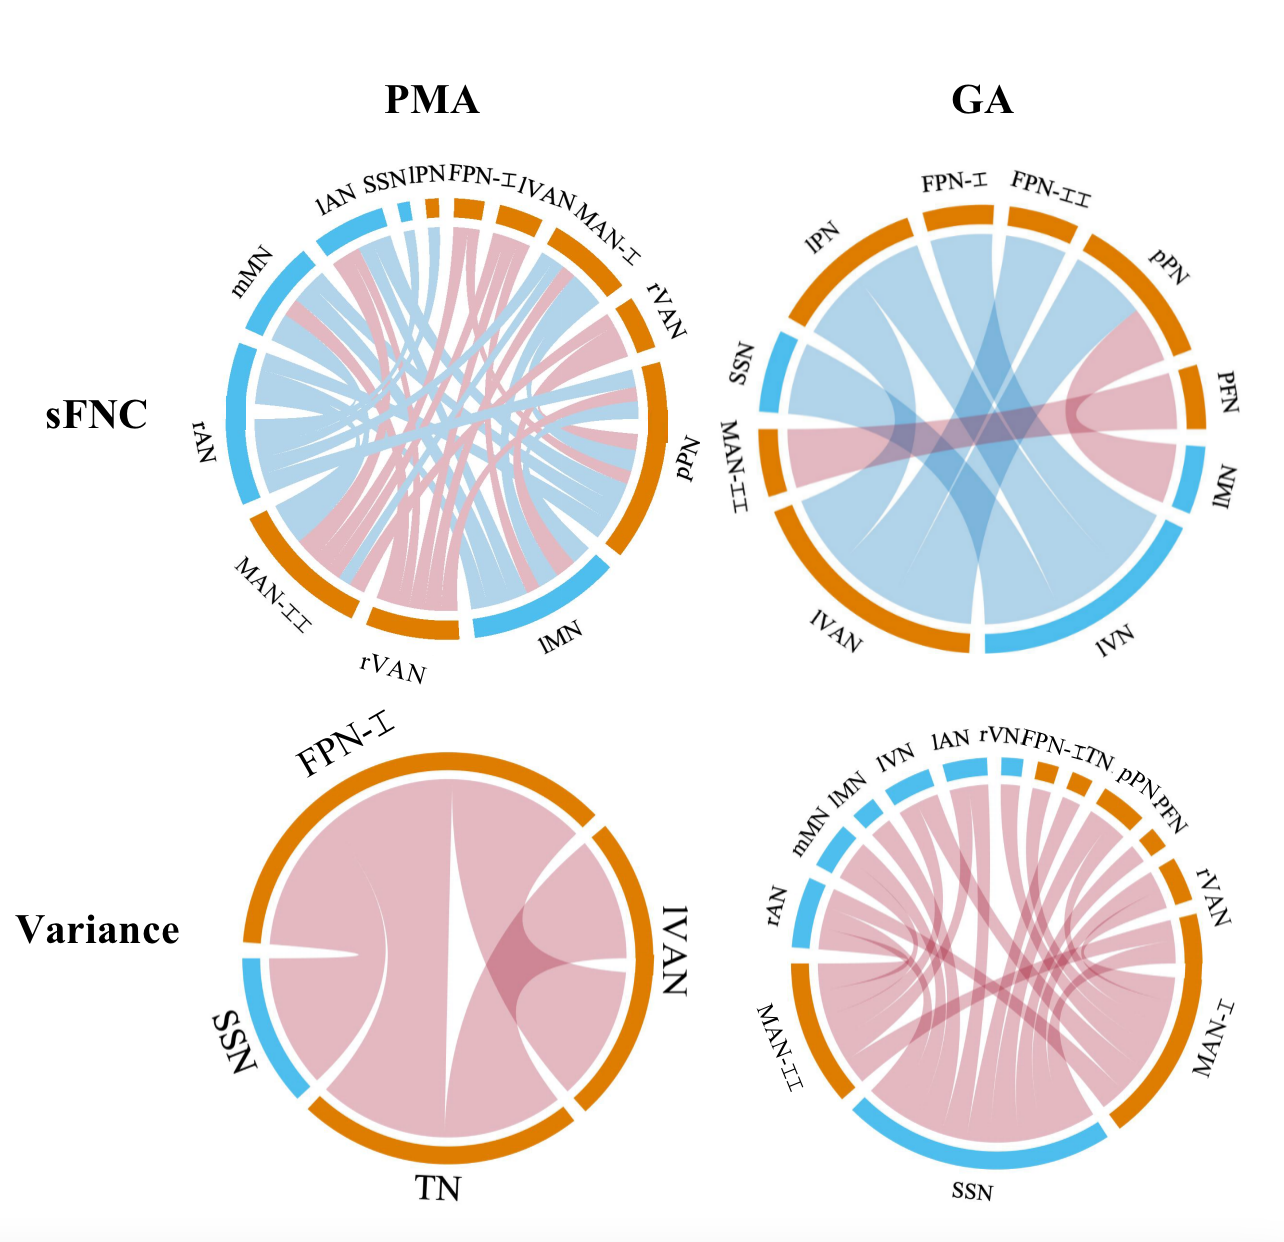
Figure 3. Relationships between FNC and PMA/GA in term-born infants. In each chord diagram, the orange and blue of the nodes represent high- and low-order networks respectively; the red and blue of connectivity represent positive and negative correlation respectively; the length of the node represents the number of the connectivity connected to it and the width of connectivity represents the connection strength. The sFNC correlated more with PMA than those with GA, whereas the variance of dFNC showed a contrast pattern.
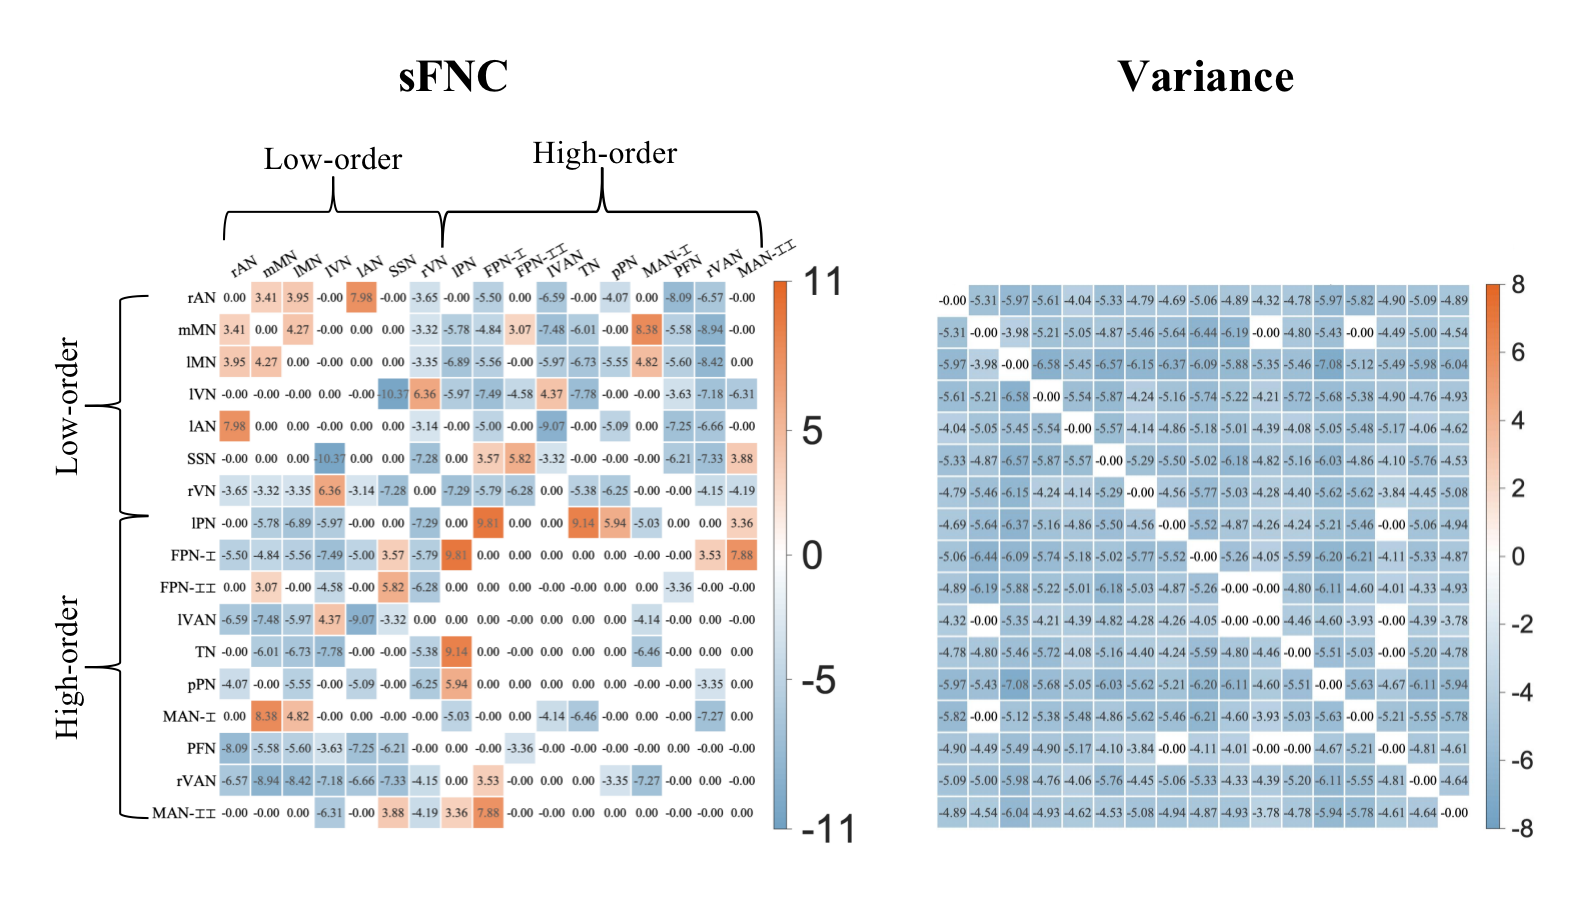
Figure 4. Group differences in FNC between term and preterm-born infants. The red and blue in each matrix represent that preterm than term neonates have a higher and lower value. Compared with term-born infants, preterm-born infants showed decreased dFNC variance between almost all networks, decreased sFNC between low- and high-order networks, and increased sFNC between low-order networks.
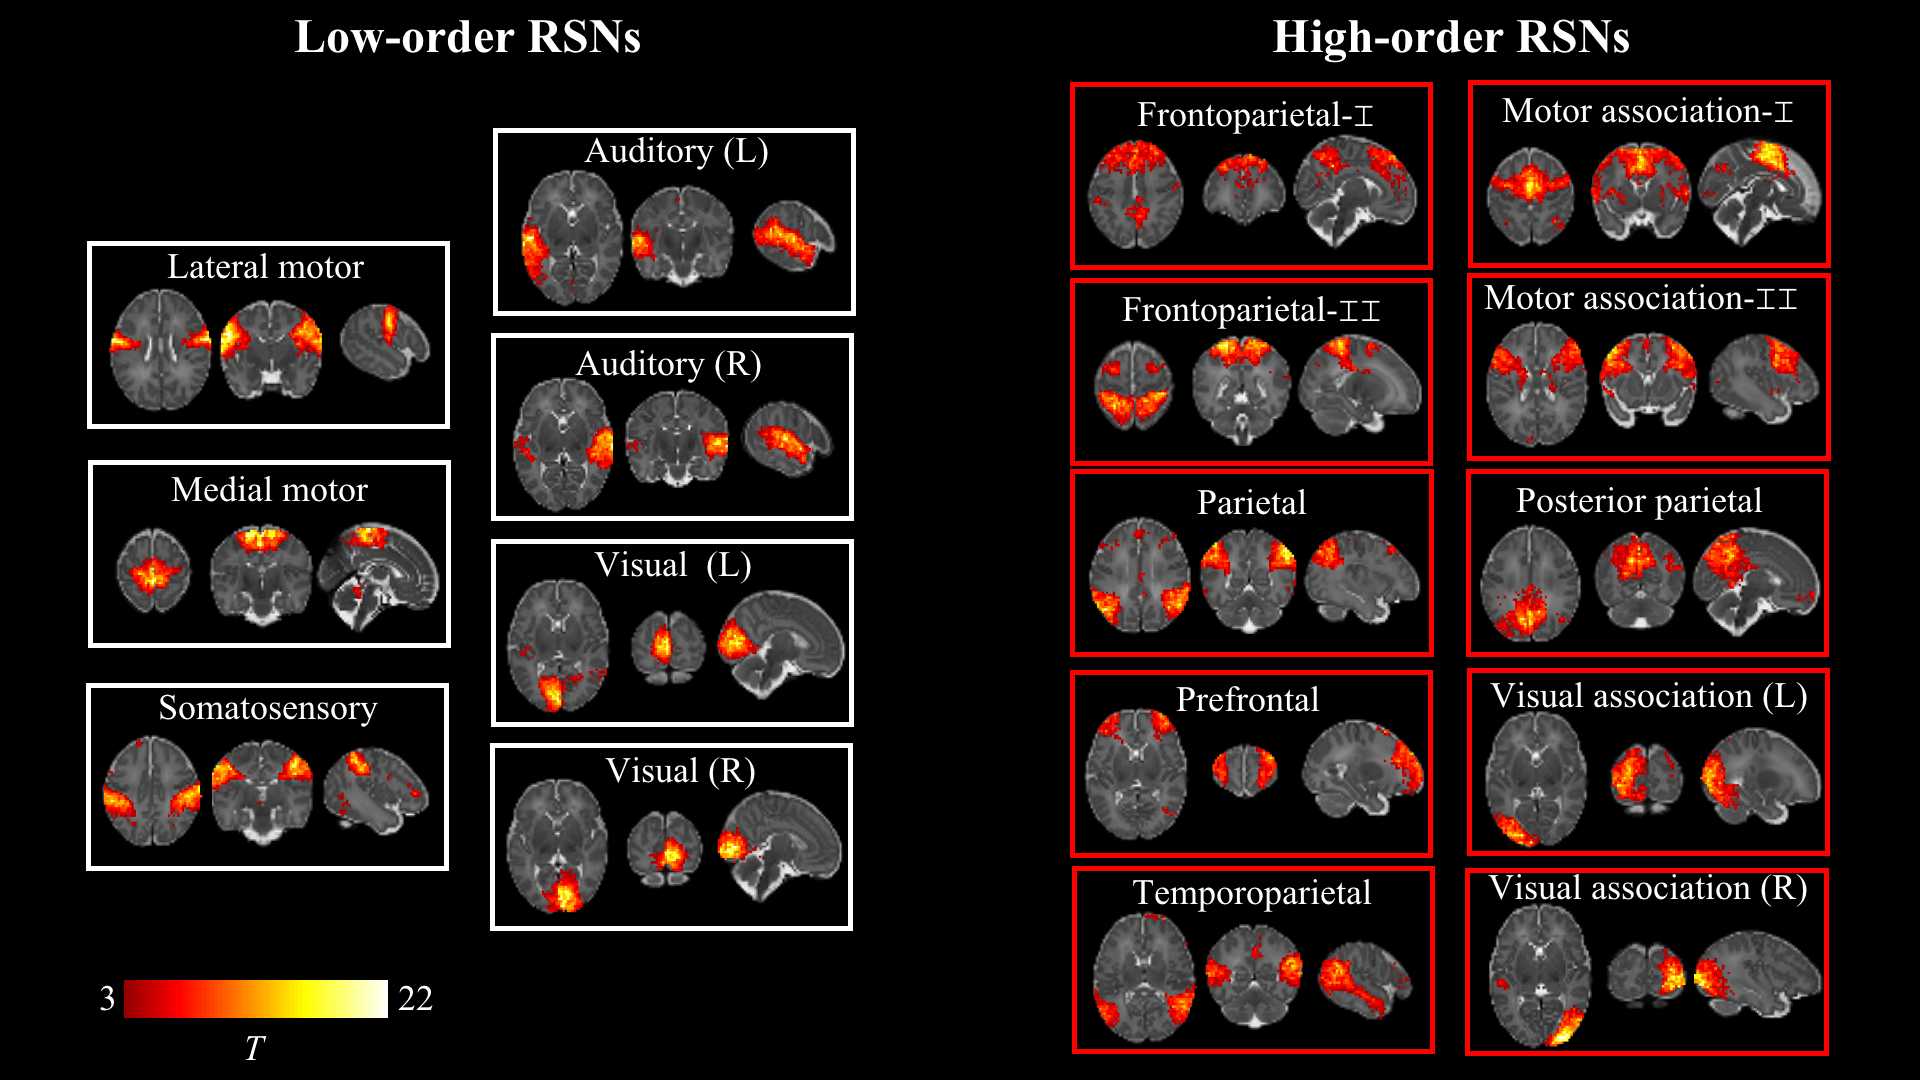
Figure 1. Resting-state networks identified by group independent component analysis in term-born infants scanned at 43.5-44.5 weeks PMA. Example axial, coronal, and sagittal slices for meaningful spatial patterns in seven low- (left) and high-order (right) networks. RSN: resting-state network.
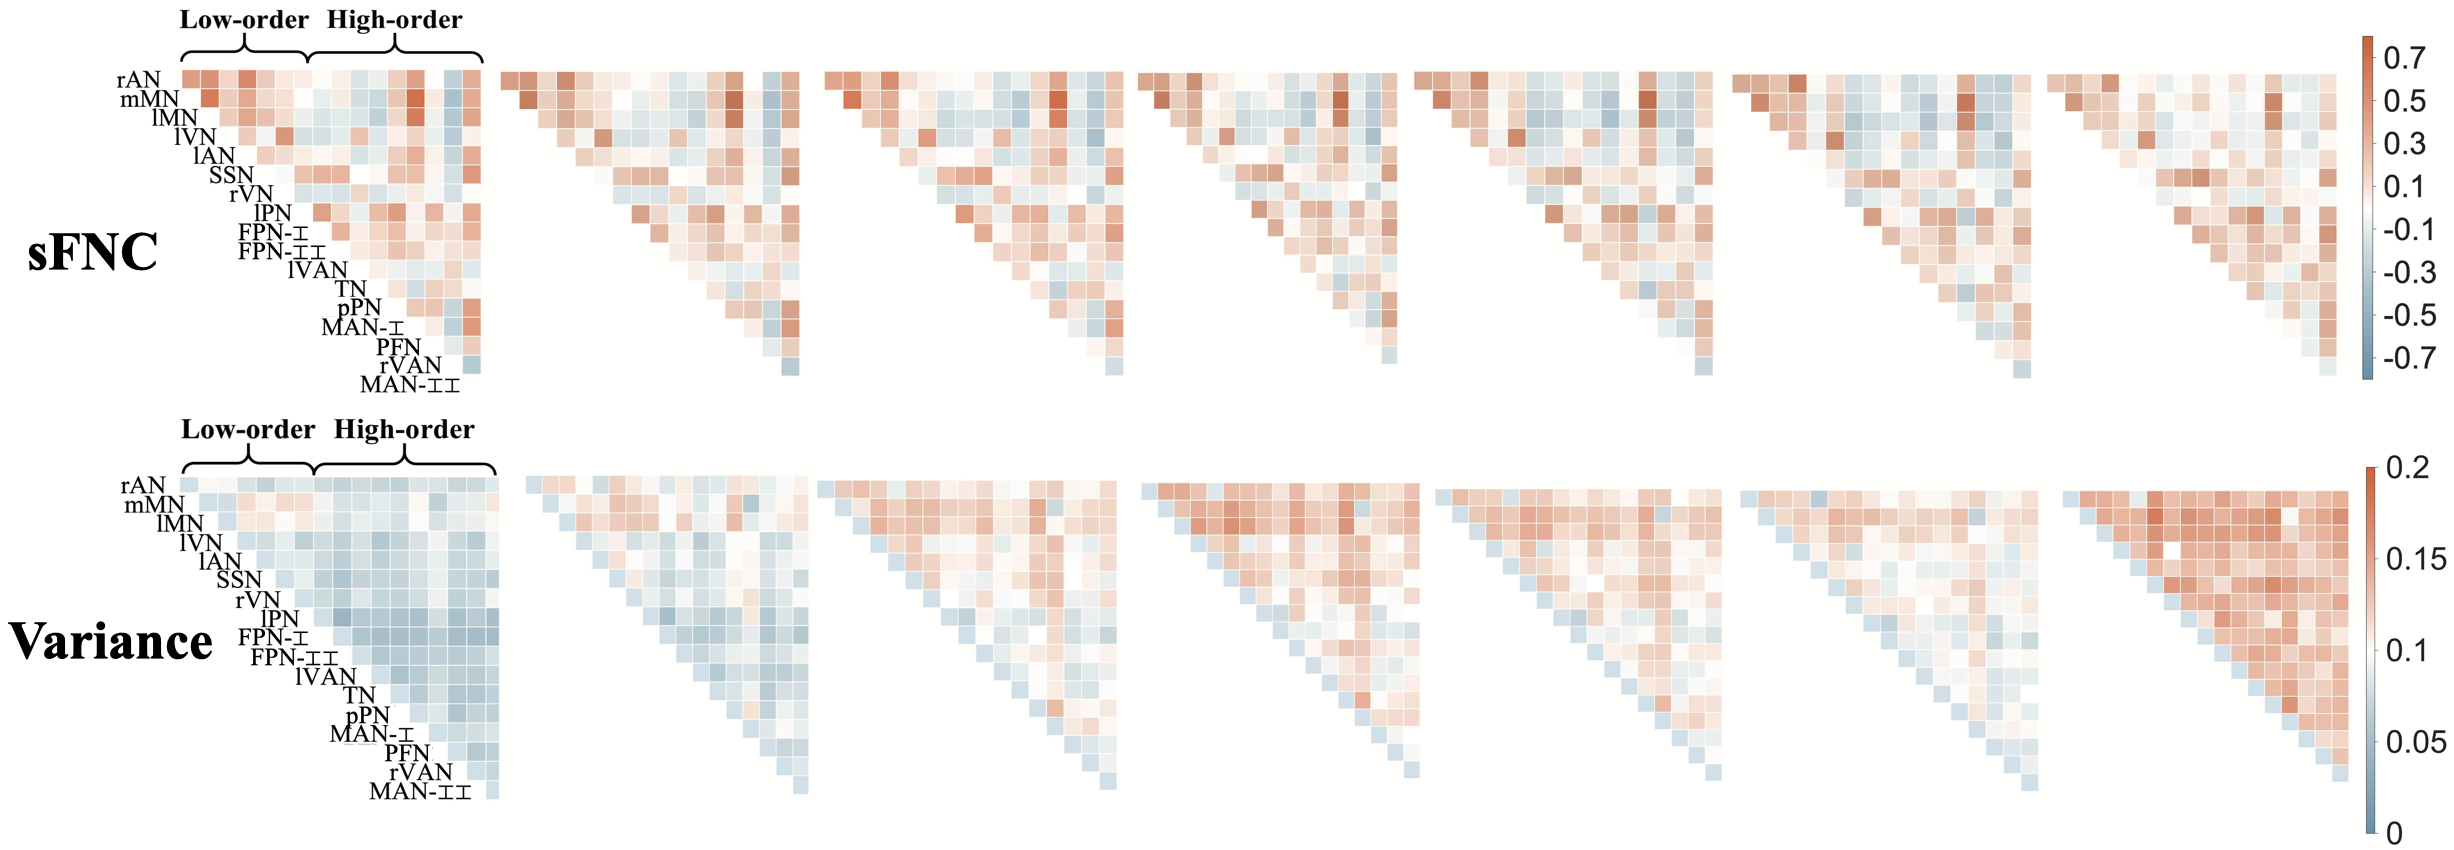
Figure 2. Changes in functional network connectivity with the PMA in term infants.
rAN/lAN: right/left Auditory Network, mMN/lMN: medial/lateral Motor Network, rVN/lVN: right/left Visual Network, SSN: Somatosensory Network; rVAN/lVAN: right/left Visual Association Network, lPN: lateral Parietal Network, FPN: Frontoparietal Network, pPN: posterior Parictal Network, TN: Temporal Network, MAN: medical Motor Association Network, PFN: Prefrontal Network.
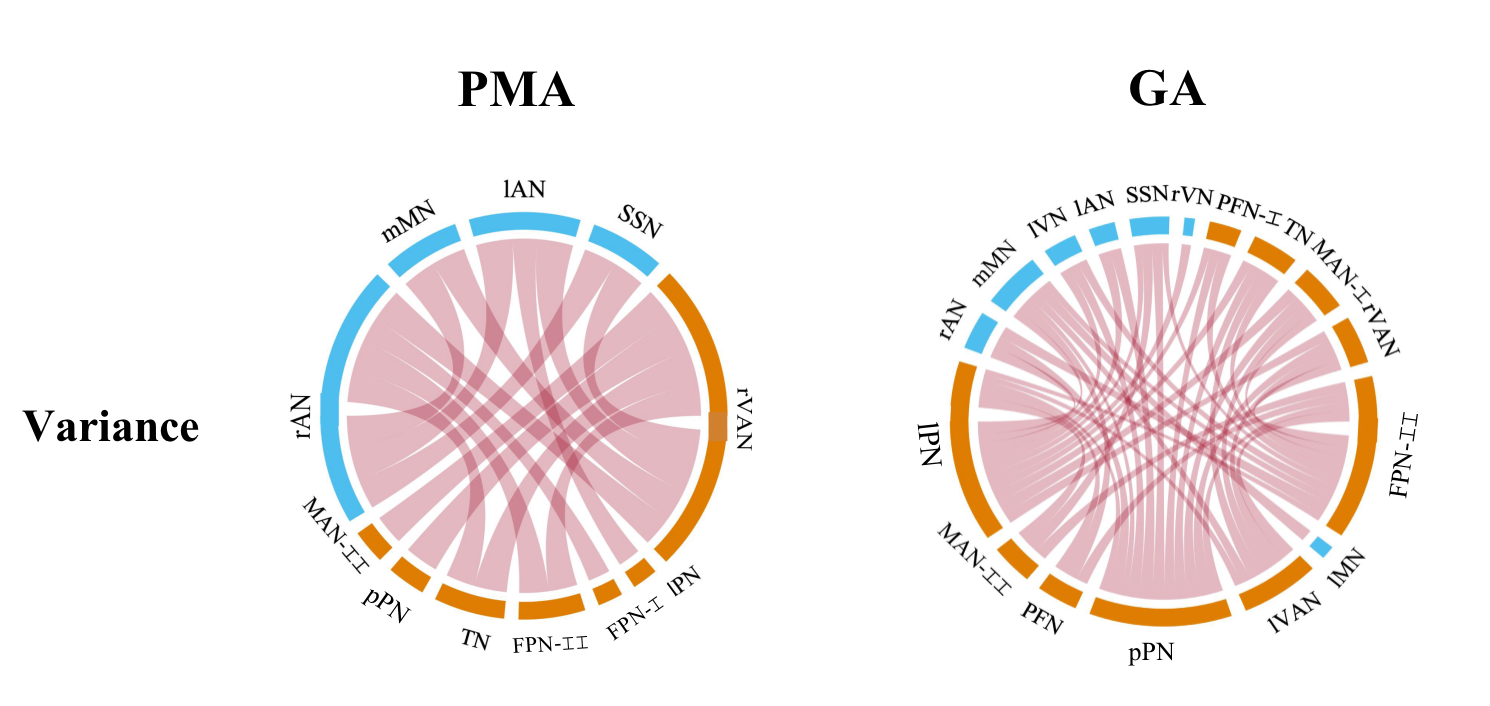
Figure 5. Relationships between the variance of dFNC and PMA/GA in preterm-born infants. More significant results were found between dFNC and GA at birth, and there is no negative correlation between the variance of dFNC and age. Besides, the sFNC has no significant correlations with PMA/GA in preterm.