0041
Development of Infant Brain Functional Connectome Gradients during Age 0-6 Years1School of Biomedical Engineering, ShanghaiTech University, Shanghai, China
Synopsis
Keywords: Normal development, Brain, Infant
Studies have revealed a particular functional connectome gradient (FC-grad) pattern in the human brain, reflecting delicate organization of brain connectome. Interestingly, the pattern can be observed along childhood-adolescent, even in neonates. However, FC-grad changes from infancy to childhood remain unraveled, with significant disparities between neonates and school-aged children not explained. We explored the early development trajectories of the FC-grads between age 0-5 years. We found that the neonatal “prototypic” connectome gradients undergoes rapid changes in this period, especially the first 12 months, reflecting maturing functional integration. Our study filled the gap of FC-grad development in early infancy.
Introduction
Previous research has revealed a principal brain functional connectome gradient (FC-grad) traversing from the primary to transmodal cortex in healthy adults1, reflecting the principle of hierarchical organization and myelination2. Further studies have separately examined the FC-grads in neonates and school-aged children. Apparent FC-grad pattern disparities are observed between these two age populations2,3, yet how the FC-grads changes from the premature to adult-like patterns in the first 5 years after birth is largely unknown. To fill the knowledge gap and find the possible explanation for such inconsistency in the FC-grads across different ages, we tried to delineate FC-grad developmental trajectory between age 0-5 years to gain insights in such a pivotal developmental stage. Few pervious research attached importance to the connectome gradient development of this age group, while the first 5 years is the period of rapid brain development, where dynamic changes appears in the sub-serving brain networks4,5.Methods
We were permitted to use a large-cohort, longitudinal, high-quality Baby Connectome Project (BCP) dataset. This dataset includes 198 subjects aged from 2 weeks to 72 months (16.62±12.51 months), totally 435 fMRI scans. We adopted an infant dedicated fMRI preprocessing strategy6-8, including motion correction, distortion correction, functional-anatomical registration, one-step resampling, and deep learning-based denoising9. Each brain was parcellated into 400 regions with the Schaefer’s atlas, generating regional averaged fMRI signals for FC calculation. The top 10% positive connections were retained for the gradient analysis3. Briefly, a diffusion map embedding algorithm was employed to obtain each infant’s gradient scores. The gradient distributions were aligned before the group-level analysis. We conducted age sliding window (width, 6 months, step size, 3 months in the first 12 months) to examine FC-grad at each age period. For older age groups, we set a step size of 6 months with longer window width. Scatter plots of the two FC-grads at each age groups were plotted respectively. Each point represents a brain region and is colored according to the functional network. Two sample t-tests and a linear mixed model (LMM) were then applied to delineate FC-grad changes along development. Brain regions with significant FC-grad changes were identified and their trajectories were plotted.Results and Discussion
The FC-grad pattern of each age group is shown in Fig. 1a. The patterns in the early ages are similar to the ones in neonates2, while the results after age 24 months have much in common with adult patterns. During the first 12 months, FC-grad patterns distribute generally across anterior-to-posterior direction (constrained by the lobule borders) rather than the matured sensorimotor-to-visual pattern (constrained by the functional borders). It reflects underdeveloped infant brain functional networks. In the period of 12-17 months old, the development in the sensorimotor cortex and Broca's area break the anterior-posterior prototype. At 15 months old, FC-grad with the default-mode-network pattern starts to form and finally grows to adult-like primary-to-transmodal pattern.Fig. 1b illustrates brain regions with significant age-related change between neighboring age groups. For FC-grad #1, the absolute FC-grad-scores in the temporal lobe undergo a decrease-then-increase, from unimodal auditory to transmodal areas. Starting from 15-month-old, the Broca’s area on the left hemisphere significantly increases its FC-grad-score, mirroring a language speaking milestone. For FC-grad #2, compared with 0-5 months age group, the FC-grad-scores in dorsolateral/dorsomedial prefrontal cortices significantly increase in the 6-11 months age group. In general, the FC-grad #2 starts to change earlier than FC-grad #1.
LMM results reveal that, for FC-grads #1 and #2 respectively, 261 and 202 out of 400 regions significantly change with age (p<0.05, FDR corrected). More regions show decrease (toward zero) than increase trajectories (away from zero) for both FC-grads. A paired t-test between FC-grad #1 and #2 on the significantly decreasing brain regions in either FC-gradshows that FC-grad #2 decreases faster (p=1.81*10-19).
Fig. 2 shows FC-grad #1’s trajectories of two representative brain regions, located respectively at the right calcarine and ventral postcentral gyrus, both with a decreased trend (toward zero). Similar trajectories were found with the data only from 0-36 months of age (during natural sleep).
The brain regions with significant changes in each FC-grad along age were partially overlapped at the association cortex and the default mode network (Fig. 3). Fig. 4 illustrates gradually changed FC-grad patterns in 2D scatter plots. With increase of age, the gradient scores of regions in the default mode and frontoparietal networks form closer clusters within each network, while the visual network becomes more diverse.
Conclusions
For the first time, early development trajectories of the FC-grads between age 0-5 years were delineated. They start from “prototypic” patterns, undergo rapid changes, and finally reach an adult-like pattern.Acknowledgements
This work utilizes data acquired with support by an NIH grant (1U01MH110274) and theefforts of the UNC/UMN Baby Connectome Project (BCP) Consortium. This work is partially supported by The National Key Technology R&D Program (No. 2022ZD0209000), Shanghai Pilot Program for Basic Research - Chinese Academy of Science, Shanghai Branch (No. JCYJ-SHFY-2022-014), Open Research Fund Program of National Innovation Center for Advanced Medical Devices (No. NMED2021ZD-01-001), Shenzhen Science and Technology Program (No. KCXFZ20211020163408012), and Shanghai Pujiang Program (No. 21PJ1421400).References
1. Margulies, D. S. et al. Situating the default-mode network along a principal gradient of macroscale cortical organization. Proceedings of the National Academy of Sciences 113, 12574-12579 (2016).
2. Larivière, S. et al. Multiscale structure–function gradients in the neonatal connectome. Cerebral Cortex 30, 47-58 (2020).
3. Xia, Y. et al. Development of functional connectome gradients during childhood and adolescence. Science Bulletin (2022).
4. Bruchhage, M. M., Ngo, G.-C., Schneider, N., D’Sa, V. & Deoni, S. C. Functional connectivity correlates of infant and early childhood cognitive development. Brain Structure and Function 225, 669-681 (2020).
5. Silbereis, J. C., Pochareddy, S., Zhu, Y., Li, M. & Sestan, N. The cellular and molecular landscapes of the developing human central nervous system. Neuron 89, 248-268 (2016).
6. Zhang, H., Shen, D. & Lin, W. Resting-state functional MRI studies on infant brains: a decade of gap-filling efforts. Neuroimage 185, 664-684 (2019).
7. Soussia, M. et al. in International Conference on Medical Image Computing and Computer-Assisted Intervention. 13-21 (Springer).
8. Zhou, Z. et al. in International Conference on Medical Image Computing and Computer-Assisted Intervention. 665-672 (Springer).
9. Heo, K.-S. et al. Deep attentive spatio-temporal feature learning for automatic resting-state fMRI denoising. NeuroImage254, 119127 (2022).
Figures
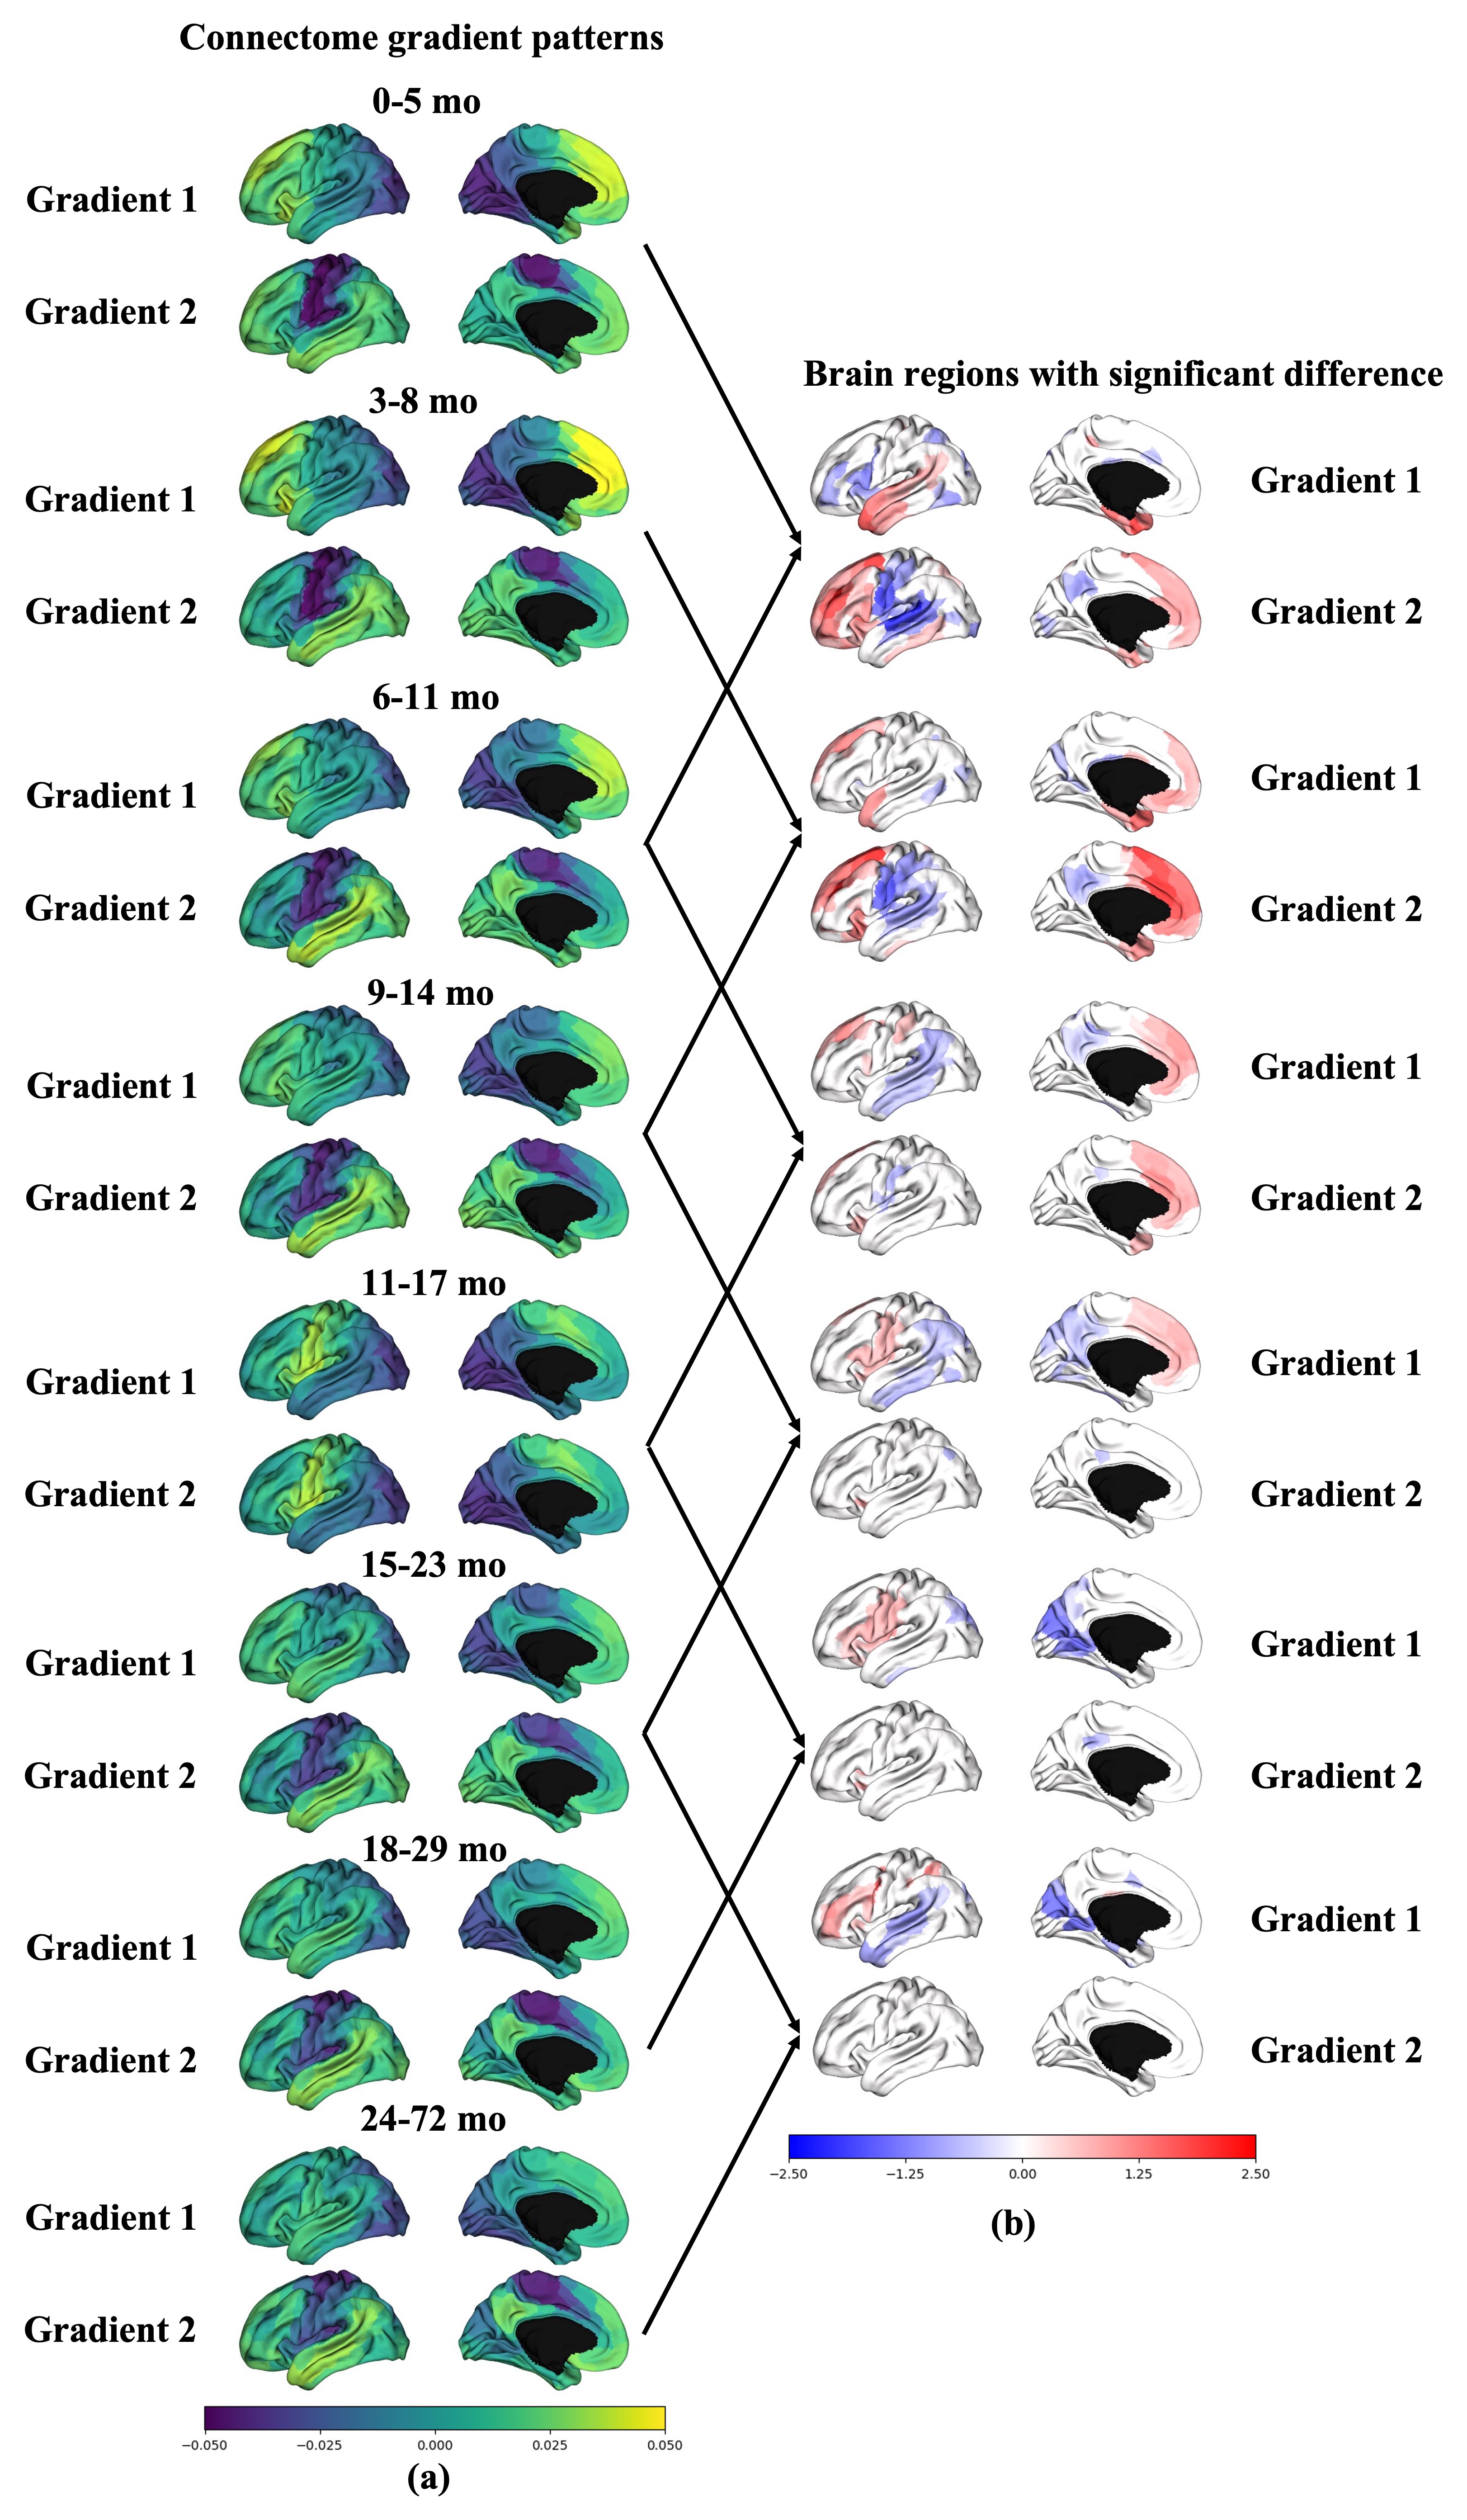
Fig. 1 (a) The brain functional connectome gradients pattern dramatically changes from infancy to childhood. (b) Brain regions with significant functional connectome gradients differences between two neighboring age groups (two-sample t-tests, only significant results are shown).
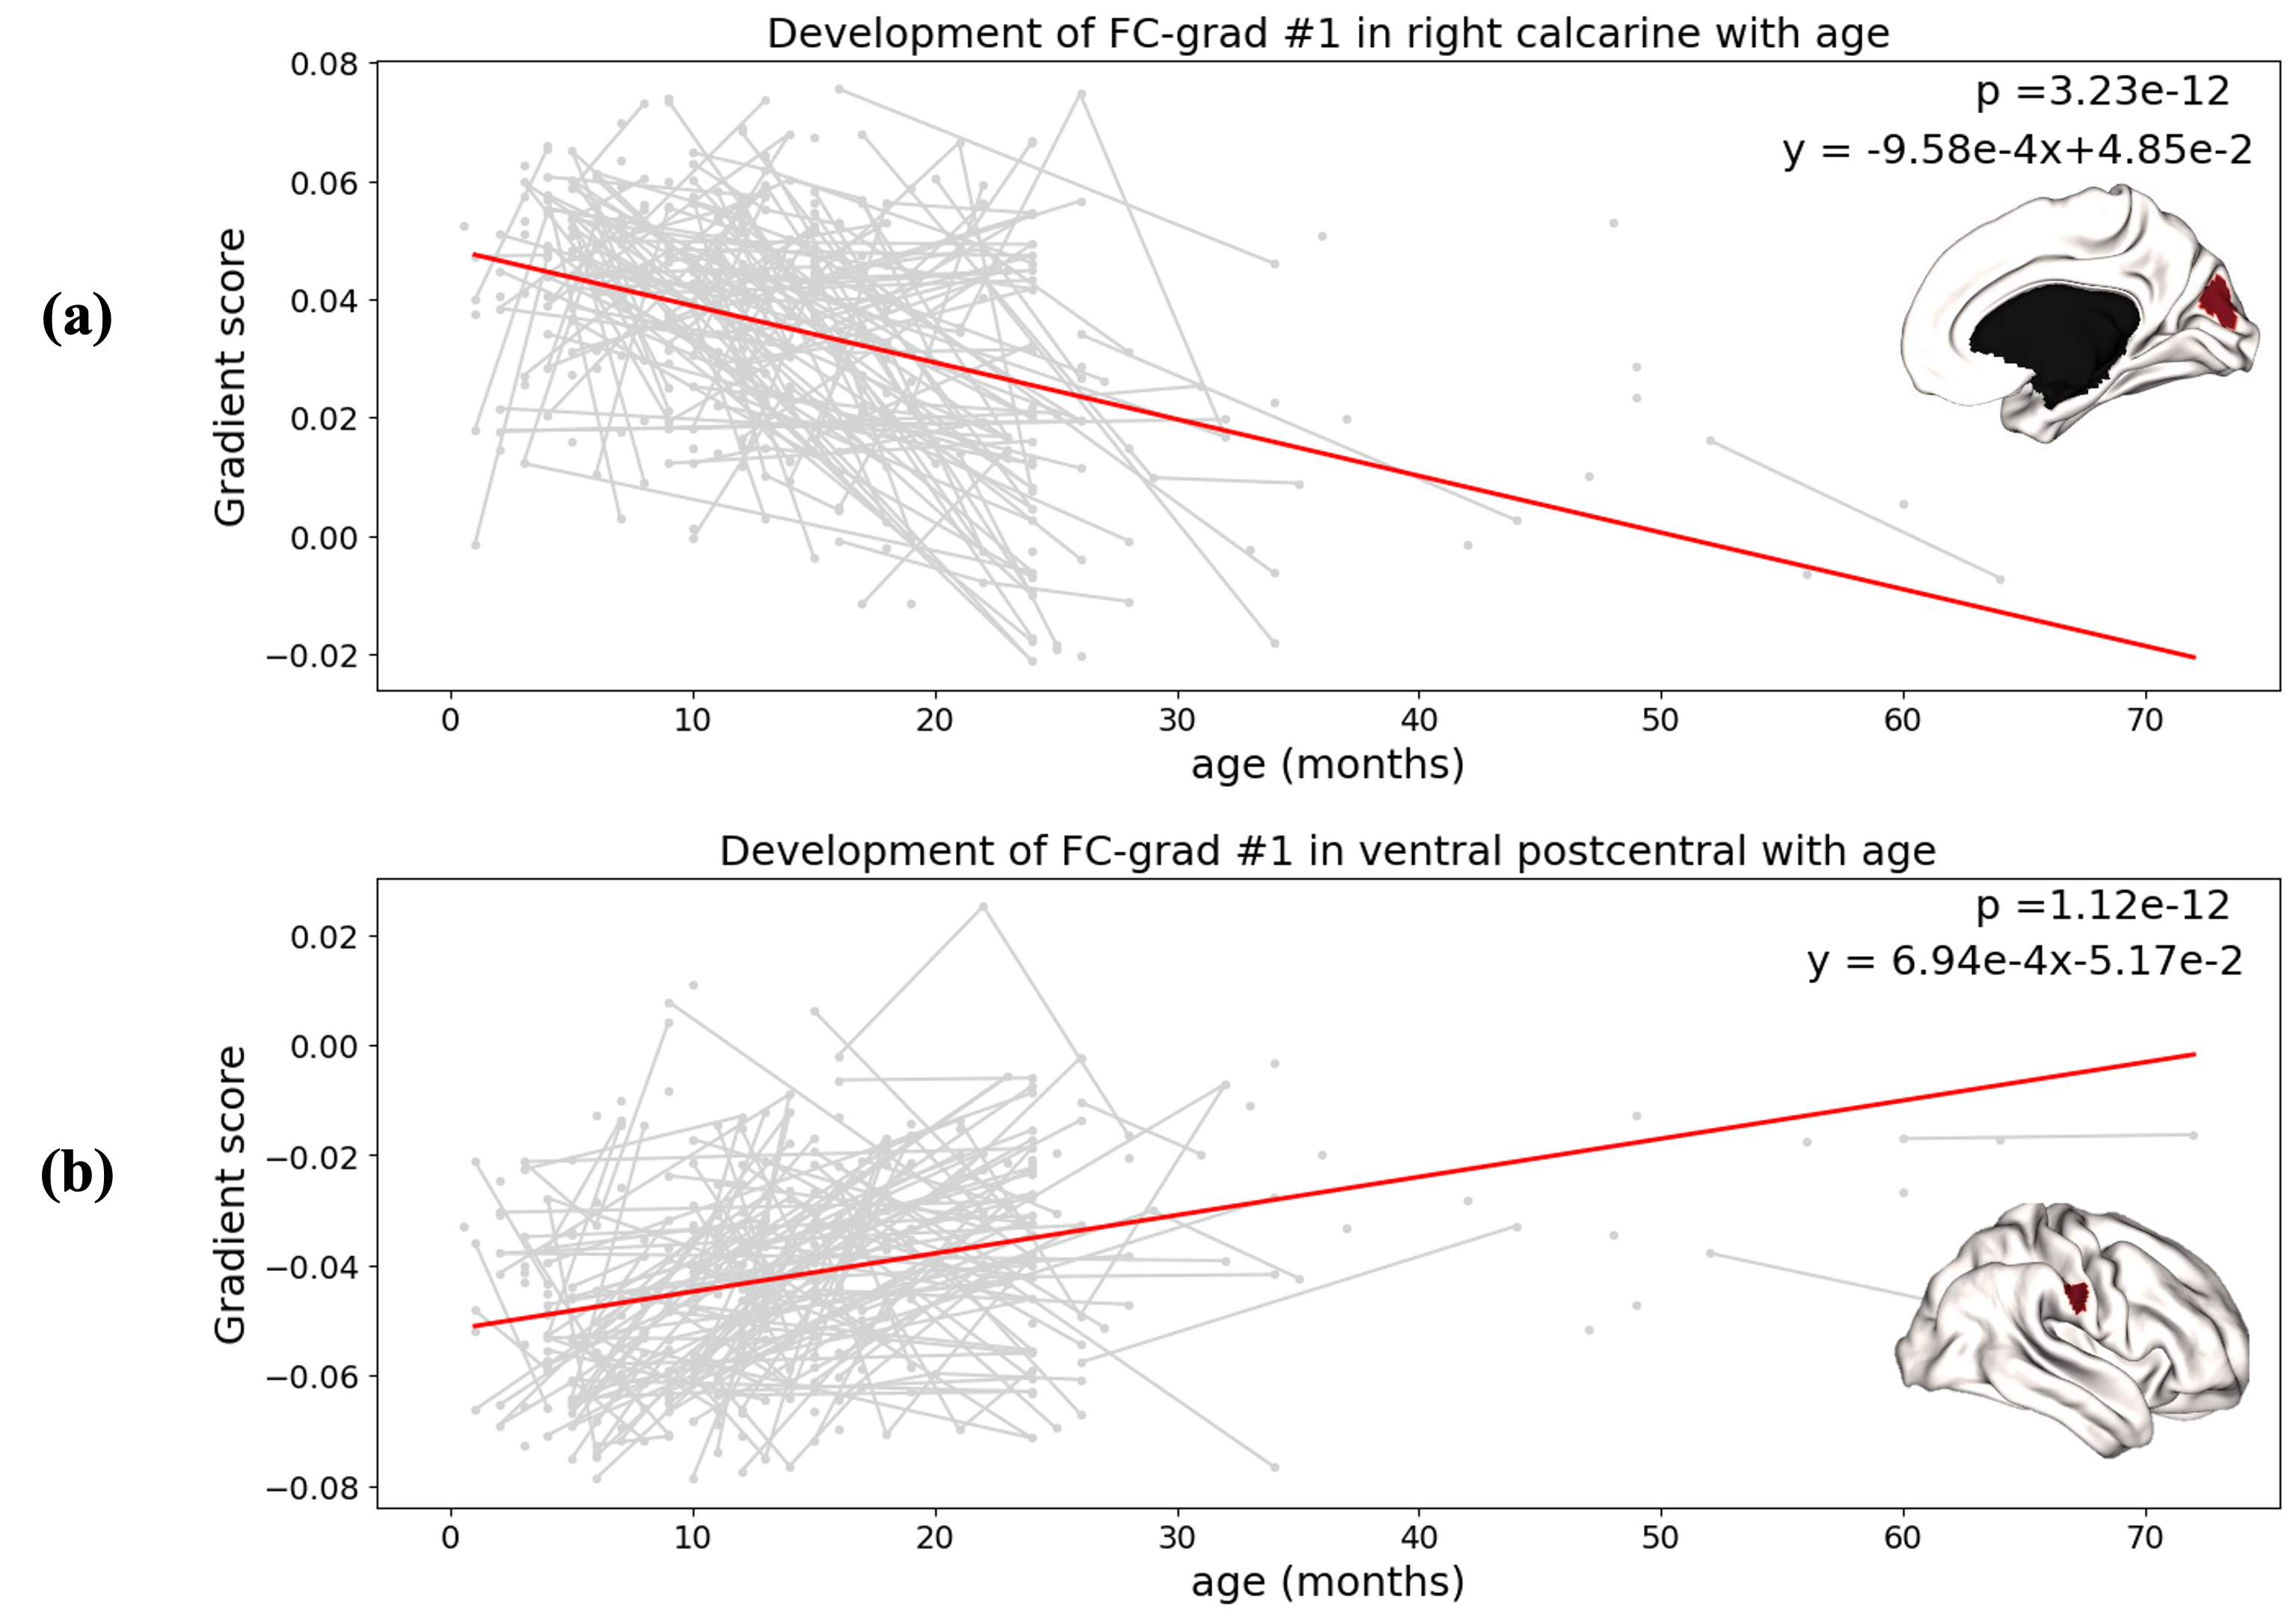
Fig. 2 The fitted linear model for right calcarine (a) and ventral postcentral gyrus (b), both of which have FC-grad #1 scores significantly decrease (toward zero) along development.
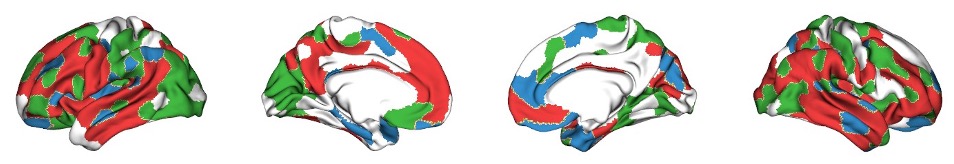
Fig. 3 The brain regions whose FC-grad scores significantly change (p<0.05, FDR corrected) along development. Green color indicates regions with only significantly changed FC-grad #1 scores; blue color indicates regions with only significantly changed FC-grad #2 scores; and red color indicates brain regions with both FC-grads significantly change.
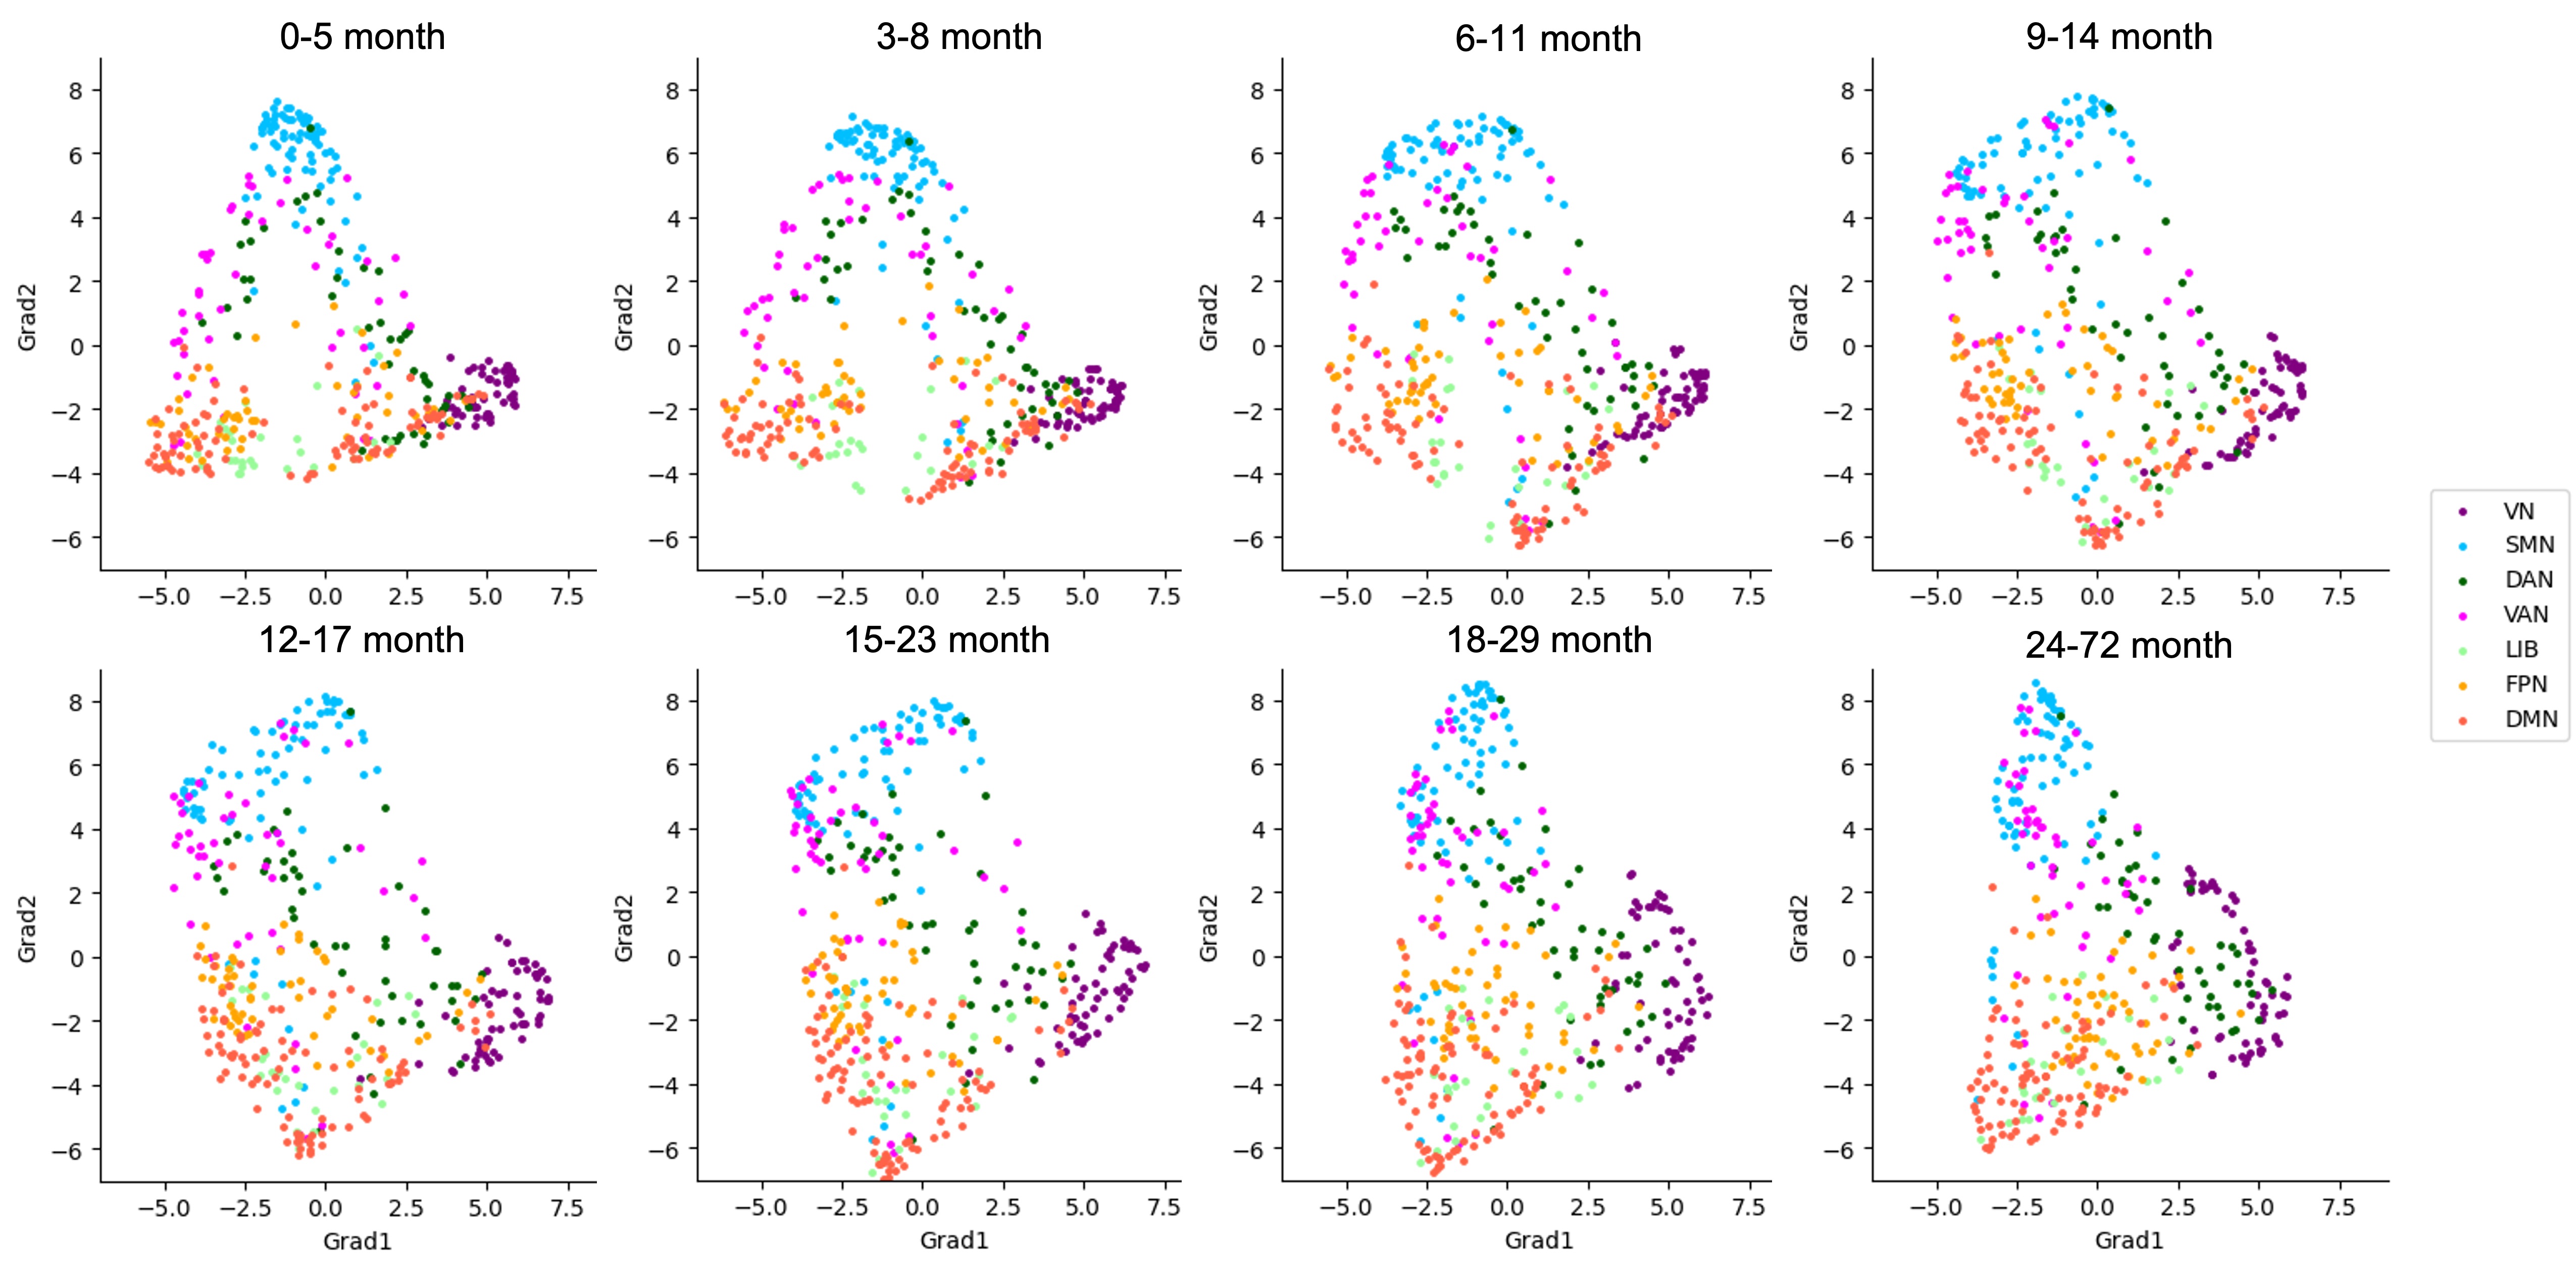
Fig. 4 The 2D scatter plot of the FC-grad pattern at each age groups. Each point in the plot represents a brain region and is colored according to the functional network it belongs to. The horizontal axis represents scores of FC-grad #1 and the vertical axis represents scores of FC-grad #2.