0040
Altered Brain Signaling Complexity in Preterm-born and Term-born Infants at Term Age: a Functional MRI Study1Neuroscience, University of British Columbia, Vancouver, BC, Canada, 2Pediatrics, University of British Columbia, Vancouver, BC, Canada
Synopsis
Keywords: Neonatal, fMRI (resting state), Neuroscience
We compared Hurst exponent (H) values in preterm and term healthy controls to quantify brain signaling criticality using rsfMRI scans. Neonatal data from the Developing Human Connectome Project was analyzed. We found that H significantly increased in the preterm groups longitudinally in all resting state networks. Motor and sensory networks were found to have the greatest increase in H. At term age, very preterm, moderately preterm, and health controls displayed different H values in 8 of the 13 networks examined.Background
Neurodevelopment is a highly vulnerable process; infants born prematurely (< 37 weeks gestational age (GA)) have interrupted brain maturation due to disrupted developmental trajectories1,2. Identifying the functional alterations that occur with premature birth, how they progress to term age and how these compare to term born infants would aid in the understanding of brain development during this critical period. Mono-fractal analysis is an advanced fMRI analysis method that calculates the temporal dynamics and complexity from the blood oxygen level dependent (BOLD) signal instead of the conventional spatial connectivity. The brain is believed to exist in a complex/critical state between order and disorder to optimize neural efficiency, storage capacity and flexibility3. Significant changes in BOLD temporal signal complexity can be measured using the Hurst exponent (H) which quantifies how healthy the brain and its neural networks are functioning. An H value greater than 0.5 signifies greater signaling efficiency, flexibility and processing familiar information, whereas a value of approximately 0.5 signifies random noise, demonstrating less efficient, more distributed and unfamiliar information4. An H value less than 0.5 is less well understood in the literature5. Previous work in our lab has discovered that in very preterm infants' brains, complexity develops from random noise (H ~ 0.5) to greater signal processing at term age (H ~ 0.7). However, it has not yet been investigated how preterm infants compare to healthy term born infants at term equivalent age.Objectives
Our study used mono-fractal analysis of the BOLD signal resting state functional MRI (rs-fMRI) to investigate alterations in brain signaling complexity in preterm infants (scanned shortly after birth and then again at term equivalent scans (TEA)) and term born controls (THC).AIM 1: Preterm to TEA scans were compared in calculating H in the gray matter (GM), white matter (WM) and combined resting state networks (RSN).
AIM 2: Individual RSNs were analyzed in the preterm group to determine which had the greatest increase in H.
AIM 3: The preterm group at TEA were compared to the THC to determine differences in H development in brain tissues and RSNs.
Methods
Participants were analyzed from the third release of the open source Developing Human Connectome Project6. 706 neonatal subjects born 20 to 44 weeks GA were included in this database. Preterm infants were further grouped into very preterm (VPT; < 32 weeks GA; n =83) and moderately preterm (MPT; < 37 weeks GA; n=107). Term born controls were defined as infants born > 37 weeks GA (n=516). rsfMRI data was preprocessed using the dHCP provided anat and fMRI pipelines7,8. Subgroup analysis (n = 52) selected by stratified random sampling underwent independent component analysis (ICA using FSL’s melodic) to manually identify group-level RSNs. The scans were first highpass filtered for 100s and smoothed at 8mm. 13 RSNs were identified from 30 ICA components. fMRI BOLD criticality was determined using H calculated from the power of the BOLD signal using Welch’s method. The mean H was then found in all RSN masks. Brain tissues and RSNs were statistically analyzed using R (v4.0). A mixed linear effects model was used to account for subjects as random effects and marginal means and trends were calculated.Results
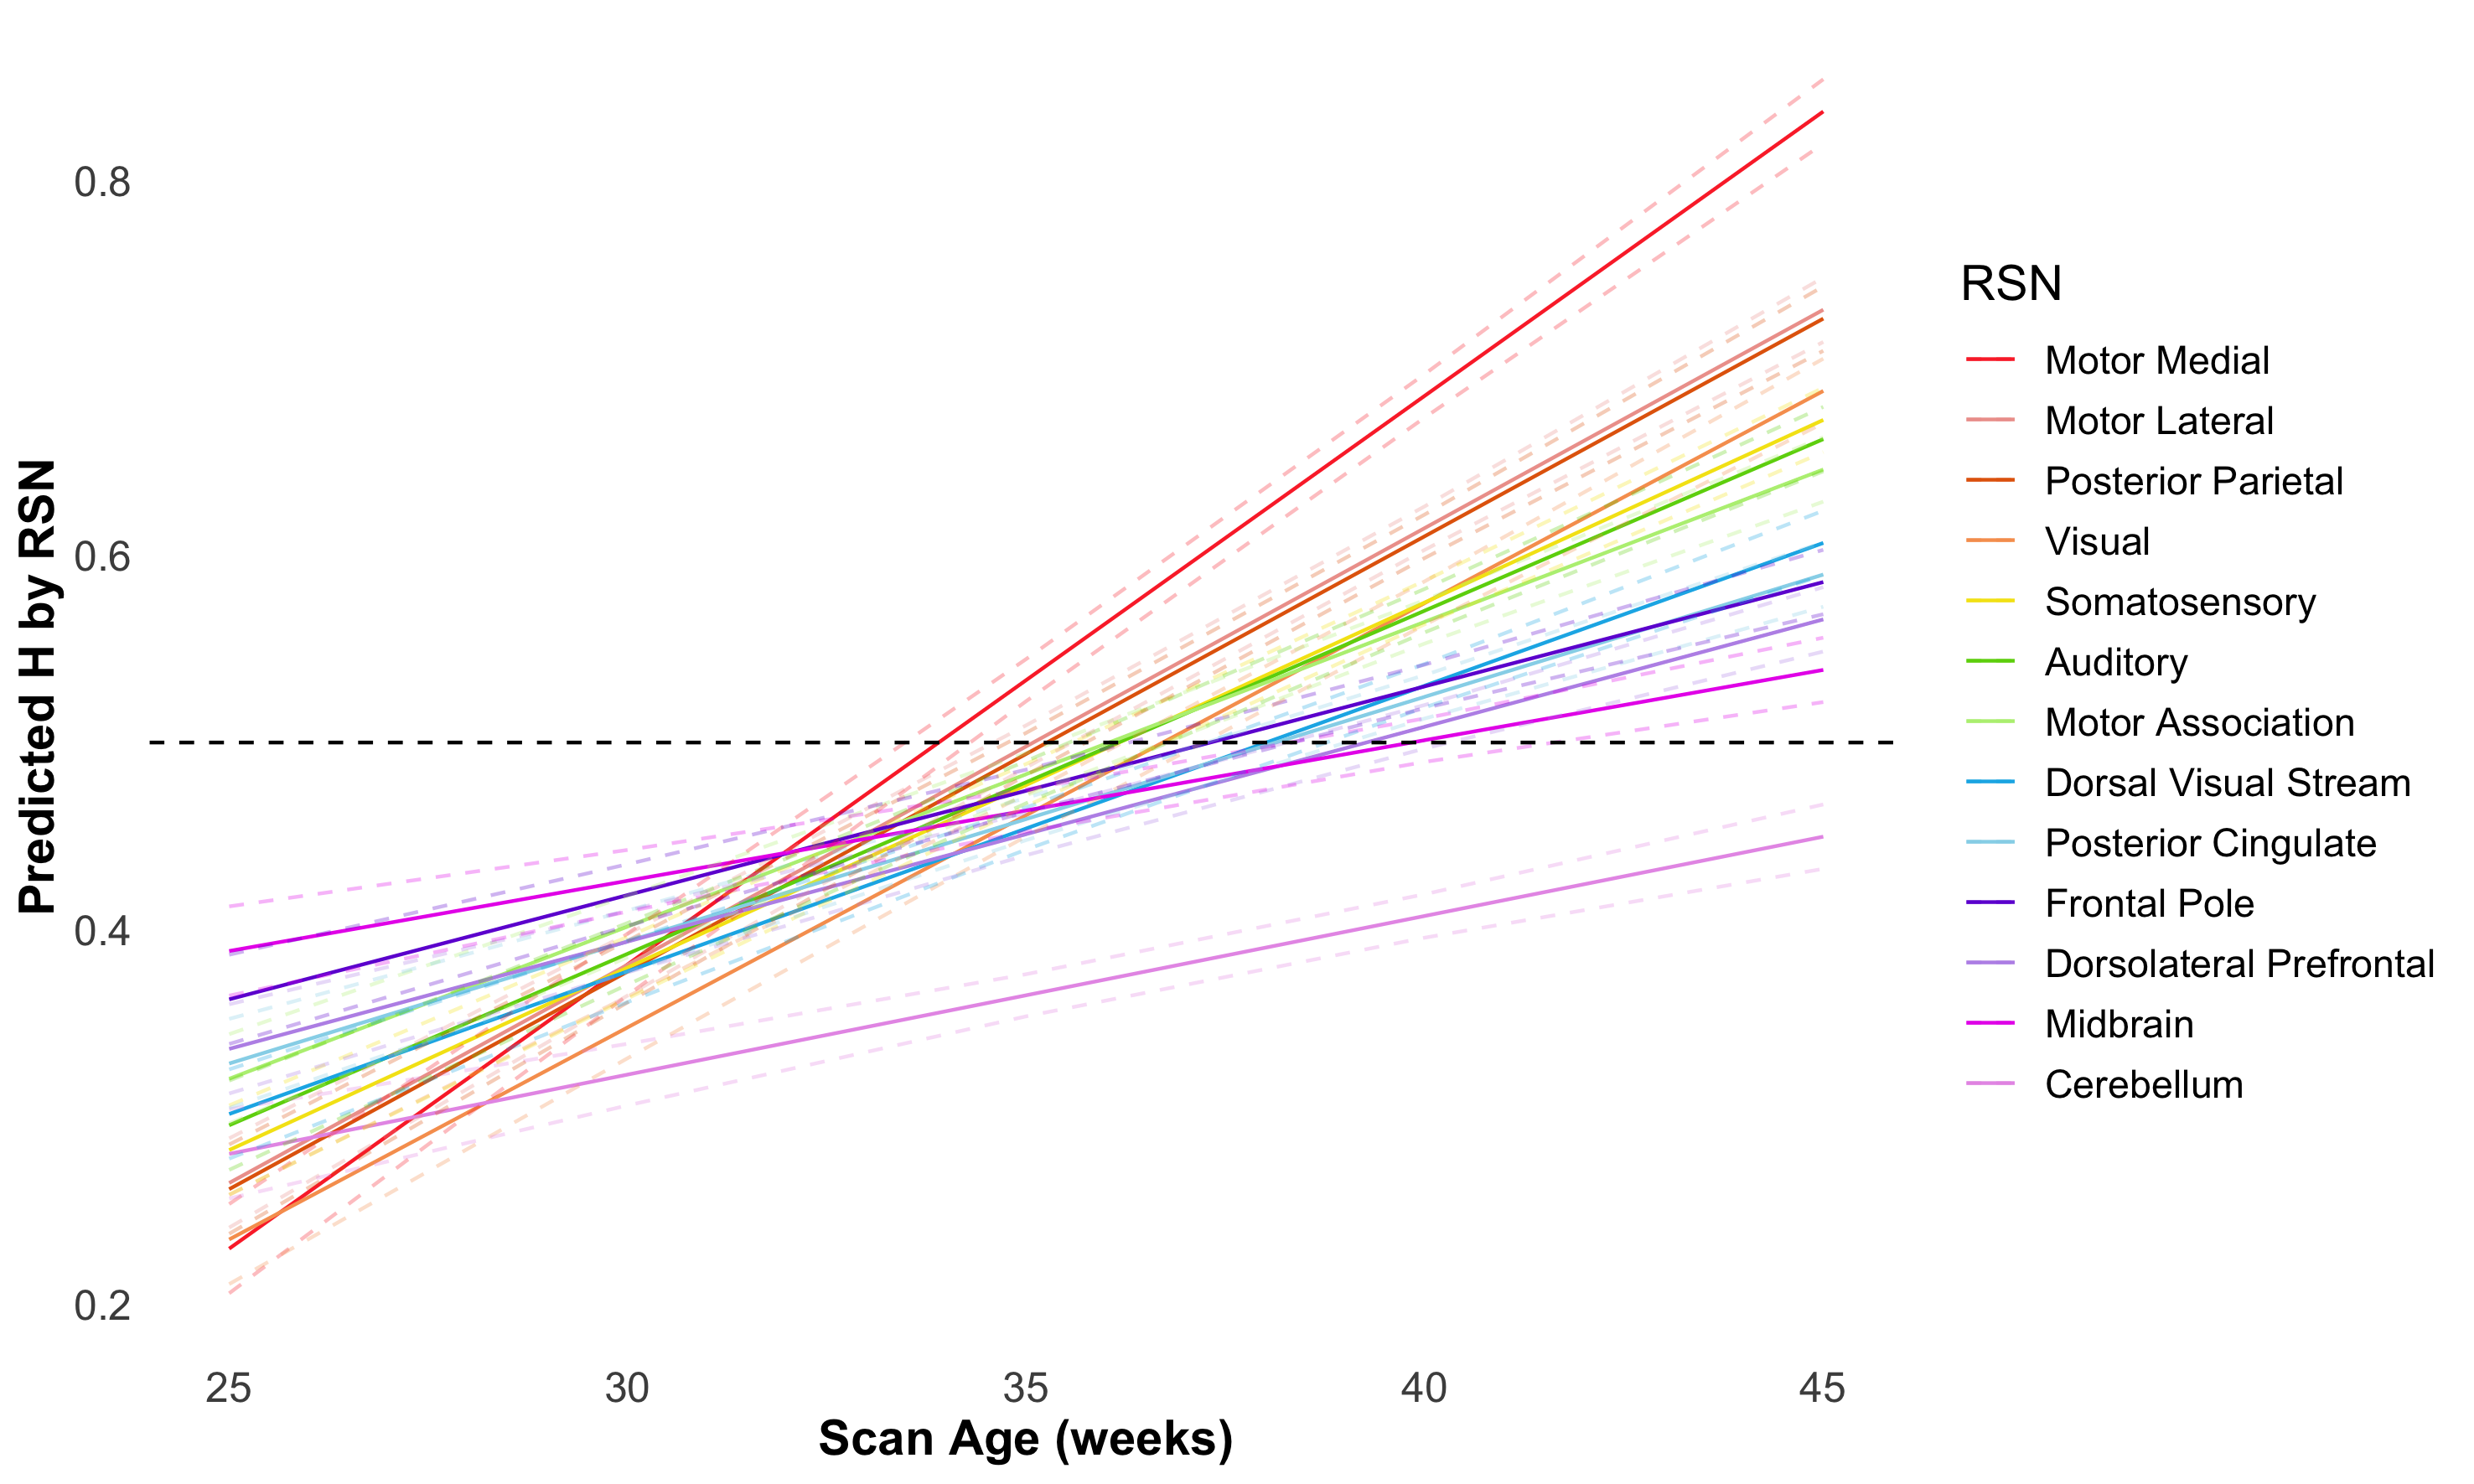
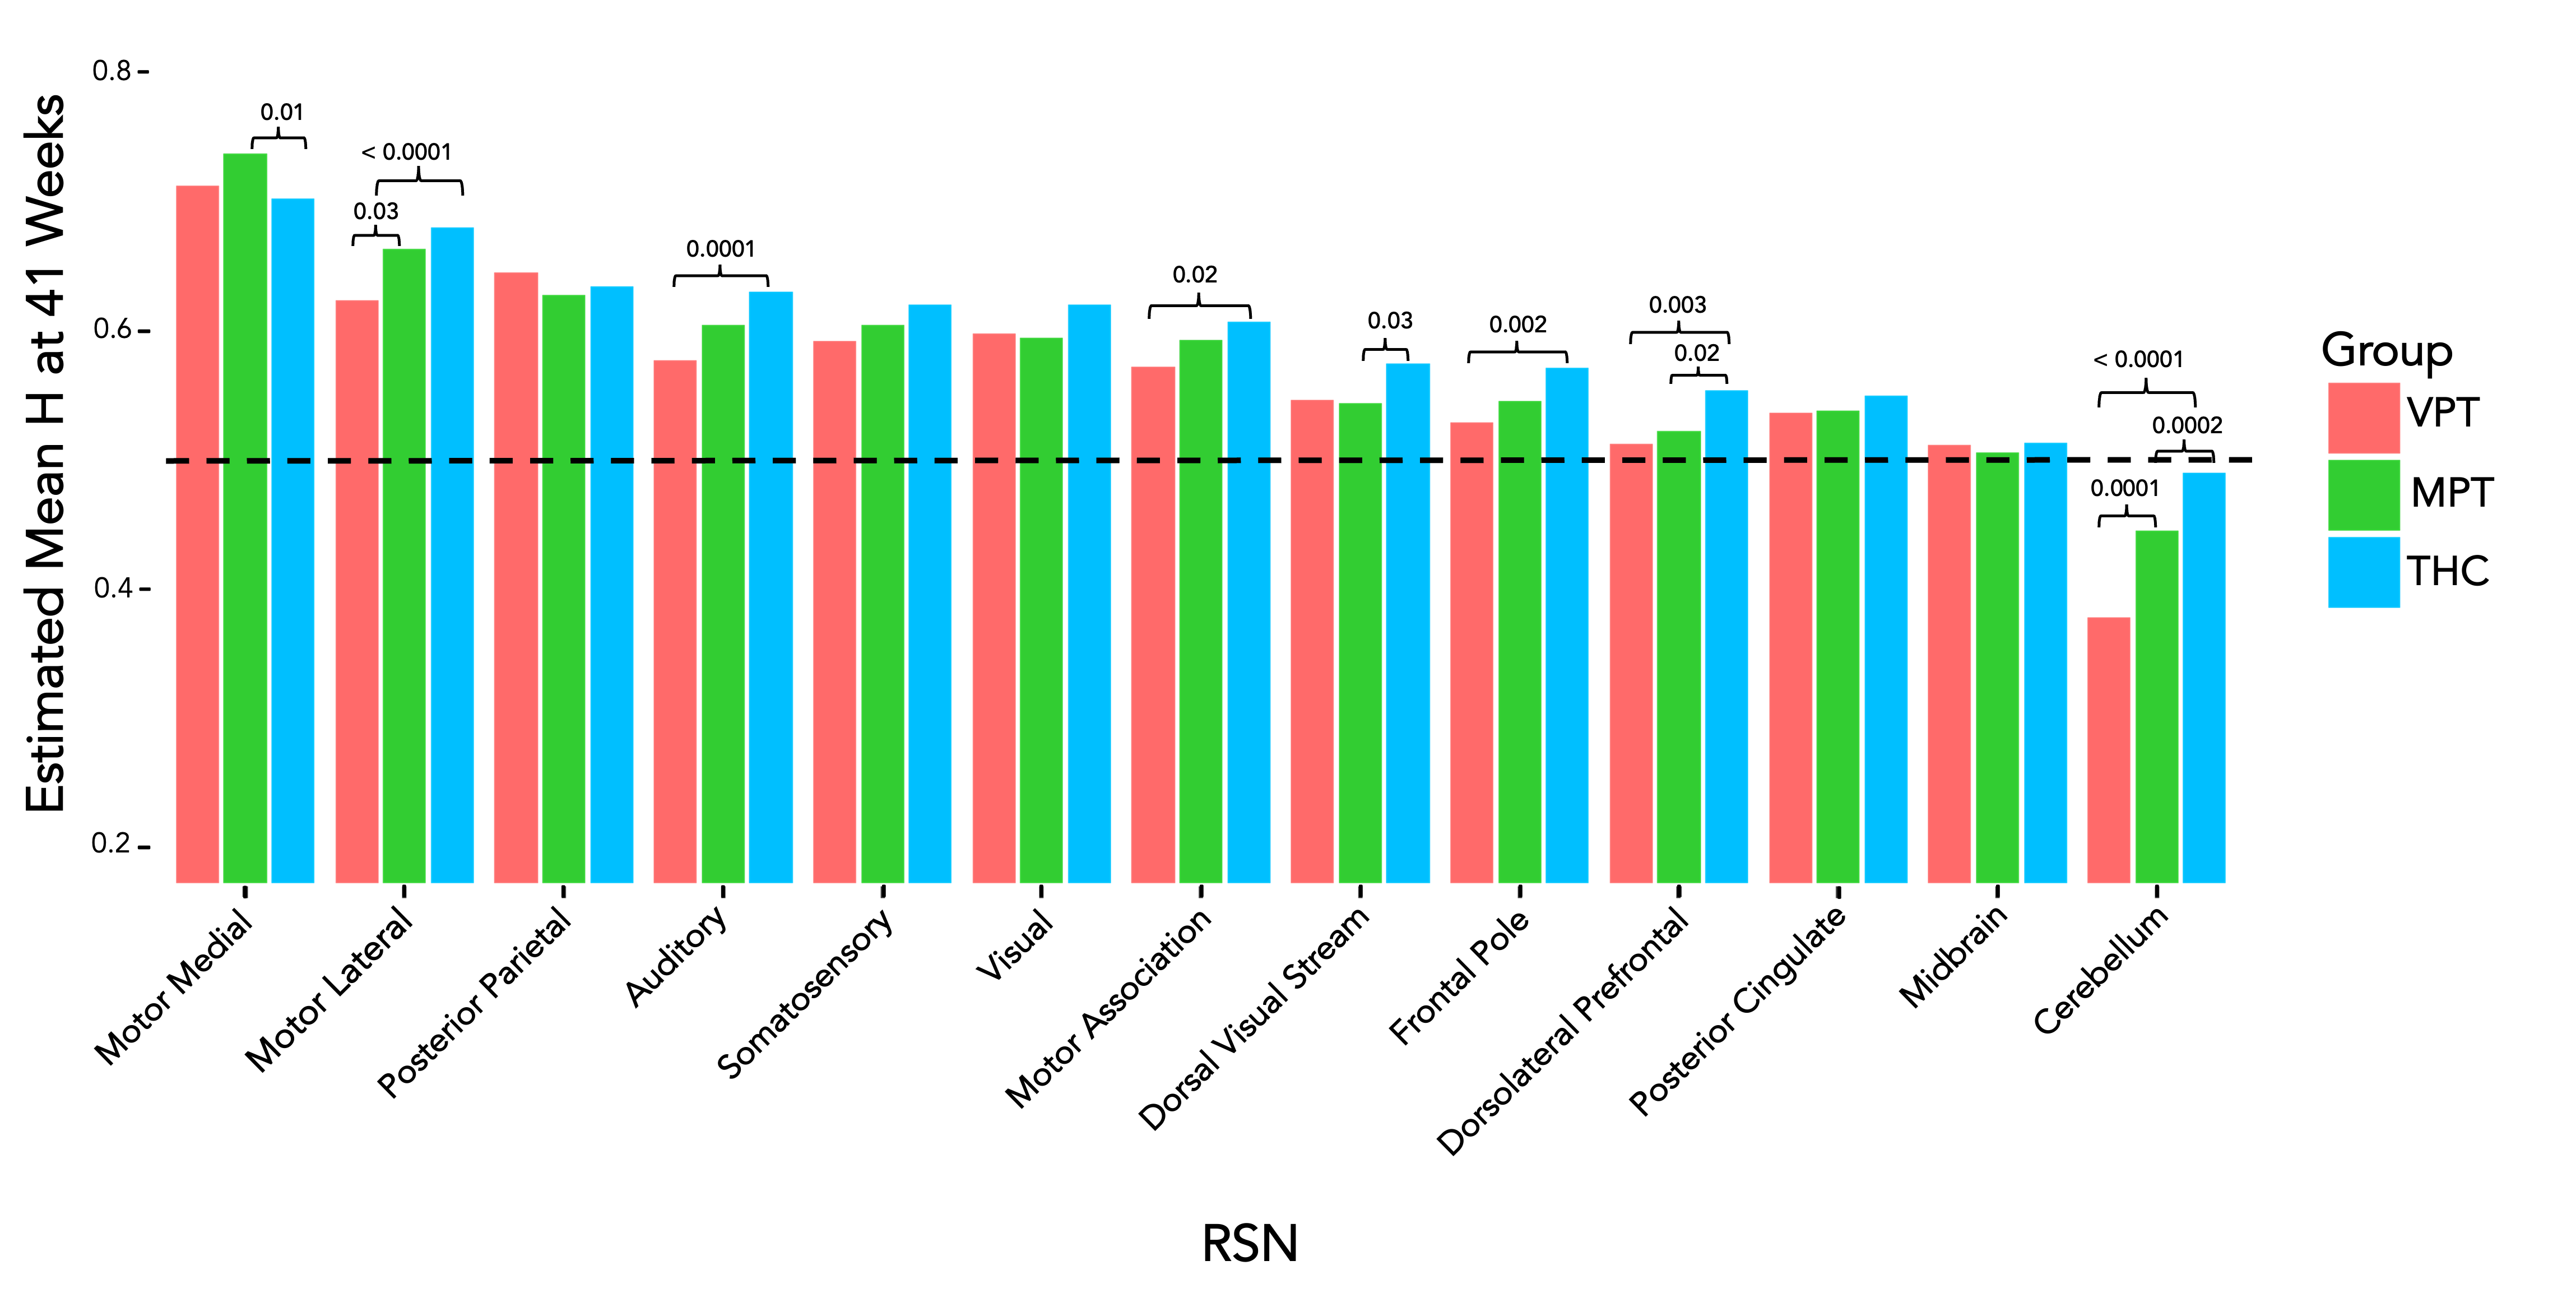
In assessing the preterm group longitudinally, increasing H was found with increasing scan age in all the brain tissues and RSNs as seen in Figure 1. The mean H at 35 weeks in the GM, WM and combined RSN was 0.45, 0.43, and 0.47 respectively. At 41 weeks H values in these regions increased to 0.53, 0.46 and 0.57 respectively. Shown in Figure 1, motor and sensory networks including the motor medial, motor lateral, posterior parietal, visual, somatosensory, motor association and dorsal visual stream increased the greatest. Higher order (dorsolateral prefrontal, frontal pole) and primary lower order networks (cerebellum and midbrain networks) had the smallest increase in H from preterm to TEA scans.The preterm groups at TEA compared to the THC were significantly different in all tissues and RSNs excluding the posterior parietal, posterior cingulate cortex and midbrain networks. In comparing the VPT and MPT at TEA to THC, it was found that the preterm groups were significantly lower than the THC in the GM, WM, dorsolateral prefrontal cortex and cerebellar networks. The VPT group was significantly lower than the THC in the combined RSN, motor lateral, motor association, auditory and frontal pole networks and lower than the MPT group in the motor lateral and cerebellar networks. The MPT was lower than the THC in the dorsal visual stream but higher in the motor medial network. These group differences can be seen in Figure 2.
Conclusion
At birth, motor and sensory systems demonstrate greater growth in brain criticality compared to other functional systems. Preterm infants born before 32 weeks showed reduced H at term age in 6 networks compared to healthy controls. Moderately born preterm infants, however, showed reduced H in 3 networks, and greater H in the motor medial network compared to healthy controls. This is the first study to explore brain criticality in preterm infants compared to term age and term born controls.Acknowledgements
We would like to acknowledge funding support from British Columbia Children's Hospital and data from this study provided by the Developing Human Connectome Project. We would also like to acknowledge previous work done by Johann Drayne and research guidance from Tamara Vanderwal and Steven Miller.
References
1. Vo Van, P., Alison, M., Morel, B., Beck, J., Bednarek, N., Hertz-Pannier, L., & Loron, G. (2022). Advanced Brain Imaging in Preterm Infants: A Narrative Review of Microstructural and Connectomic Disruption. Children, 9(3), 356. https://doi.org/10.3390/children9030356
2. Smyser, C. D., Inder, T. E., Shimony, J. S., Hill, J. E., Degnan, A. J., Snyder, A. Z., & Neil, J. J. (2010). Longitudinal Analysis of Neural Network Development in Preterm Infants. Cerebral Cortex, 20(12), 2852–2862. https://doi.org/10.1093/cercor/bhq035
3. Zimmern, V. (2020). Why Brain Criticality Is Clinically Relevant: A Scoping Review. Frontiers in Neural Circuits, 14, 54. https://doi.org/10.3389/fncir.2020.00054
4. Campbell, O. L., & Weber, A. M. (2022). Monofractal analysis of functional magnetic resonance imaging: An introductory review. Human Brain Mapping, 43( 8), 2693– 2706. https://doi.org/10.1002/hbm.25801
5. Diaz M, H. A., & Cordova, F. (2022). On the meaning of Hurst entropy applied to EEG data series. Procedia Computer Science, (199) 1385-1392. https://doi.org/10.1016/j.procs.2022.01.175
6. Hughes, E.J., Winchman, T., Padormo, F., Teixeira, R., Wurie, J., Sharma, M., Fox, M., Hutter, J., Cordero-Grande, L., Price, A.N., Allsop, J., Bueno-Conde, J., Tusor, N., Arichi, T., Edwards, A.D., Rutherford, M.A., Counsell, S.J. and Hajnal, J.V. (2017), A dedicated neonatal brain imaging system. Magn. Reson. Med., 78: 794-804. https://doi.org/10.1002/mrm.26462
7. Makropoulos, A., Robinson, E.C., Schuh, A., Wright, R., Fitzgibbon, S.P., Bozek, J., Counsell, S.J., Steinweg, J., Vecchiato, K., Passerat-Palmbach, J., Lenz, G., Mortari, F., Tenev, T., Duff, E.P., Bastiani, M., Cordero-Grande, L., Hughes, E., Tusor, N., Tournier, J.-D., Hutter, J., Price, A.N., Teixeira, R.P.A.G., Murgasova, M., Victor, S., Kelly, C., Rutherford, M.A., Smith, S., Edwards, A.D., Hajnal, J.V., Jenkinson, M., Rueckert, D. The Developing Human Connectome Project: a Minimal Processing Pipeline for Neonatal Cortical Surface Reconstruction NeuroImage (2018), 173: 88-112. DOI: 10.1016/j.neuroimage.2018.01.054
8. Fitzgibbon, SP., Harrison, SJ., Jenkinson, M., Baxter, L., Robinson, EC., Bastiani, M., Bozek, J., Karolis, V., Cordero Grande, L., Price, AN., Hughes, E., Makropoulos, A., Passerat-Palmbach, J., Schuh, A., Gao, J., Farahibozorg, S., O’Muircheartaigh, J., Ciarrusta, J., O’Keeffe, C., Brandon, J., Arichi, T., Rueckert, D., Hajnal, JV., Edwards, AD., Smith, SM., Duff, E., Andersson, J. The developing Human Connectome Project automated functional processing framework for neonates., NeuroImage (2020), 223: 117303, 2020. DOI: 10.1016/j.neuroimage.2020.117303 Authors contributed equally.
Figures