0037
Brain Metabolite Concentrations of White Matter and Grey Matter in Perinatal HIV Infected Adults Using a Whole-Brain MR Spectroscopic Imaging1Univerity of Miami, Miami, FL, United States, 2University of Missouri-Kansas City School of Medicine, Kansas City, MO, United States
Synopsis
Keywords: Infectious disease, Spectroscopy
With the advent of antiretroviral therapy (ART), perinatally HIV-infected children have been able to transition into adulthood. However, the long term impact of HIV infection and the potential toxic effects of long term use of antiretroviral therapeutics on brain metabolites are not completely characterized. In this study, a whole-brain MRSI method is used to quantitate changes in brain metabolites, N-acetyl aspartate (NAA), total-creatine (Cr) and total-choline (Cho), in PHIV+ adults compared to matched controls. Results show significant alterations of proton MRS-observed metabolites in the whole brain of PHIV+ as they reach adulthood despite their adherence to ART.Introduction
As of 2016 there were 2.1 million perinatally infected children living with HIV.1 However the total population of perinatally HIV-infected patients (PHIV+) is likely to be much larger as many infected children have now transitioned into adulthood since the advent of antiretroviral therapy (ART). Neuroimaging studies in the population of long-term ART-treated PHIV+ have primarily focused on structural (morphometry) and microstructural (DTI) alterations, with evidence of lower cortical thickness and subcortical grey matter volumes, axonal degeneration, and demyelination.2,3 However, MRS-based studies are fewer, with most targeting PHIV+ children between 5-12 years of age.4,5 The long term impact PHIV+ adults with persistent HIV reservoir in the brain, and the potential toxic effects of long term use of some of its antiretroviral therapeutics on brain metabolites has not been completely characterized . Though metabolite differences can be expected to occur throughout the brain, predominantly in certain regions and subtly in other regions in sync with the anatomical distribution of the viral load, previous studies have evaluated metabolite changes only in few select brain anatomical regions using single voxel SVS. In this study, a whole-brain MRSI method is used to quantitate changes in brain metabolites, N-acetyl aspartate (NAA), total-creatine (Cr) and total-choline (Cho), in a group of PHIV+ adults compared to a matched community control sample.Methods
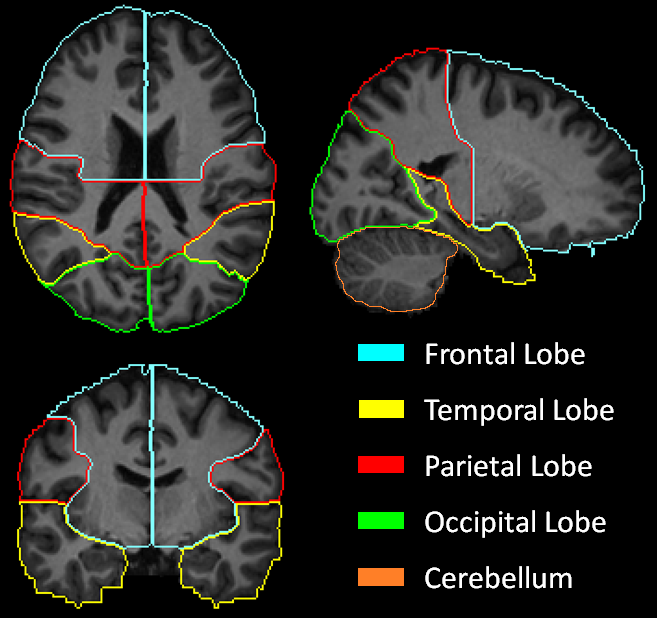
MRSI data were acquired at 3T from 28 PHIV+ individuals (age: 20.3±1.9 years, 14M/14F) and 28 controls (age: 20.8±1.7 years, 13M/15F) using our volumetric spin-echo EPSI sequence (TR/TE=1710/70 ms, 135 mm slab, Tacq= 26 min). Data were processed using the MIDAS package.6 Briefly, the gradient echo (TE=6.3 ms) water signal reference EPSI data acquired in an interleaved fashion was used for the metabolite signal normalization. The signal normalized individual-subject MRSI data (64x64x32 mm3; ~1mL voxel volume) and segmented tissue type, white matter (WM) and gray matter (GM) and cerebrospinal fluid (CSF) partial volume maps were then spatially registered with the MNI single-subject T1-MRI template.Data were selected for analysis using a 9-region lobar atlas7 (frontal, temporal, parietal and occipital lobes in the left and right side, and cerebellum) defined in the template space (Figure 1). The quality of data picked for analysis was controlled by including only spectra from voxels with ≤30% CSF, and fitted spectral linewidths ≤12 Hz. The metabolite concentration corresponding to 100% GM or WM in each of the 8 lobar regions was calculated by regressing the tissue partial volume against the metabolite concentration and extrapolating it to 100% of GM or WM.
NAA, Cr and Cho values (in institutional units), and ratios of Cho/Cr, NAA/Cr, and Cho/NAA were first compared between the left and right lobes, for control and PHIV+ subjects separately, using pairwise t-test (p<0.05 bonferroni corrected) to establish if there was contra-lateral symmetry in metabolic concentrations. Second, we perform between-group comparisons using non-parametric ANCOVA controlling for age and sex (p<0.05 FDR correced).
Results
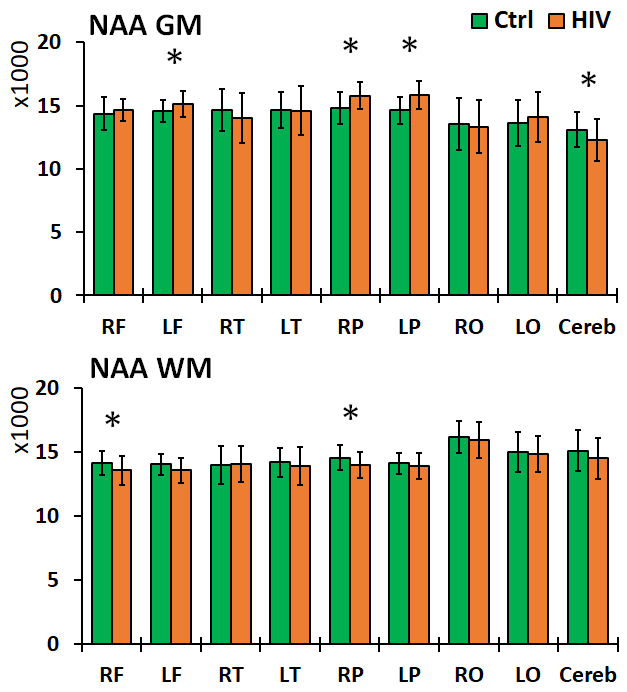
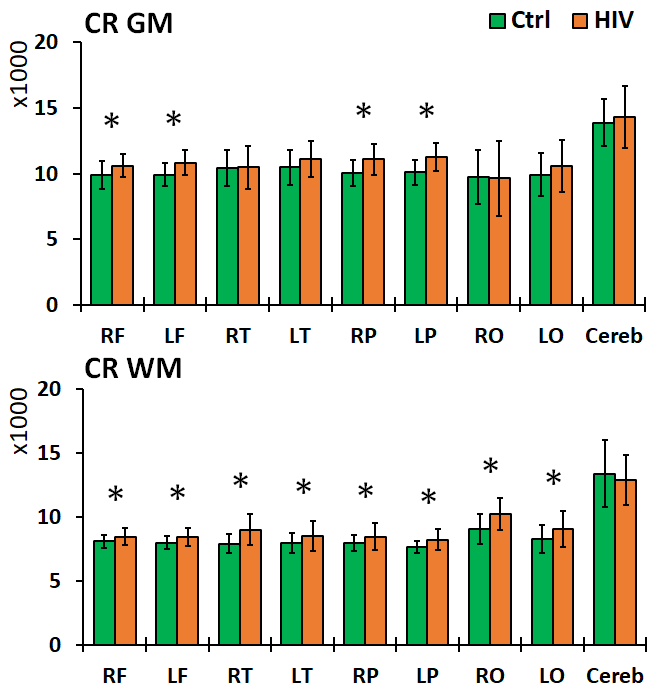
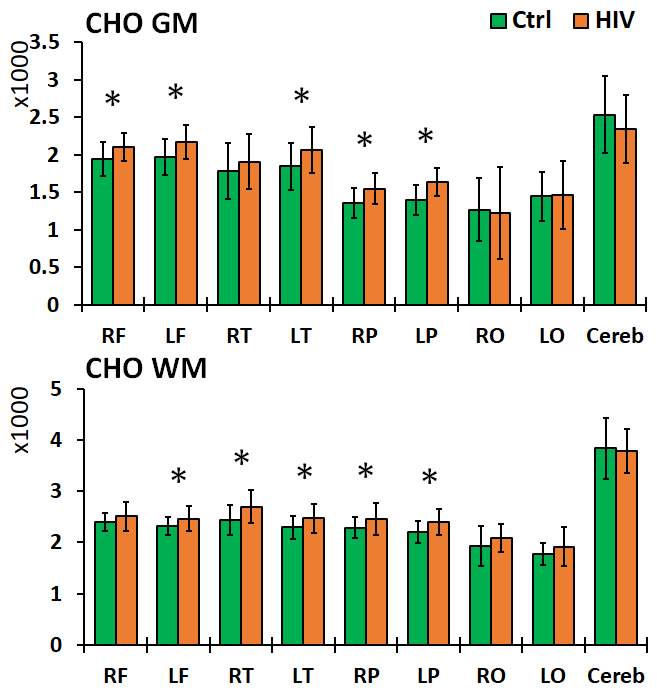
Left and right brain comparisons show asymmetry for both control and PHIV+ subjects. Asymmetry in Cho, Cho/Cr and Cho/NAA was observed everywhere, while NAA and Cr asymmetry was only observed in the parietal and occipital WM. Between-group comparisons showed increased levels of NAA in the frontal and parietal GM, and decreases in the frontal and parietal WM and GM cerebellum for PHIV+ subjects (Figure 2). Concentrations of Cr were significantly increased for PHIV+ subjects throughout all 8 lobes and all tissue types (WM/GM), except in the GM of the occipital and temporal lobes (Figure 3). Cho levels were also elevated in PHIV+ in all lobes and tissue types except the occipital lobe and cerebellum (Figure 4). NAA/Cr was lower in all regions except pirietal and occipital WM, while Cho/NAA was higher primarily in the WM.Discussion
Reductions in NAA and NAA/Cr for the PHIV+ group in WM, notably the frontal and parietal lobes, is generally an indicator of reduced neuronal integrity, viability, and dysfunctions due to HIV infection. Though neurons are not known to be infected by HIV itself, the viral products in the vicinity of neurons impact them. This is mirrored by the increase in Cho and Cho/NAA, primarily in WM lobes, reflecting cell membrane disruption, active demyelination, microglial proliferation, reactive astrogliosis and inflammation. While studies in the past have assumed that the concentration of Cr does not change significantly with HIV,8 our results show increased Cr in all WM and most GM lobes in PHIV+ patients, as a marker of increased brain energy metabolism.Conclusion
This study shows that significant alterations of proton MRS-observed metabolites can still occur in the whole brain of PHIV+ as they reach adulthood despite their adherence to ART. Further studies are needed to understand how these metabolite levels correlate with HIV clinical factors (CD4, viral load), and neuro-psychological assessment scores.Acknowledgements
Supported by Burroughs-Wellcome Fund and NIH R01 NS094043.References
1. WHO. Prevent HIV, Test and Treat All: WHO Support for Country Impact. Progress Report 2016.
2. Martín-Bejarano M, Ruiz-Saez B, Martinez-de-Aragón A, et al. A Systematic Review of Magnetic Resonance Imaging Studies in Perinatally HIV-Infected Individuals. AIDS Rev. 2021 Dec 29;23(4):167-185.
3. Van den Hof M, Ter Haar AM, Caan MWA, et al. Brain structure of perinatally HIV-infected patients on long-term treatment: A systematic review. Neurol Clin Pract. 2019 Oct;9(5):433-442.
4. Graham AS, Holmes MJ, Little F, et al. MRS suggests multi-regional inflammation and white matter axonal damage at 11 years following perinatal HIV infection. Neuroimage Clin. 2020;28:102505.
5. Robertson FC, Holmes MJ, Cotton MF, et al. Perinatal HIV Infection or Exposure Is Associated With Low N-Acetylaspartate and Glutamate in Basal Ganglia at Age 9 but Not 7 Years. Front. Hum. Neurosci., 07 May 2018.
6. Maudsley AA, Darkazanli A, Alger JR, et al. Comprehensive processing, display and analysis for in vivo MR spectroscopic imaging. NMR in biomedicine. 2006;19(4):492-503.
7. Maudsley AA, Domenig C, Govind V, et al. Mapping of brain metabolite distributions by volumetric proton MR spectroscopic imaging (MRSI). Magnetic resonance in medicine: official journal of the Society of Magnetic Resonance in Medicine/Society of Magnetic Resonance in Medicine. 2009;61(3):548-559.
8. Bairwa D, Kumar V, Vyas S, et al. Case control study: magnetic resonance spectroscopy of brain in HIV infected patients. BMC Neurol. 2016 Jul 12;16:99.
Figures