0036
Association between PET-MR imaging measures of blood-brain barrier leakage and immune cell activation in acute intracerebral hemorrhage1Division of Psychology, Communication and Human Neuroscience, University of Manchester, Manchester, United Kingdom, 2Geoffrey Jefferson Brain Research Centre, Manchester, United Kingdom, 3Division of Cardiovascular Sciences, University of Manchester, Manchester, United Kingdom, 4Division of Informatics, Imaging & Data Sciences, University of Manchester, Manchester, United Kingdom, 5Manchester Centre for Clinical Neurosciences, Northern Care Alliance NHS Foundation Trust, Manchester, United Kingdom
Synopsis
Keywords: Neuroinflammation, PET/MR
Intracerebral hemorrhage is a severe form of stroke. Secondary injury involves a cascade of pathophysiological changes thought to begin with microglial activation and result in blood-brain barrier(BBB) breakdown and edema formation. In this study, patients underwent dynamic contrast-enhanced MRI and [11C](R)-PK11195 PET, which measure BBB leakage and binding to the translocator protein 18kDa (TSPO) expressed on activated microglia, respectively. BBB leakage and TSPO binding were elevated in the edema. Mean co-localisation of BBB leakage and TSPO binding was 5.6%; drugs targeting inflammation may cross the BBB into 0-28% of target tissue. Modified Rankin Scale scores negatively correlated with BBB leakage.
Introduction
Intracerebral hemorrhage(ICH) is a severe form of stroke resulting from a bleed in the brain tissue, characterised by immediate physical injury followed by a secondary cascade of pathophysiological changes. Microglia express a proinflammatory phenotype within hours of onset, releasing cytokines and chemokines which activate astrocytes and endothelial cells thought to impact blood-brain barrier(BBB) breakdown, recruitment of leukocytes, and perihematomal edema(PHE) formation1. Neuroinflammation may represent an ideal target for the treatment of secondary injury post-ICH.[11C](R)-PK11195 PET can map the translocator protein 18kDa(TSPO), expressed on activated microglia and macrophages. DCE-MRI tracks the movement of contrast-agent through and out of leaky vessels to quantify the permeability-surface-area-product(Ktrans) and blood-plasma volume(vp).
Post-stroke angiogenesis is known to effect recovery and is thought to be mediated by inflammation2. Kgad=Ktrans/vp~2P/r, where r is capillary radius, has been suggested to represent the ‘gadolinium exchange rate’3 and is independent of the volume of vessels. We propose that Kgad and Ktrans detect subtly different aspects of capillary permeability and morphology which may reveal different sensitivities to angiogenic-related change.
The aims of this study are:
- Test whether Ktrans and [11C](R)-PK11195 binding potential are elevated in the PHE surrounding the ICH, and relate to peripheral inflammatory markers or outcome after stroke.
- Identify if BBB leakage and TSPO binding co-localise in the ICH brain, with a view to potential for delivery of anti-inflammatory drugs that cannot cross an intact BBB.
- Explore relationships between DCE-MRI measures and angiogenesis.
Methods
36 patients underwent DCE-MRI 1-4 days post-ICH. A subset (n=16) returned for [11C](R)-PK11195 PET, 1-7 days post-ICH. Inflammatory blood markers IL-6 and CRP were measured at the time of scanning, and modified Rankin Scale scores(mRS) collected at 90 days post-ICH.For DCE-MRI, 80x3D-T1-FFE images were acquired with a 10° flip-angle, TR/TE=2.4/0.8ms, spatial resolution=1.5mm×1.5mm×4mm, temporal resolution=7.6s, acquisition time=10min. On the 8th dynamic, a 0.1 mmol/kg bolus of Dotarem was administered using a power injector. A pre-contrast T1 map was used to convert signal to contrast-agent concentration. The vascular input function was obtained from 50 voxels segmented from the sagittal sinus and the Patlak model was fit to the concentration time-course data to generate maps of Ktrans, vp, and Kgad.
[11C](R)-PK11195 PET data was collected and reconstructed as described previously5; the simplified reference tissue model was used with a reference tissue input function extracted from the cerebellar grey matter to generate maps of tracer binding potential (BPND).
Regions of interest were drawn around the PHE on T2-weighted FLAIR images. Regions were reflected about the midline to create control regions. Median values for Ktrans, vp, Kgad, and BPND were extracted from the PHE and compared to the control region using a paired t-test; difference values between the PHE and control regions were assessed for correlation with IL-6, CRP and mRS using Pearson’s r, significance level p<0.05.
To quantify co-localisation between BBB leakage and [11C](R)-PK11195 BPND, patient-specific thresholds defined by the M+2SD of the control region were used to delineate regions of significantly elevated Ktrans and BPND, and the Sorensen-Dice coefficient used to measure region similarity.
Results
Ktrans, Kgad and BPND were significantly elevated in the PHE compared to the control region; vp was decreased in the PHE(Figure 1).Figure 2 demonstrates different patterns of neuroinflammation observed. BBB leakage was identified around the perihematomal rim, whereas spatial patterns of BPND varied: in some patients, a widespread inflammatory response was observed throughout the brain; in others it was localised around the ICH. Regions of elevated Ktrans and BPND had a mean similarity of 5.6%, co-localisation of the two measures ranged from 0-28% of the PHE.
No measures correlated with IL-6 or CRP. DCE-MRI measures did not correlate with BPND(Figure 3). mRS was negatively correlated with both Ktrans and Kgad, but not vp or BPND(Figure 4).
Discussion
Ktrans and Kgad were elevated in the PHE compared to the control region while vp was not, indicating BBB leakage irrespective of vessel density. Therefore, measured signal was likely a result of the leakage of existing vessels damaged by the stroke, rather than angiogenic vessels with an immature BBB. It is thought that angiogenesis does not begin until 7 days post-ICH4. BBB breakdown was observed in the perihematomal rim, replicating findings from previous studies5,6,7.BBB leakage and TSPO expression were observed acutely after ICH. No DCE-MRI parameters were correlated with [11C](R)-PK11195 BPND in the PHE. Areas of elevated BBB breakdown and TSPO binding had a mean overlap of 5.6%, suggesting that these processes are spatially distinct, as has also been reported in small vessel disease8. The limited co-localisation of TSPO binding and increased Ktrans suggest that drugs unable to cross the intact BBB are unlikely to reach areas of microglial activation.
mRS was found to negatively correlate with BBB leakage, indicating patients with greater BBB breakdown had better functional outcomes. Similar results were found in ischaemic stroke patients, where higher Ktrans 7-days post-stroke was associated with low 3-month mRS9.
DCE-MRI measurements were collected 1-4 days post-stroke, and TSPO-PET at 1-7 days post-stroke. This could result in patients being at varied inflammatory phases at the time of measurement. The influence of neuroinflammation on patient outcome after brain injury is complex and requires further investigation.
Acknowledgements
This study was funded by an NIHR Clinician Scientist Award (Ref: CS-2014-14-005) to APJ.References
1. Askenase MH, Sansing LH. Stages of the Inflammatory Response in Pathology and Tissue Repair after Intracerebral Hemorrhage. Seminars in neurology. 2016;36(3):288-297. doi:10.1055/s-0036-1582132
2. Zhu H, Zhang Y, Zhong Y, et al. Inflammation-Mediated Angiogenesis in Ischemic Stroke. Frontiers in Cellular Neuroscience. 2021;15:652647. doi:10.3389/fncel.2021.652647
3. Shao X, Jann K, Ma SJ, et al. Comparison Between Blood-Brain Barrier Water Exchange Rate and Permeability to Gadolinium-Based Contrast Agent in an Elderly Cohort. Frontiers in Neuroscience. 2020;14. doi:10.3389/fnins.2020.571480
4. Yang S, Song S, Hua Y, Nakamura T, Keep RF, Xi G. Effects of Thrombin on Neurogenesis After Intracerebral Hemorrhage. Stroke. 2008;39(7):2079-2084. doi:10.1161/strokeaha.107.508911
5. Aksoy D, Bammer R, Mlynash M, et al. Magnetic Resonance Imaging Profile of Blood–Brain Barrier Injury in Patients With Acute Intracerebral Hemorrhage. Journal of the American Heart Association. 2013;2(3). doi:10.1161/jaha.113.000161
6. Abid KA, Sobowale OA, Parkes LM, et al. Assessing Inflammation in Acute Intracerebral Hemorrhage with PK11195 PET and Dynamic Contrast-Enhanced MRI. Journal of Neuroimaging. 2017;28(2):158-161. doi:10.1111/jon.12477
7. McCourt R, Gould B, Kate M, et al. Blood-brain barrier compromise does not predict perihematoma edema growth in intracerebral hemorrhage. Stroke. 2015;46(4):954-960. doi:10.1161/STROKEAHA.114.007544
8. Walsh J, Tozer DJ, Sari H, et al. Microglial activation and blood–brain barrier permeability in cerebral small vessel disease. Brain. 2021;144(5):1361-1371. doi:10.1093/brain/awab003
9. Sargento-Freitas J, Aday S, Nunes C, et al. Endothelial progenitor cells enhance blood–brain barrier permeability in subacute stroke. Neurology. 2018;90(2):e127-e134. doi:10.1212/WNL.0000000000004801
Figures
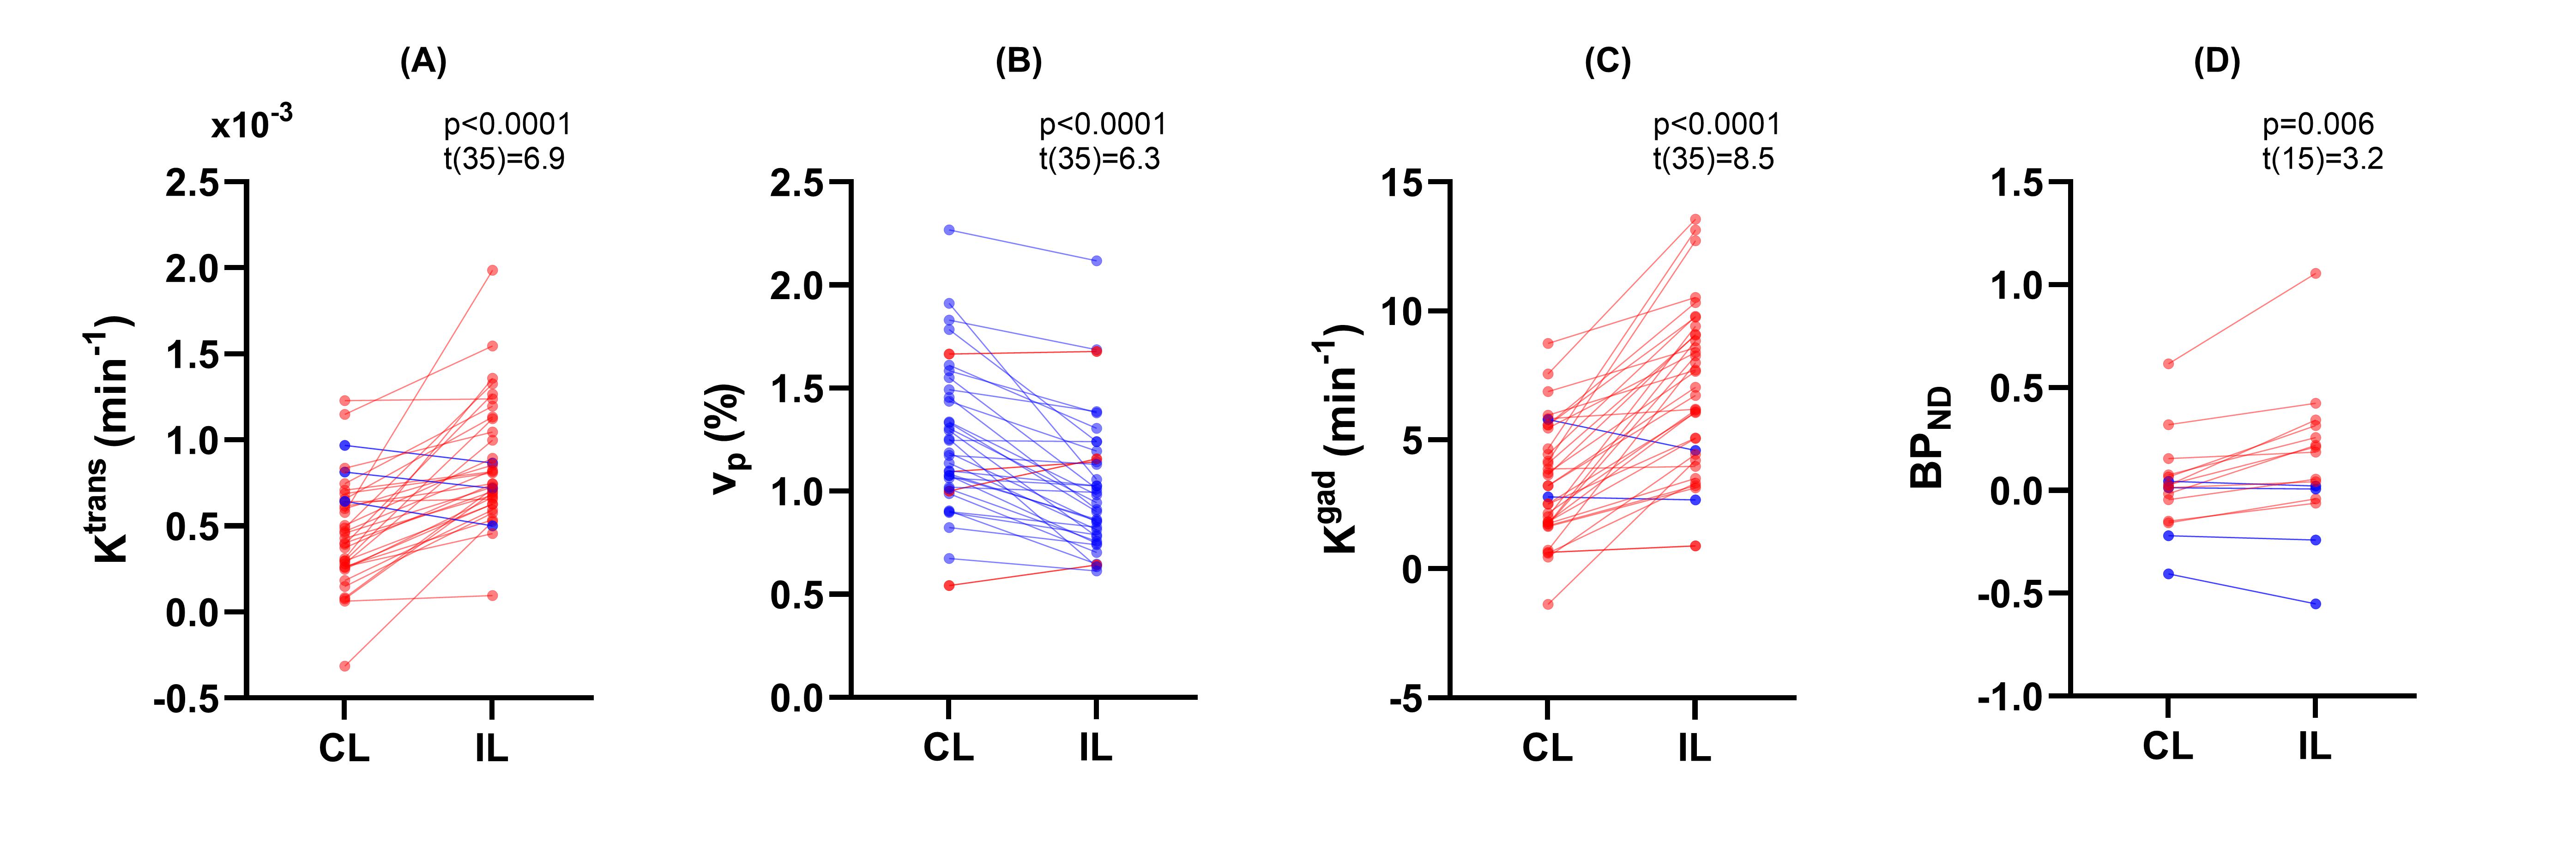
Figure 1: DCE-MRI parameters and [11C](R)-PK11195 binding potential in the perihematomal edema compared to the contralateral side. Individual values of median DCE-MRI metrics in the ipsilateral (IL) side and in normal tissue on the contralateral (CL) side are presented for (A) Ktrans, (B) vp, (C) Kgad, and (D) [11C](R)-PK11195 BPND. Red datapoints represent increased values in the IL region compared to the CL region, blue represents a decrease.
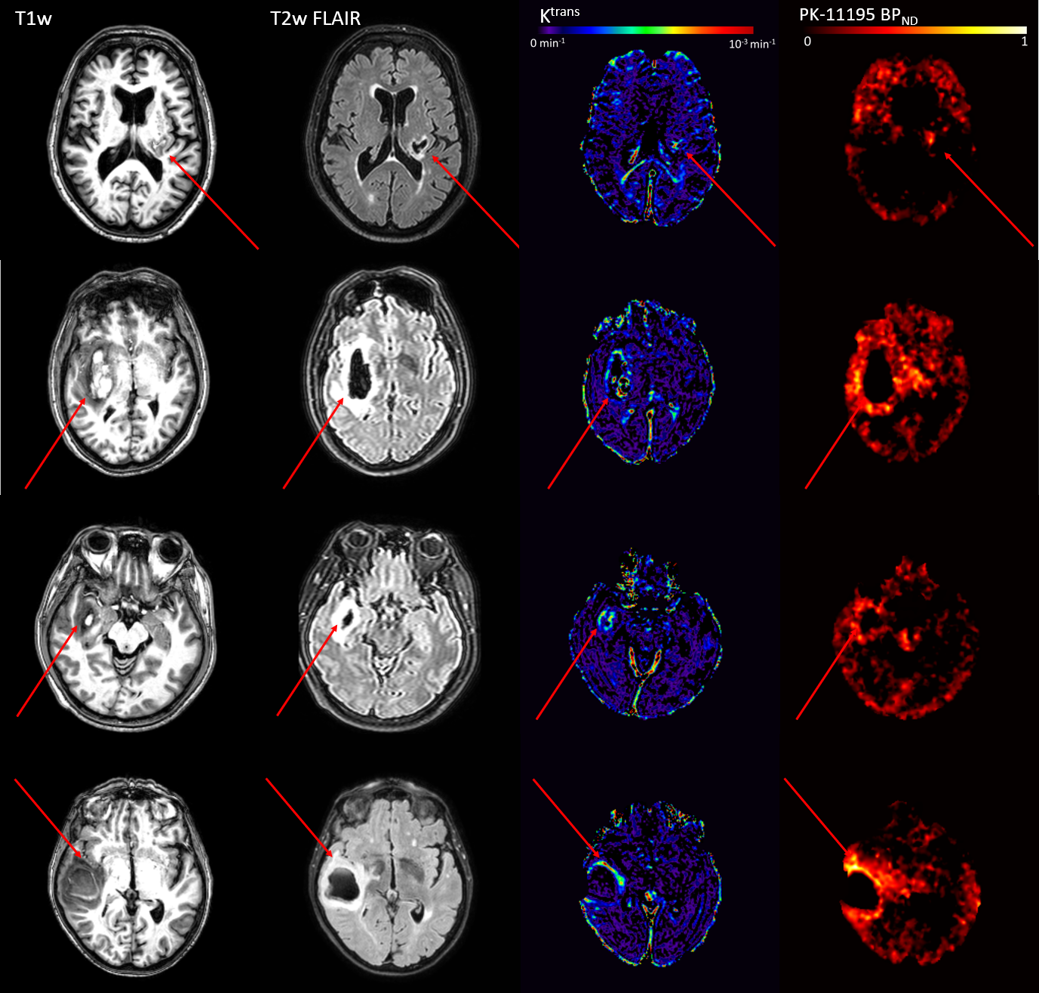
Figure 2: Patterns of neuroinflammation post-ICH. A high-resolution T1-weighted image (left), T2-weighted FLAIR (centre left), DCE-MRI Ktrans map (centre right), and [11C](R)-PK11195 PET binding potential map (right) are shown for a representative 4 (of 16) patients that underwent both [11C](R)-PK11195 PET and DCE-MRI scans 1-7 days post-ICH. Red arrows point towards the stroke region.
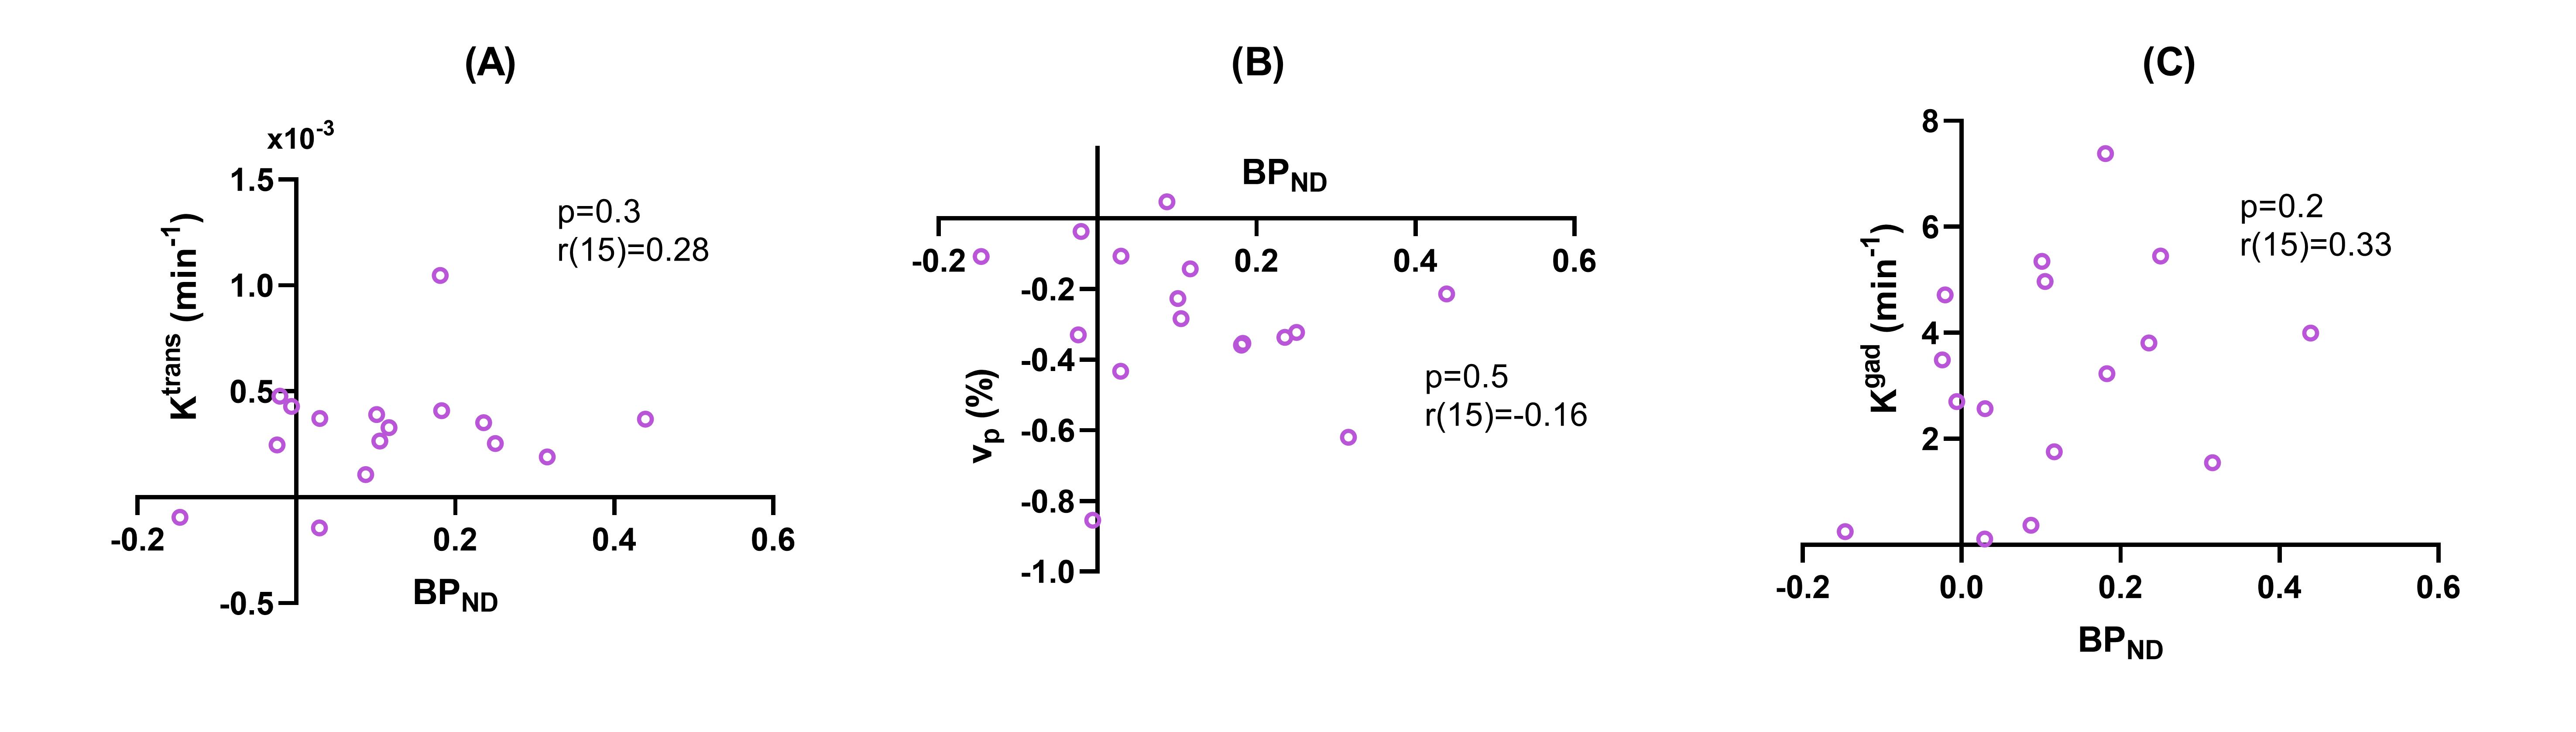
Figure 3: Difference values between the PHE and contralateral control regions plotted against [11C](R)-PK11195 binding potential (BPND) at 3 months for (A) Ktrans, (B) vp, and (C) Kgad. Correlation coefficients (r) displayed for each parameter correspond to results of the Pearson’s correlation test.
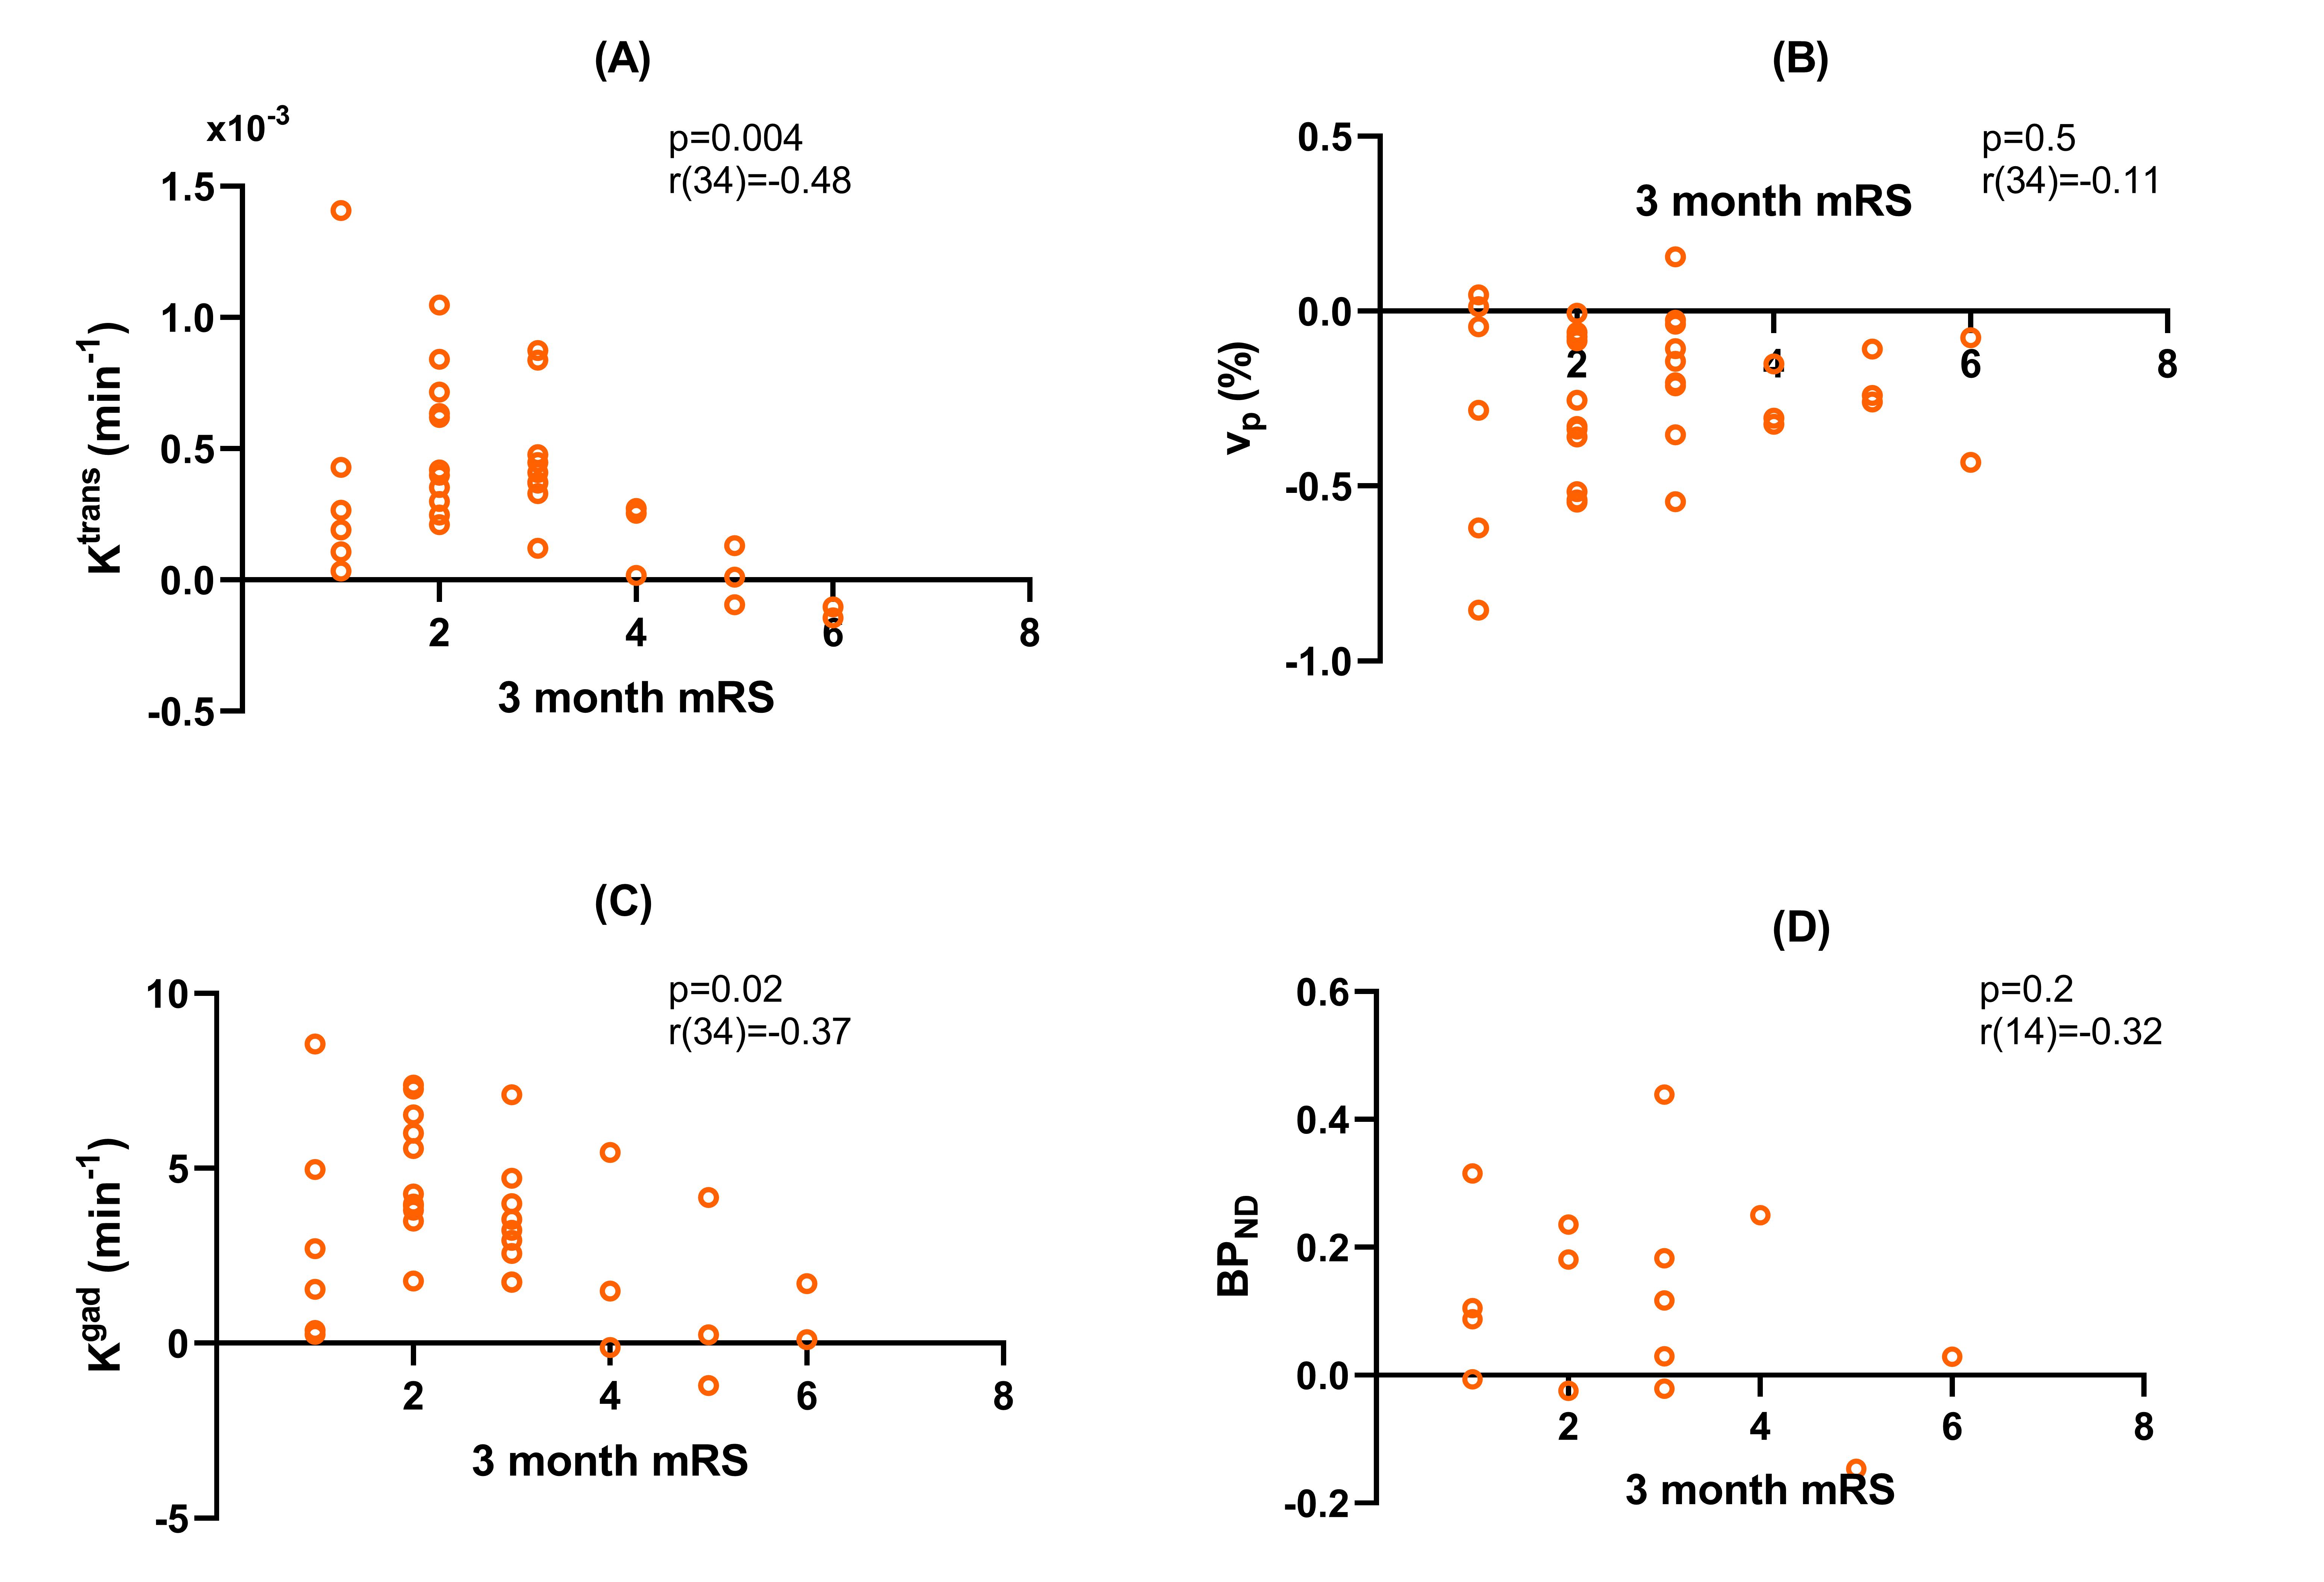
Figure 4: Difference values between the PHE and contralateral control regions plotted against the modified Rankin Scale score (mRS) at 3 months for (A) Ktrans, (B) vp, (C) Kgad, and (D) [11C](R)-PK11195 BPND. Correlation coefficients (r) displayed for each parameter correspond to results of the Pearson’s correlation test.