0034
Multimodal 9.4T MRI and Near-Infrared Spectroscopy shows reduced perfusion and abnormal oxidative metabolism in the EAE mouse model of MS1Department of Radiology, University of Calgary, Calgary, AB, Canada, 2Hotchkiss Brain Institute, University of Calgary, Calgary, AB, Canada, 3Experimental Imaging Centre, University of Calgary, Calgary, AB, Canada
Synopsis
Keywords: Multiple Sclerosis, Animals, arterial spin labeling, high field MRI
While multiple sclerosis (MS) is typically considered a white matter disease, there is prominent evidence that gray matter pathology, such as hypoxia, disruptions in metabolic rate and mitochondrial dysfunction are involved as well. We are applying a novel multimodal technique combining near-infrared spectroscopy and high-field MRI to study the mitochondrial status as well as oxygen delivery and consumption in the cortex of the EAE mouse model of MS. Reduced perfusion, and consequent hypoxia, with abnormal mitochondrial regulation and no change in consumption rate were found in EAE mice. Hypoxia and mitochondrial damage are likely to exacerbate the pathology in MS.INTRODUCTION
Inflammation and degeneration of the central nervous system (CNS) play an important role in multiple sclerosis (MS) and are associated with disease progression, physical disability, and cognitive impairment. While MS is typically considered a white matter disease, there is prominent evidence that gray matter (GM) pathology, such as GM hypoxia, disruptions in metabolic rate and mitochondrial dysfunction can be involved in MS as well1-3. It is important to understand the mechanisms underlying these disruptions, as abnormal oxidative metabolism in GM may exacerbate the pathology of MS. For this, we investigate oxidative metabolism in vivo in the EAE mouse model, which is commonly used as an inflammation induced autoimmunity mouse model of MS. We combined a 9.4T MRI with Near-Infrared Spectroscopy (NIRS) to simultaneously monitor cerebral oxygenation (StO2), cerebral blood flow (CBF), oxygen extraction fraction (OEF), and metabolic rate for oxygen consumption (CMRO2) in the cortex of the mouse model. Mitochondrial function was assessed as well by quantifying the total content and the oxidation state of the mitochondrial enzyme cytochrome c oxidase (CCO), which is responsible for the majority of oxygen consumption in the cell.METHODS
Twenty-five C57BL/6J female mice were separated into “Naïve” control (n = 8), “CFA/PTX” control (n = 9) and EAE (n = 8) groups. Naïve mice did not receive any injections. CFA/PTX mice were injected with complete Freund’s adjuvant (CFA) and pertussis toxin (PTX). EAE mice were injected with MOG35-55 peptide emulsified in CFA and PTX. Peak-disease in EAE group was estimated to be 15-18 days post induction.NIRS-MRI imaging were performed for all groups at approximately peak disease. During imaging, the mice were spontaneously ventilated with a gas mixture of 70% N2 and 30% O2 in addition to 2% isoflurane. A 9.4T MRI with a 35 mm volume coil was used to quantify CBF. A single axial slice was acquired using a CASL-HASTE sequence with the following parameters: TR/TE=3000/13.5 ms, FOV=25.6×25.6 mm, matrix size=128×128 pixels, slice thickness=1 mm, 16 averages. Four perfusion images were collected per measurement: 2 control images and 2 tagged images, to correct for magnetization transfer. Following these images, a T1 map was obtained in the same location using a RARE-VTR sequence where effective TE=20 ms, TR=100, 500, 1000, 3000, and 7500 ms. Together, the four perfusion images and the T1 map were collected over a period of 14 min. CBF was calculated on a voxel-by-voxel basis from an ROI in the cortex4.
We measured the concentration of hemoglobin and StO2 in mouse cortex, in addition to the concentration and oxidation state of CCO using a custom-built broadband NIRS device and in-house developed processing algorithms. CMRO2 was calculated based on the modified Fick principle5.
RESULTS
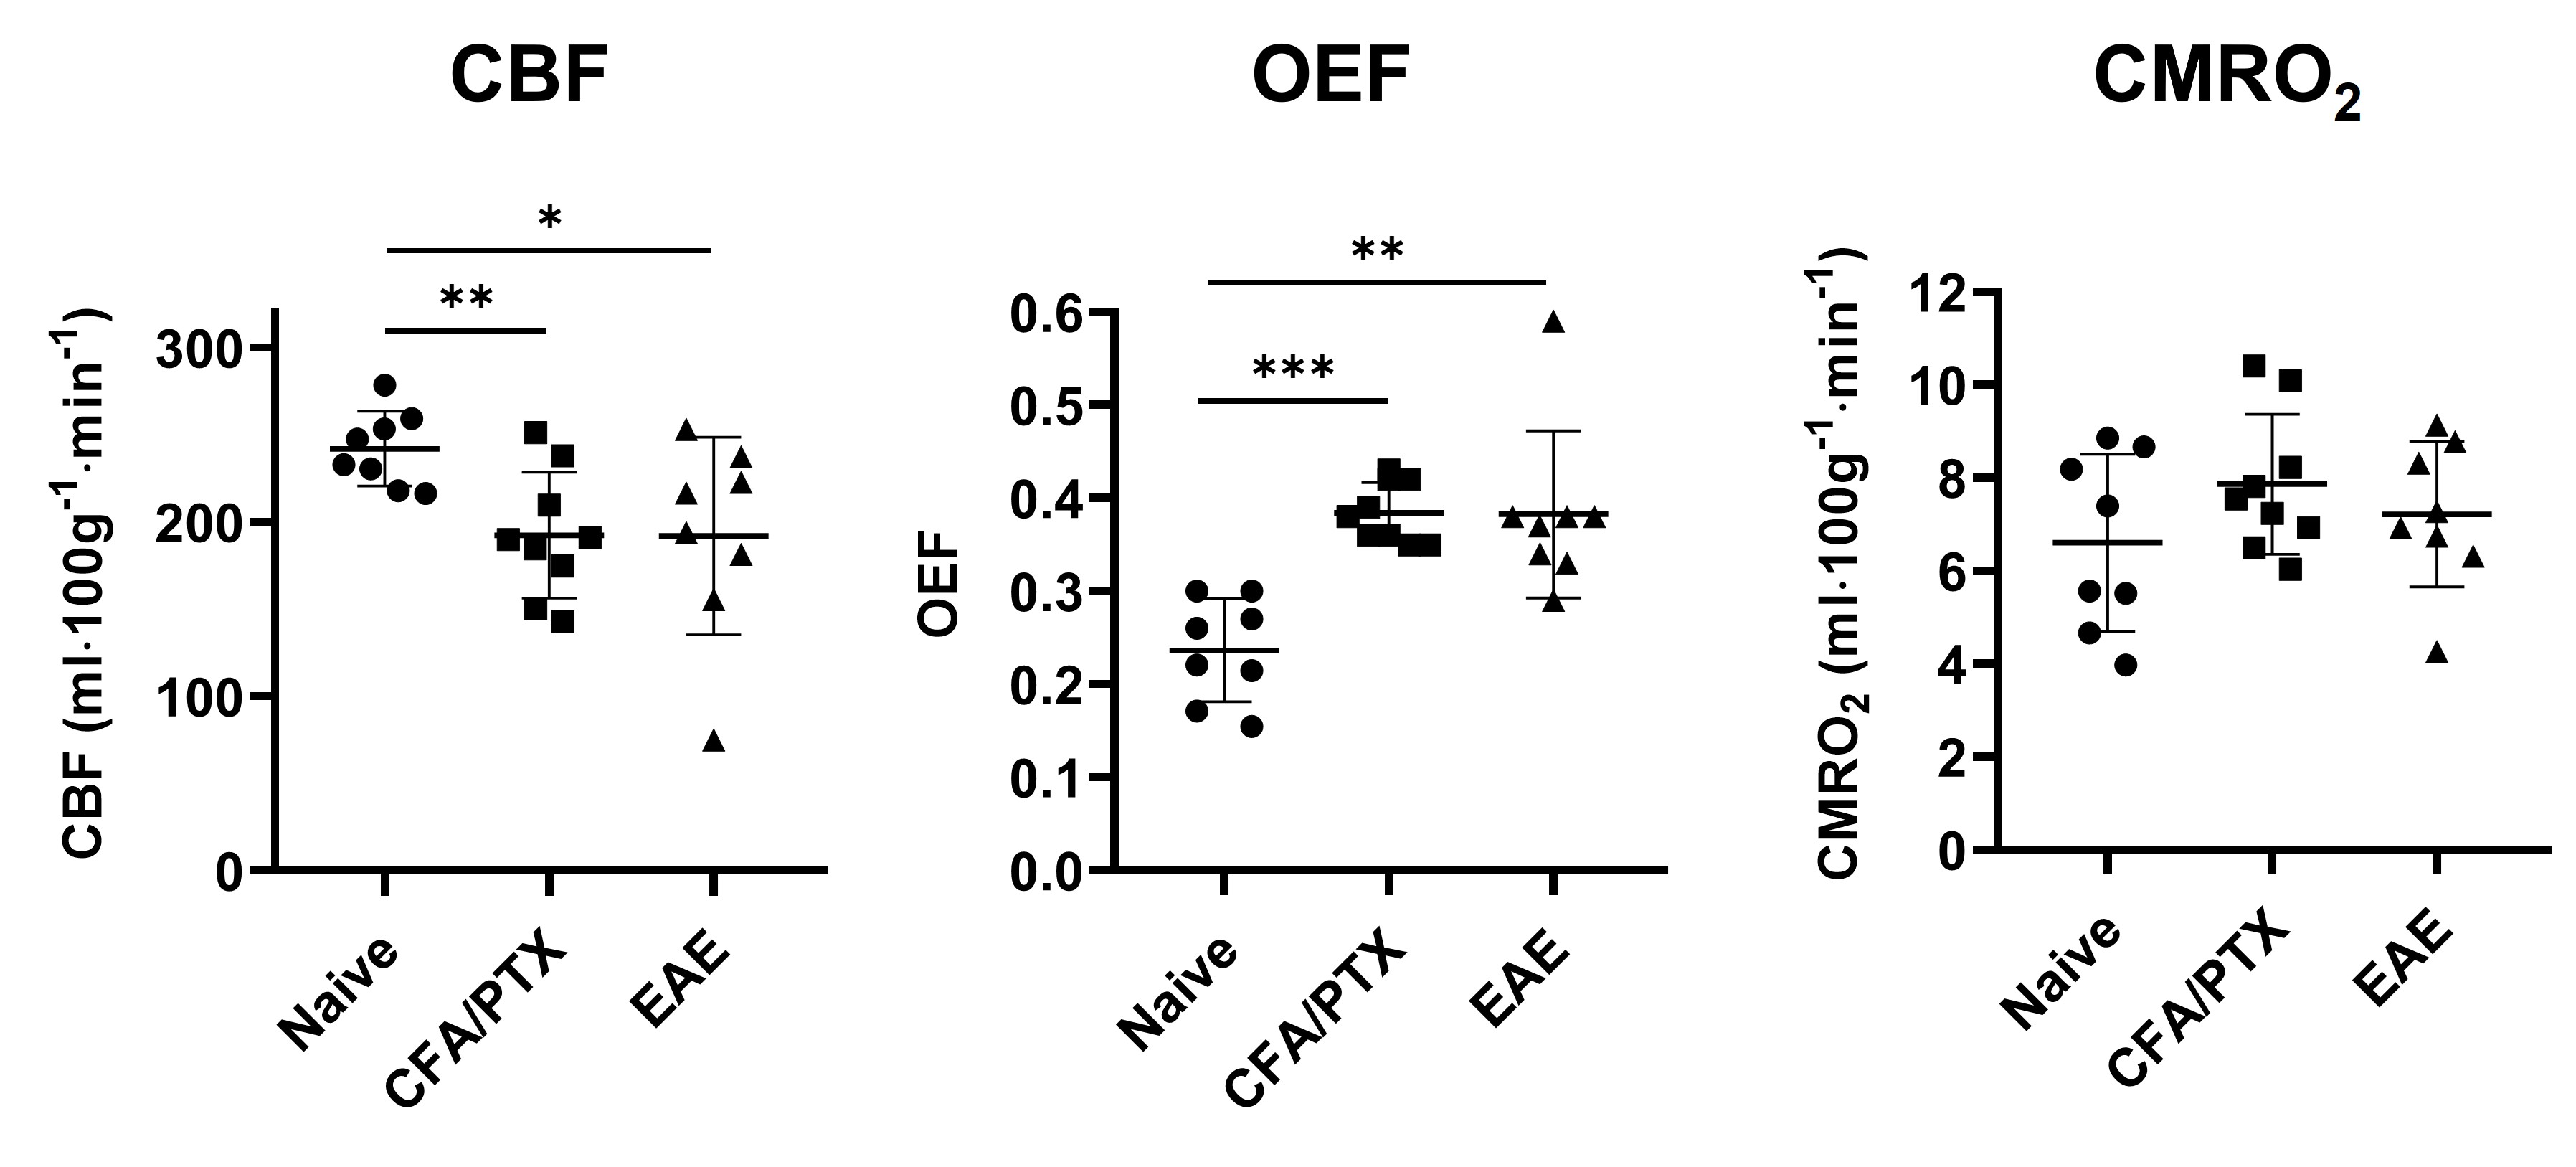
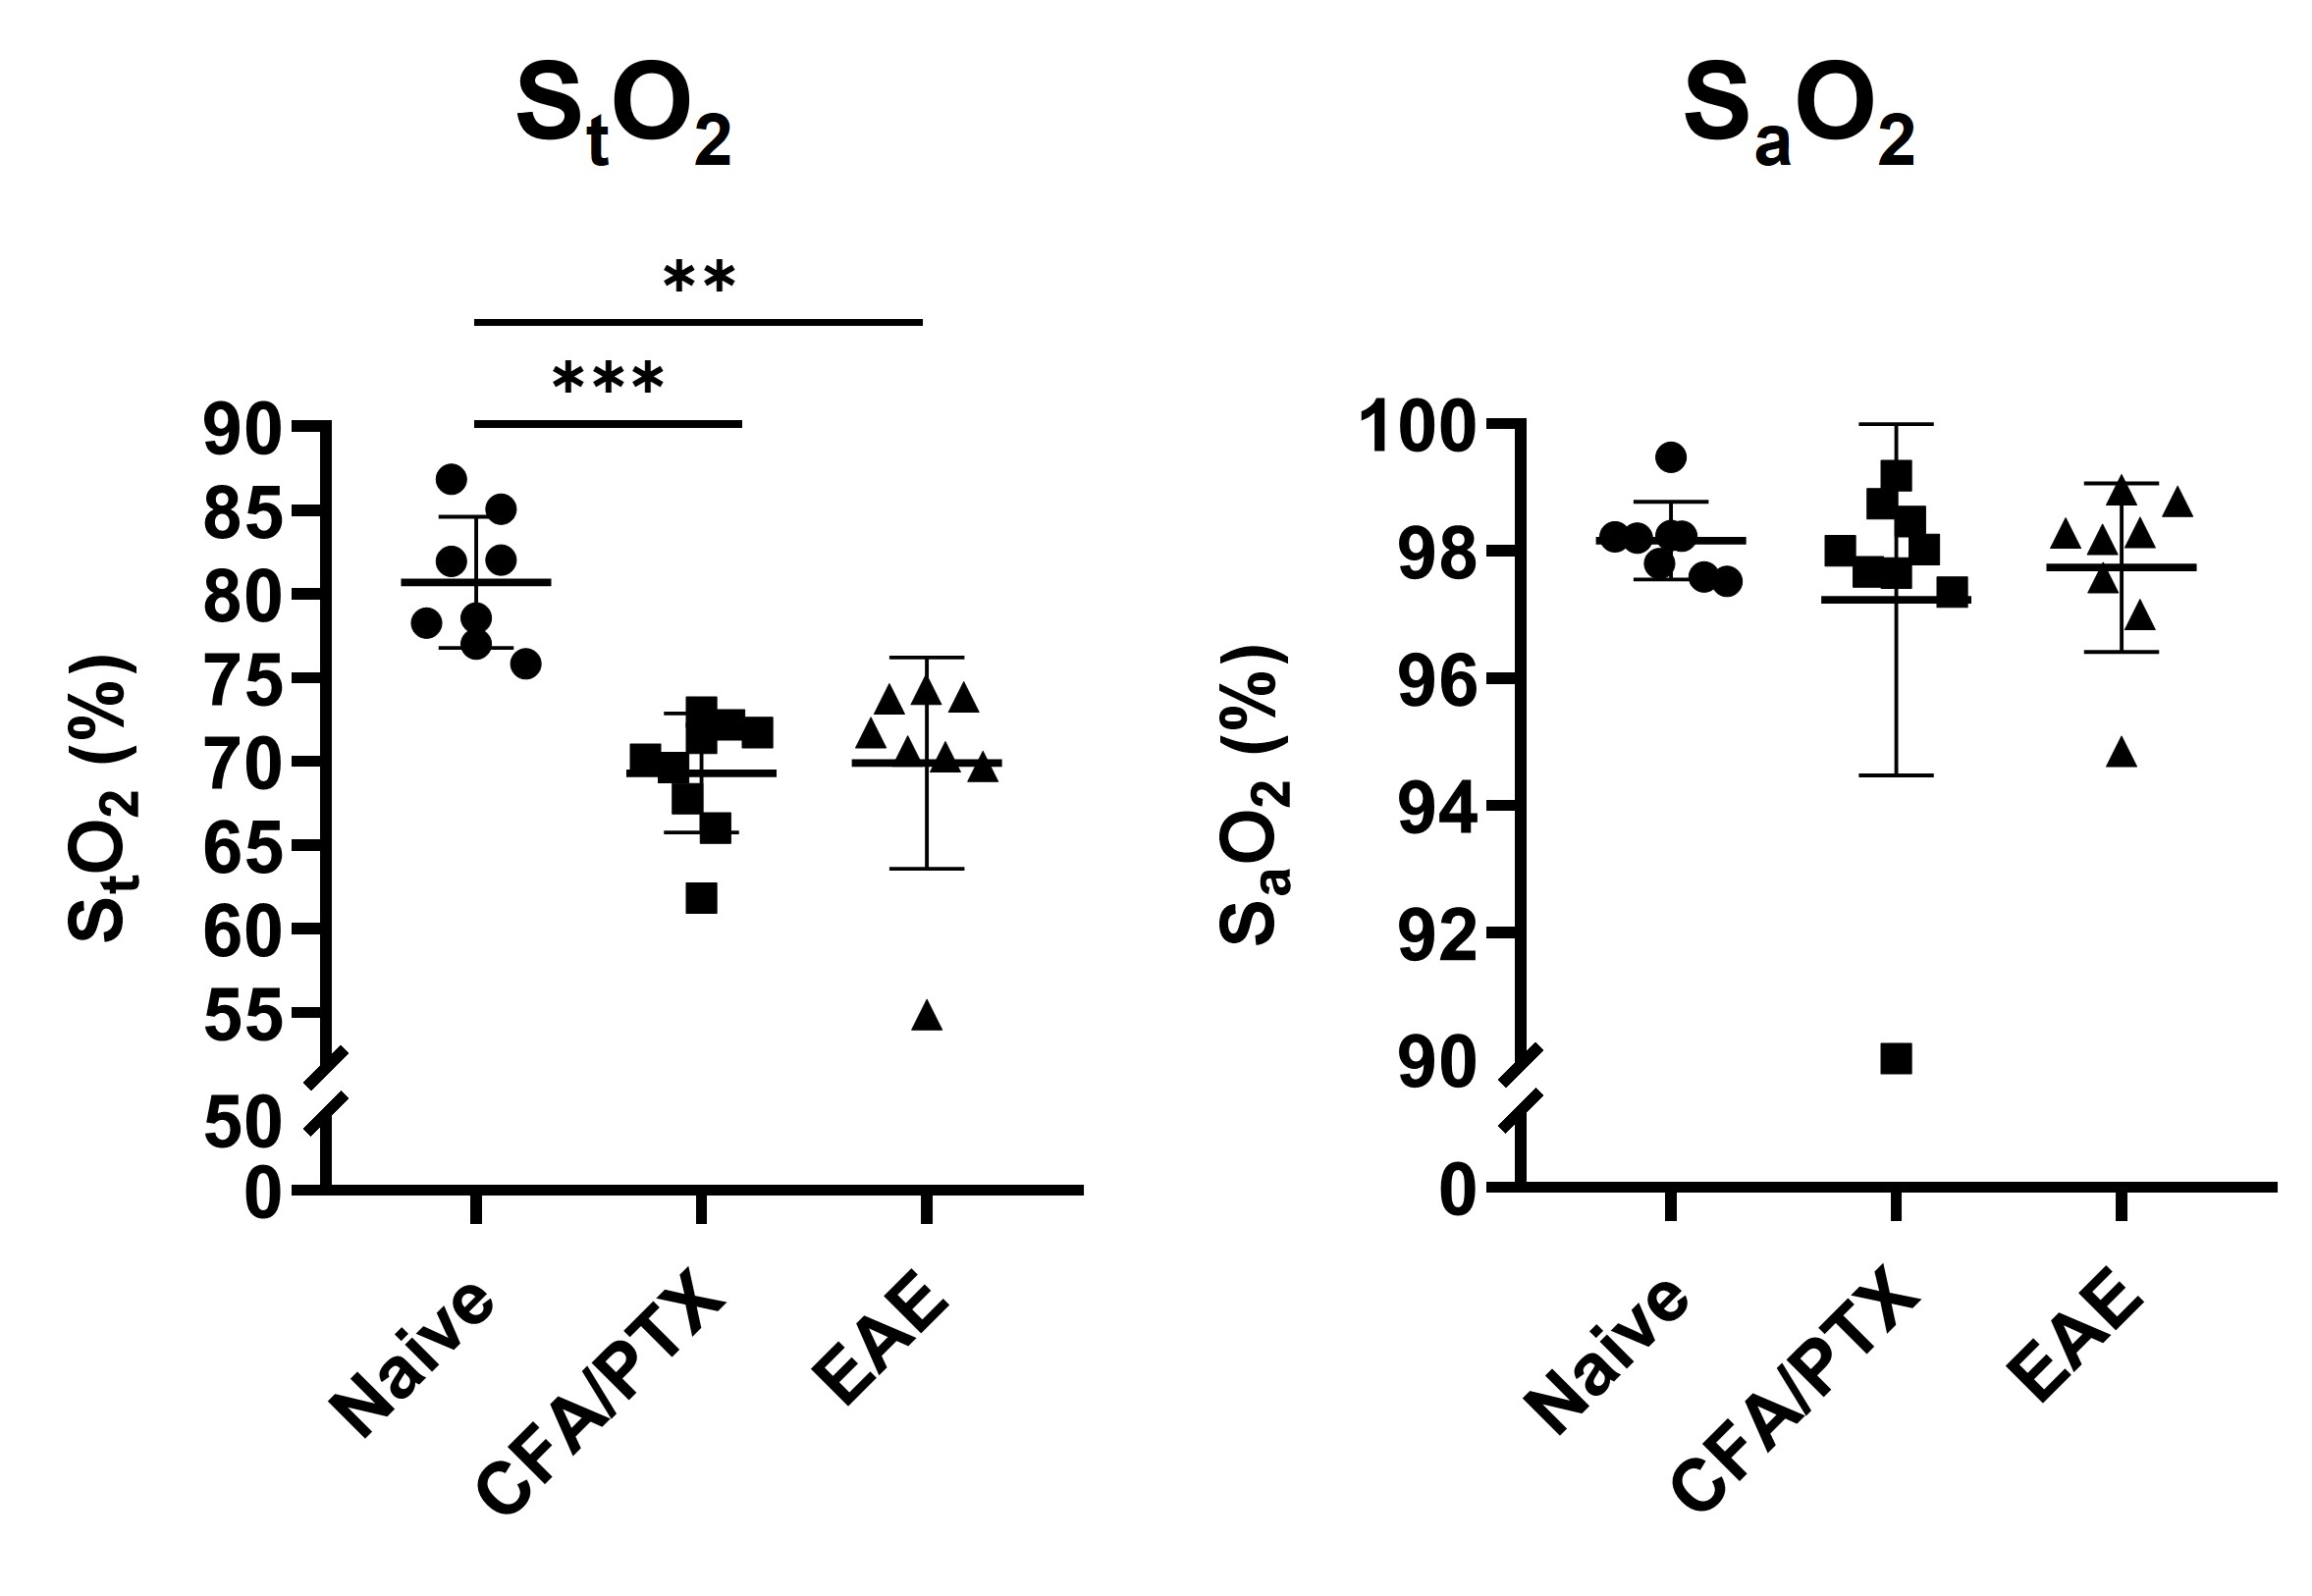
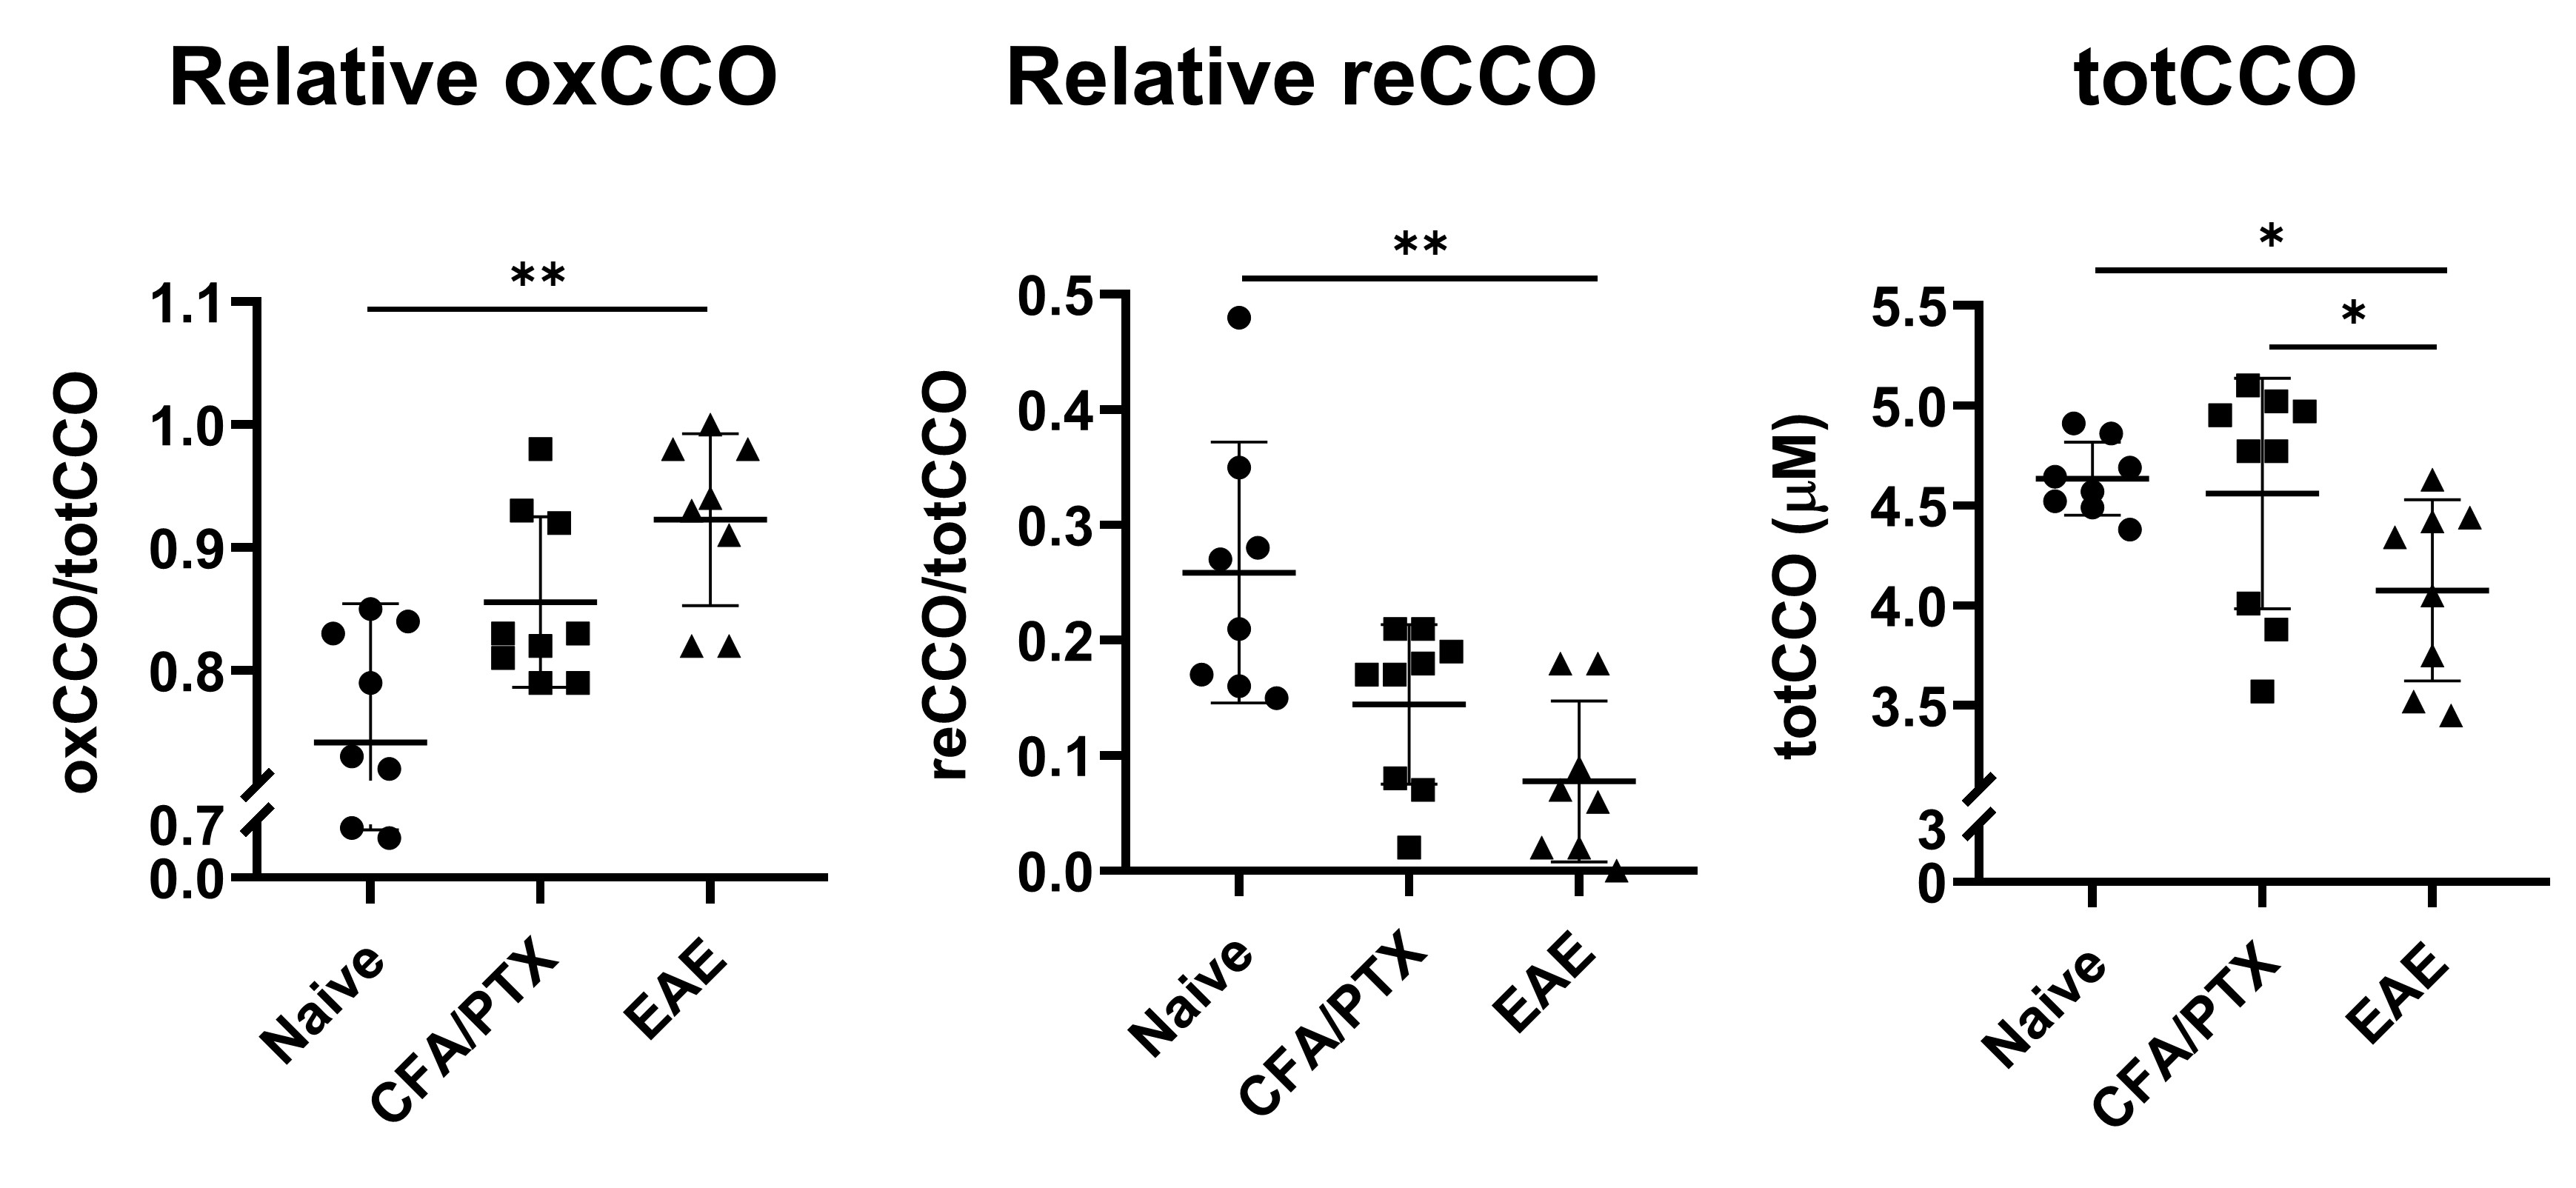
Both CFA/PTX and EAE groups showed a significant decrease in CBF (p < 0.05) and StO2 (p < 0.01), an increase in OEF (p < 0.01) and no change in CMRO2 (p = 0.5) compared to the naïve control group. There was no difference in these metrics between CFA/PTX and EAE mice. The concentration of the mitochondrial enzyme CCO was significantly lower in EAE mice compared to naïve (p = 0.03) and to CFA/PTX (p = 0.01). There was no difference between the naïve and CFA/PTX control groups (p = 0.8). The oxidation state of the enzyme increased in EAE mice, where 92% of the enzyme was oxidized and 8% reduced, compared to 74% oxidized and 26% reduced in naïve mice (p = 0.003).DISCUSSION
At peak-disease, CMRO2 did not change in EAE and CFA/PTX mice, compared to naïve controls. However, CBF, OEF and StO2, changed similarly both in EAE and CFA/PTX. This would support the idea that perfusion changes are due to the inflammatory effects on blood flow regulation, caused by the adjuvant and pertussis toxin. The fact that CMRO2 doesn’t change in the EAE indicates that oxygen flux through CCO is remaining constant even though total CCO content decreased. It is possible that increased CCO oxidation state is an adaptation to maintain metabolic rate when mitochondria are damaged. These data support the conclusion that oxidative metabolism is impaired in the EAE but changes in mitochondrial regulation allowed for maintained CMRO2.CONCLUSION
We were able to detect significant metabolic alterations in the EAE mouse model of MS using novel NIRS-MRI multimodality system. We suggest that reduced perfusion (reduced oxygen supply) is caused by inflammation. Reduced oxygen supply with no change in the metabolic rate for oxygen consumption could lead to severe hypoxia. In addition, there appears to be abnormal mitochondrial regulation. Hypoxia and mitochondrial damage are likely to exacerbate the pathology in MS. The novel multimodal imaging technique applied here shows promise for noninvasively assessing parameters associated with oxidative metabolism in both mouse models of neurological disease and for translation to study oxidative metabolism in human brain.Acknowledgements
This work was supported by an NIH R21 grant, Canada Foundation for Innovation (CFI), Natural Sciences and Engineering Research Council (NSERC), and Discovery grant.References
1. Haider L, Simeonidou C, Steinberger G, et al. Multiple sclerosis deep grey matter: the relation between demyelination, neurodegeneration, inflammation and iron. Journal of Neurology, Neurosurgery & Psychiatry 2014; 85: 1386-1395.
2. Davies AL, Desai RA, Bloomfield PS, et al. Neurological deficits caused by tissue hypoxia in neuroinflammatory disease. Annals of neurology 2013; 74: 815-825.
3. Yang R and Dunn JF. Multiple sclerosis disease progression: contributions from a hypoxia–inflammation cycle. Multiple Sclerosis Journal 2019; 25: 1715-1718.
4. Buxton RB. Quantifying CBF with arterial spin labeling. Journal of magnetic resonance imaging : JMRI 2005; 22: 723-726. 2005/11/02. DOI: 10.1002/jmri.20462.
5. Tichauer KM, Hadway JA, Lee T-Y, et al. Measurement of Cerebral Oxidative Metabolism with Near-Infrared Spectroscopy: A Validation Study. Journal of Cerebral Blood Flow & Metabolism 2006; 26: 722-730. DOI: 10.1038/sj.jcbfm.9600230.
Figures