0031
Iron accumulation and MRI iron contrast are not driven by amyloid plaques in posterior cortical atrophy1Neurophysics, Max Planck Institute for Human Cognitive and Brain Sciences, Leipzig, Germany, 2Paul Flechsig Institute - Center of Neuropathology and Brain Research, Leipzig, Germany, 3Faculty of Physics and Earth Sciences, Leipzig University, Leipzig, Germany, 4Medical Physics Group, Institute of Diagnostic and Interventional Radiology, Jena University Hospital, Jena, Germany, 5PETRA III, Deutsches Elektronen-Synchrotron DESY, Hamburg, Germany
Synopsis
Keywords: Alzheimer's Disease, Contrast Mechanisms, iron, plaques, posterior cortical atrophy, cortex
We combined ultra-high resolution quantitative MRI, X-ray fluorescence, and biophysical modeling to study iron-induced MRI contrast in the visual cortex of patients with Alzheimer’s disease (AD) and its variant posterior cortical atrophy (PCA). The iron content of amyloid plaques in patients with PCA and AD exceeded the iron concentration in the surrounding tissue by less than 15%, constituting only a minor contribution to the intracortical T2* contrast. The elevated levels of brain iron detected by iron-sensitive MRI contrasts are not indicative of plaques but may reflect other processes, such as inflammation or leakage in the blood-brain barrier.Introduction
Dysregulation and abnormal iron accumulation in the brain are hallmarks of Alzheimer’s disease (AD)1 and its rare variant, posterior cortical atrophy (PCA)2. Post mortem histological studies and in vivo iron-sensitive MRI (R2* and QSM) consistently report elevated levels of cortical iron in AD and PCA. However, the mechanism of abnormal iron accumulation, iron’s role in pathogenesis, and the diagnostic utility of iron-sensitive biomarkers in both diseases remain a matter of debate. Early studies observed iron accumulation in the amyloid (Aß) plaques in AD mouse models, suggesting that iron-sensitive MRI contrasts may be used for plaque quantification3–5. T2*w MRI microscopy on patient tissue revealed dot-like hypointensities that were interpreted as iron-rich Aß-plaques6,7. However, more recent work pointed towards microglia as the iron-richest cellular compartment in the cortex of AD patients1. Moreover, in vivo studies have proposed a breakdown of the blood-brain barrier as a potential cause of elevated iron levels in AD8. So far, the cellular underpinning of altered MRI contrasts in AD and PCA remains unknown. This is mainly due to the lack of quantitative knowledge about the cellular iron distribution in these pathologies and the challenge of bridging the gap between histological microscopic findings and in vivo MRI parameters measured with macroscopic resolution. We quantified the microscopic iron distribution and the impact of plaques on MRI contrast in the primary visual cortex of post mortem tissue from PCA and AD donors using X-Ray Fluorescence (XRF) imaging, MRI microscopy, and biophysical modeling. We show that the average iron content of amyloid plaques is similar to that of the surrounding tissue and causes only a negligible elevation of R2*. We detected submillimeter-sized patches with high iron levels, which were not co-localized with Aß-plaques, potentially pointing towards activated astroglia or blood-brain barrier leakage. Thus, iron-sensitive MRI contrast in the cortex of PCA and AD patients is not driven by the plaque density.Methods
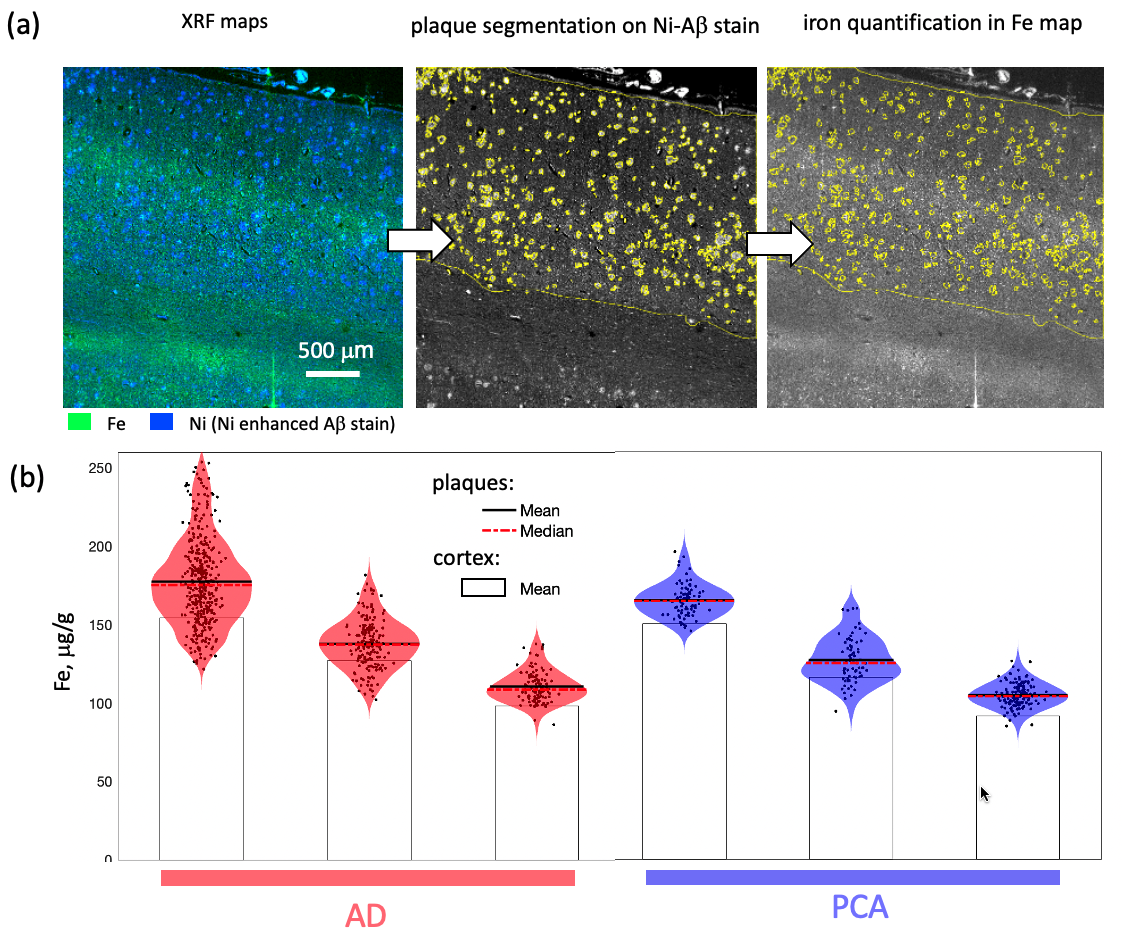
Formalin-fixed tissue samples from three donors with PCA (f 66y, m 71y, m 71y) were provided by the Queen Square Brain Bank, UCL London. Tissue samples from three donors with AD (Braak V–VI; f 77y, f 92y, m 81y) and a non-neurodegenerative control (f 64y) were provided by the Brain Banking Centre Leipzig, Leipzig University. All samples included primary and secondary visual cortices, particularly affected in PCA. T2*-weighted imaging (T2*w) MRI microscopy was performed using a 3D multi-echo gradient echo sequence with an isotropic resolution of 22 µm on a 9.4 T Bruker BioSpec scanner (TE 19 ms, TR 200 ms, flip angle (FA) 50°) and with 50 μm isotropic resolution on a 7 T Siemens Magnetom scanner (TE 19 ms, TR 200 ms, FA=50°). Quantitative R2* maps were acquired at 7 T as a part of a multi-parameter mapping (MPM) acquisition9 (equispaced echoes TE1-12=4–41 ms, TR=95 ms, FA=12°,60°). For histology and XRF, the tissue blocks were paraffin-embedded and cut into 8 μm thick sections. The sections were deparaffinized and immunohistochemically stained for Aβ plaques with Ni-enhanced DAB reaction. These and consecutive unstained sections were embedded in a thin layer of DePeX to enable XRF-mapping. Quantitative maps of iron and nickel with in-plane resolutions of 5 μm and 2 μm were obtained using the microprobe beamline P06 of PETRA III at the Deutsche Elektronen Synchrotron (DESY). Additionally, consecutive sections were double stained for iron (DAB-enhanced Perls’s stain) and Aβ deposits as described above and imaged with optical microscopy.The segmentation of amyloid plaques was performed on nickel maps using a robust automatic threshold selection method implemented in Fiji software. The obtained plaque segmentations were used to determine the iron concentrations within individual plaques and to obtain the plaque volume fraction within the cortex. The upper limit for the contribution of iron in plaques to R2* was estimated using static dephasing theory10.Results
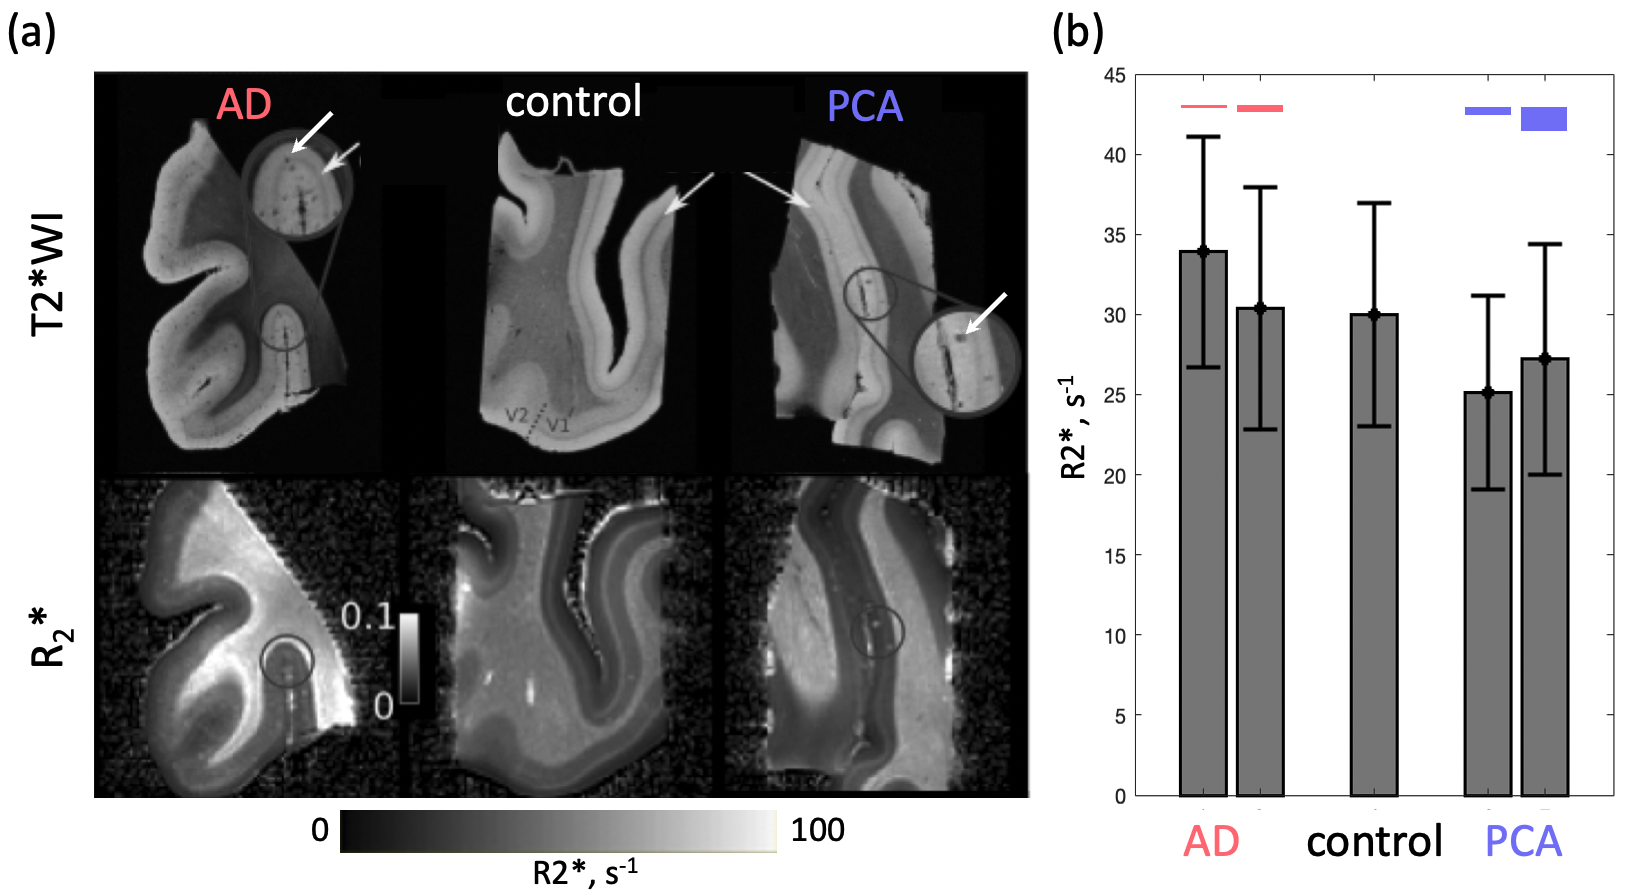
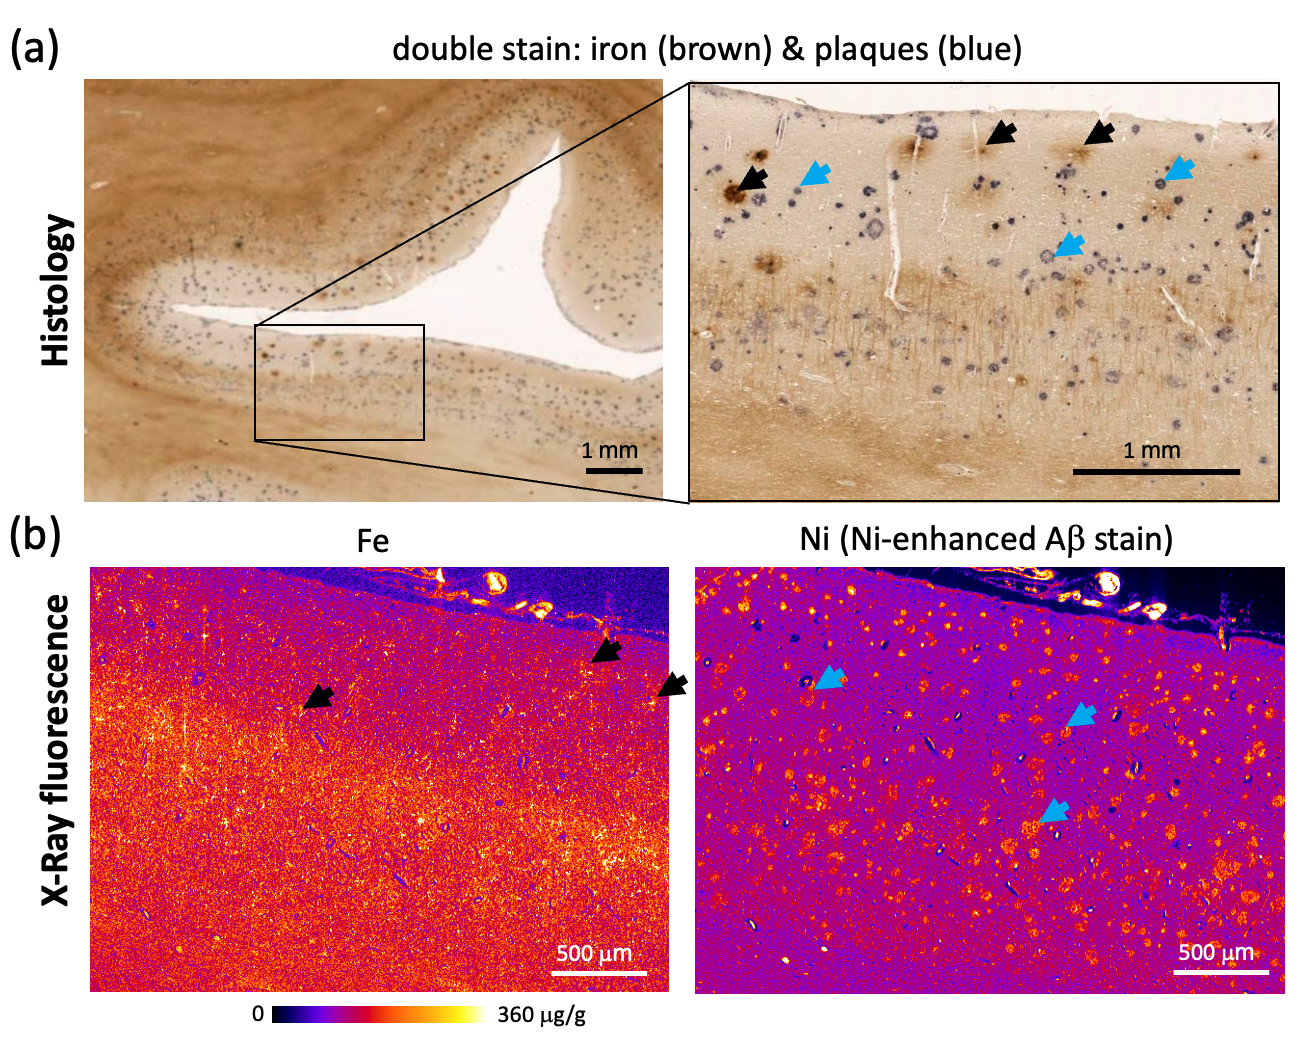
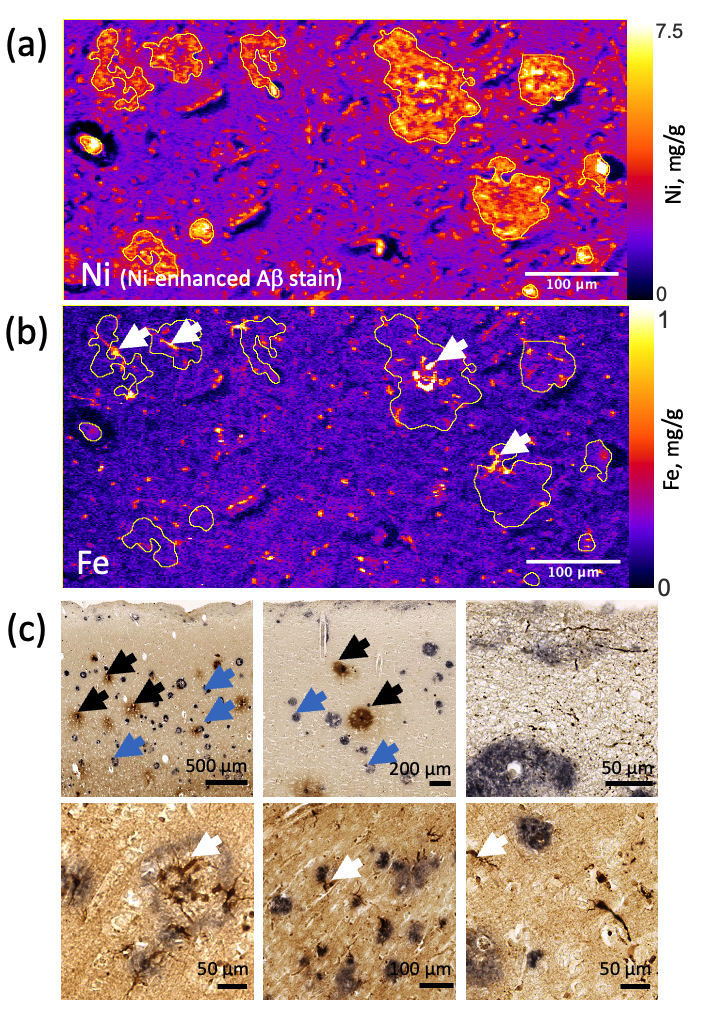
Dot-like hypointensities on ultra-high resolution T2*WI and co-localized increased R2* rates were observed in all AD and PCA tissue samples (Fig.1). Hotspots of elevated iron concentrations were detected in quantitative iron maps. Still, their locations did not match the locations of amyloid plaques (Fig.2,3) both in microscopic double-stained images (Fig.2a,3c) and in quantitative XRF maps (Fig.2b, Fig.3a,b). Small iron-rich inclusions were detected in some plaques, which probably correspond to microglia, indicated by their shapes. The plaques occupied between 1 % and 8 % of the cortex and contained between 1.1 to 9.1 % of cortical iron. The iron concentrations in the plaques were close to the iron concentration in the surrounding tissue (Fig.4) and exceeded it by only 9 to 15 %. The estimated contribution of plaque-iron to the R2* varied between 0.4 and 1.5 s-1 and was therefore well below the intracortical and between-subject variation of R2* contrast (Fig.1).Discussion and Conclusions
We demonstrated that the iron content of amyloid plaques in PCA and AD tissue samples exceeds the iron concentration in the surrounding tissue by less than 15 %. It constituted only a minor contribution to the intracortical T2* contrast. The elevated levels of brain iron in these diseases visible with iron-sensitive MRI contrasts are not indicative of plaques, but reflect other processes such as inflammation or brain-blood barrier leakage.Acknowledgements
We thank the Queens Square Brain Bank, UCL London, and the Brain Banking Centre Leipzig of the German Brain-Net, operated by the Paul Flechsig Institute - Center of Neuropathology and Brain Research, Medical Faculty, University of Leipzig, Department of Neuropathology, University Hospital Leipzig, for providing post mortem tissue samples for this study. The research leading to these results has received funding from the European Research Council under the European Union's Seventh Framework Program (FP7/2007-2013) / ERC grant agreement n° 616905 and funding from the European Union's Horizon 2020 research and innovation programme under grant agreement No 681094. It was supported by the Swiss State Secretariat for Education, Research and Innovation (SERI) under contract number 15.0137. This project has also received funding from the BMBF (01EW1711A & B) in the framework of ERA-NET NEURON. The research leading to these results has received funding from the DFG, PP 2041 Computational Connectomics (KI 1337/2-2 and WE 5046/4-2). M. Brammerloh has received funding from the International Max Planck Research School on Neuroscience of Communication: Function, Structure, and Plasticity. We acknowledge DESY (Hamburg, Germany), a member of the Helmholtz Association HGF, for the provision of experimental facilities. Parts of this research were carried out at PETRA III using the microprobe at beamline P06. Beamtime was allocated for proposal I-20211534.References
1. Tran, D., DiGiacomo, P., Born, D. E., Georgiadis, M. & Zeineh, M. Iron and Alzheimer’s Disease: From Pathology to Imaging. Frontiers in Human Neuroscience 16, (2022).
2. Singh, N. A. et al. Distinct brain iron profiles associated with logopenic progressive aphasia and posterior cortical atrophy. Neuroimage Clin 36, 103161 (2022).
3. James, S. A. et al. Iron, Copper, and Zinc Concentration in Aβ Plaques in the APP/PS1 Mouse Model of Alzheimer’s Disease Correlates with Metal Levels in the Surrounding Neuropil. ACS Chem. Neurosci. 8, 629–637 (2017).
4. van Duijn, S. et al. Cortical Iron Reflects Severity of Alzheimer’s Disease. Journal of Alzheimer’s Disease 60, 1533–1545 (2017).
5. Bulk, M. et al. Quantitative comparison of different iron forms in the temporal cortex of Alzheimer patients and control subjects. Sci Rep 8, 6898 (2018).
6. Meadowcroft, M., Connor, J. & Yang, Q. Cortical iron regulation and inflammatory response in Alzheimer’s disease and APPSWE/PS1ΔE9 mice: a histological perspective. Frontiers in Neuroscience 9, (2015).
7. Meadowcroft, M. D., Connor, J. R., Smith, M. B. & Yang, Q. X. MRI and histological analysis of beta-amyloid plaques in both human Alzheimer’s disease and APP/PS1 transgenic mice. Journal of Magnetic Resonance Imaging 29, 997–1007 (2009).
8. van de Haar, H. J. et al. Blood-Brain Barrier Leakage in Patients with Early Alzheimer Disease. Radiology 281, 527–535 (2016).
9. Weiskopf, N. et al. Quantitative multi-parameter mapping of R1, PD(*), MT, and R2(*) at 3T: a multi-center validation. Front Neurosci 7, 95 (2013).
10. Yablonskiy, D. A. & Haacke, E. M. Theory of NMR signal behavior in magnetically inhomogeneous tissues: the static dephasing regime. Magn Reson Med 32, 749–763 (1994).
11. Edwards, L., Jäger, C., Kirilina, E., Herrmann, K.-H., Pine, K., Scheibe, P., et al..Exploring quantitative MRI contrast in posterior cortical atrophy using ex vivo imaging. In Proceedings of the 27th Annual Meeting of the Organization for Human Brain Mapping (OHBM) 1489-1489 (2021).
Figures