0030
Quantifying Cervical Spinal Cord Pathology of Multiple Sclerosis Patients Using Advanced MRI1Translational Imaging in Neurology (ThINk) Basel, Department of Biomedical Engineering, University Hospital Basel and University of Basel, Basel, Switzerland, 2Research Center for Clinical Neuroimmunology and Neuroscience Basel (RC2NB), University Hospital Basel and University of Basel, Basel, Switzerland, 3Neurologic Clinic and Policlinic, Departments of Head, Spine and Neuromedicine, University Hospital Basel, Basel, Switzerland, 4Translational Neuroradiology Section, National Institute of Neurological Disorders and Stroke, National Institutes of Health (NIH), Bethesda, MD, United States, 5Division of Radiological Physics,Department of Radiology, University Hospital Basel, Basel, Switzerland, 6Functional Neuroimaging Unit, CRIUGM, Université de Montréal, Montreal, QC, Canada, 7NeuroPoly Lab, Institute of Biomedical Engineering, Polytechnique Montreal, Montreal, QC, Canada, 8Mila, Quebec AI Institute, Montreal, QC, Canada
Synopsis
Keywords: Multiple Sclerosis, Spinal Cord
The utility of advanced quantitative MRI for assessment of spinal cord tissue damage in multiple sclerosis has not yet been established. In this work, we used T1-mapping as well as quantitative magnetization transfer saturation and echo-planar imaging to quantify the extent of pathologic changes in the cervical cord of multiple sclerosis patients. Our results point to extensive demyelination and axonal loss both in the normal-appearing and lesional cervical cord, as well as to and chronic inflammation of cSCWM lesions in secondary progressive multiple sclerosis. Hence, quantitative spinal cord MRI may provide valuable information about the pathologic substrate of this disease.
Introduction
Multiple sclerosis (MS) is the most common chronic inflammatory, demyelinating, and neurodegenerative disease of the central nervous system (CNS), affecting both the brain and the spinal cord (SC).1,2 Previous studies have shown that advanced quantitative MRI techniques may be a useful tool in clinical practice by providing reliable assessments of focal and diffuse brain pathology of patients with MS.3–5 Despite the severe impact of this disease on the SC,6,7 the utility of these imaging methods for assessment of SC tissue damage has not yet been established. We aimed to investigate the potential of advanced MRI techniques to highlight different pathologic aspects of MS in the cervical SC (cSC).Methods
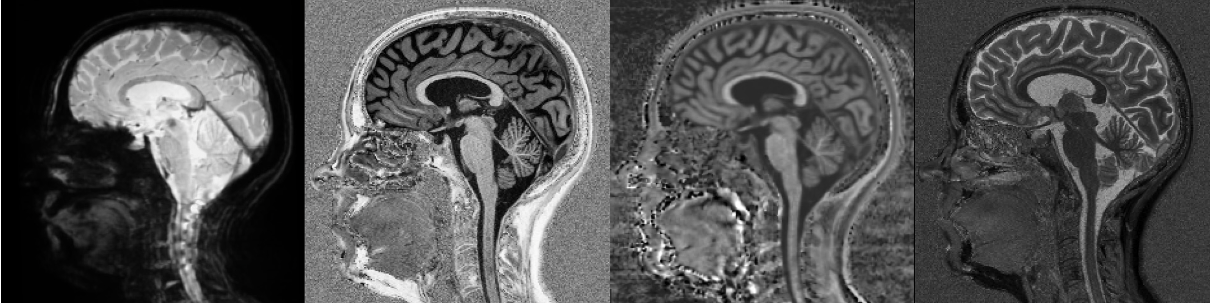
102 healthy controls (mean age: 37.4±13.0 years; 56 female) and 177 MS patients (mean age: 46.5±14.3 years; 107 female; 99 relapsing-remitting (RR), 55 secondary progressive (SP), 23 primary progressive (PP); median expanded disability status scale (EDSS): 3.0) enrolled in our study and received MRI and clinical assessments. MRI was performed on a 3T whole-body MR-system (Magnetom Prisma, Siemens Healthcare) using a 64-channel phased-array head and neck coil for radio frequency reception. The MRI protocols included: (i) a magnetization-prepared 2 rapid gradient-echo (MP2RAGE) sequence (TR/TI 1/TI 2 = 5000/700/2500 ms, acquisition time 8:20 min) with 1 mm3 isotropic spatial resolution, which provided quantitative T1 mapping; (ii) 3D RF spoiled gradient echo acquisitions with predominantly Magnetization Transfer-weighted (MTw: TR/α = 25 ms/5°), proton density-weighted (PDw: TR/α = 25 ms/5°) and T1-weighted (T1w: TR/α = 11 ms/15°) contrast with a 1.33 mm3 isotropic spatial resolution (total acquisition time 9:45 min)8–11 were used to estimate Magnetization Transfer saturation map (MTsat) using the hMRI-Toolbox (https://github.com/hMRI-group/hMRI-toolbox[LMG1] );12 and (iii) 3D segmented echo-planar imaging (EPI) with submillimeter isotropic resolution (TR/TE/resolution = 64 ms/35 ms/0.67x0.67x0.67 mm3),13 providing both T2* magnitude and phase contrast (Figure 1). Besides the brain, these MRI acquisitions also covered the upper cSC caudally extending to the C5 vertebral level. All imaging modalities were rigidly registered to MP2RAGE using ANTs.14 MS lesions and the cSC were automatically segmented using the Spinal Cord Toolbox (SCT)15 and manually corrected by an expert rater if required. The cSC gray and white matter (cSCGM; cSCWM) segmentations were obtained using the SCT atlas.16 Subsequently, the normal-appearing, and lesional cSCWM and cSCGM were calculated and were used as volumes of interest to extract mean T1-relaxation times (T1-RT), MTsat values, and EPI intensities. Between group comparisons were performed using analysis of covariance after adjusting for age and sex and post hoc analysis was conducted using Tukey’s p-value adjustment method. Correlations of cSCWM measurements with the EDSS (cSCGM metrics were excluded to avoid collinearity) were investigated using hierarchical multiple linear regression models using the p-value criterion after adjusting for age, sex and disease type.Results
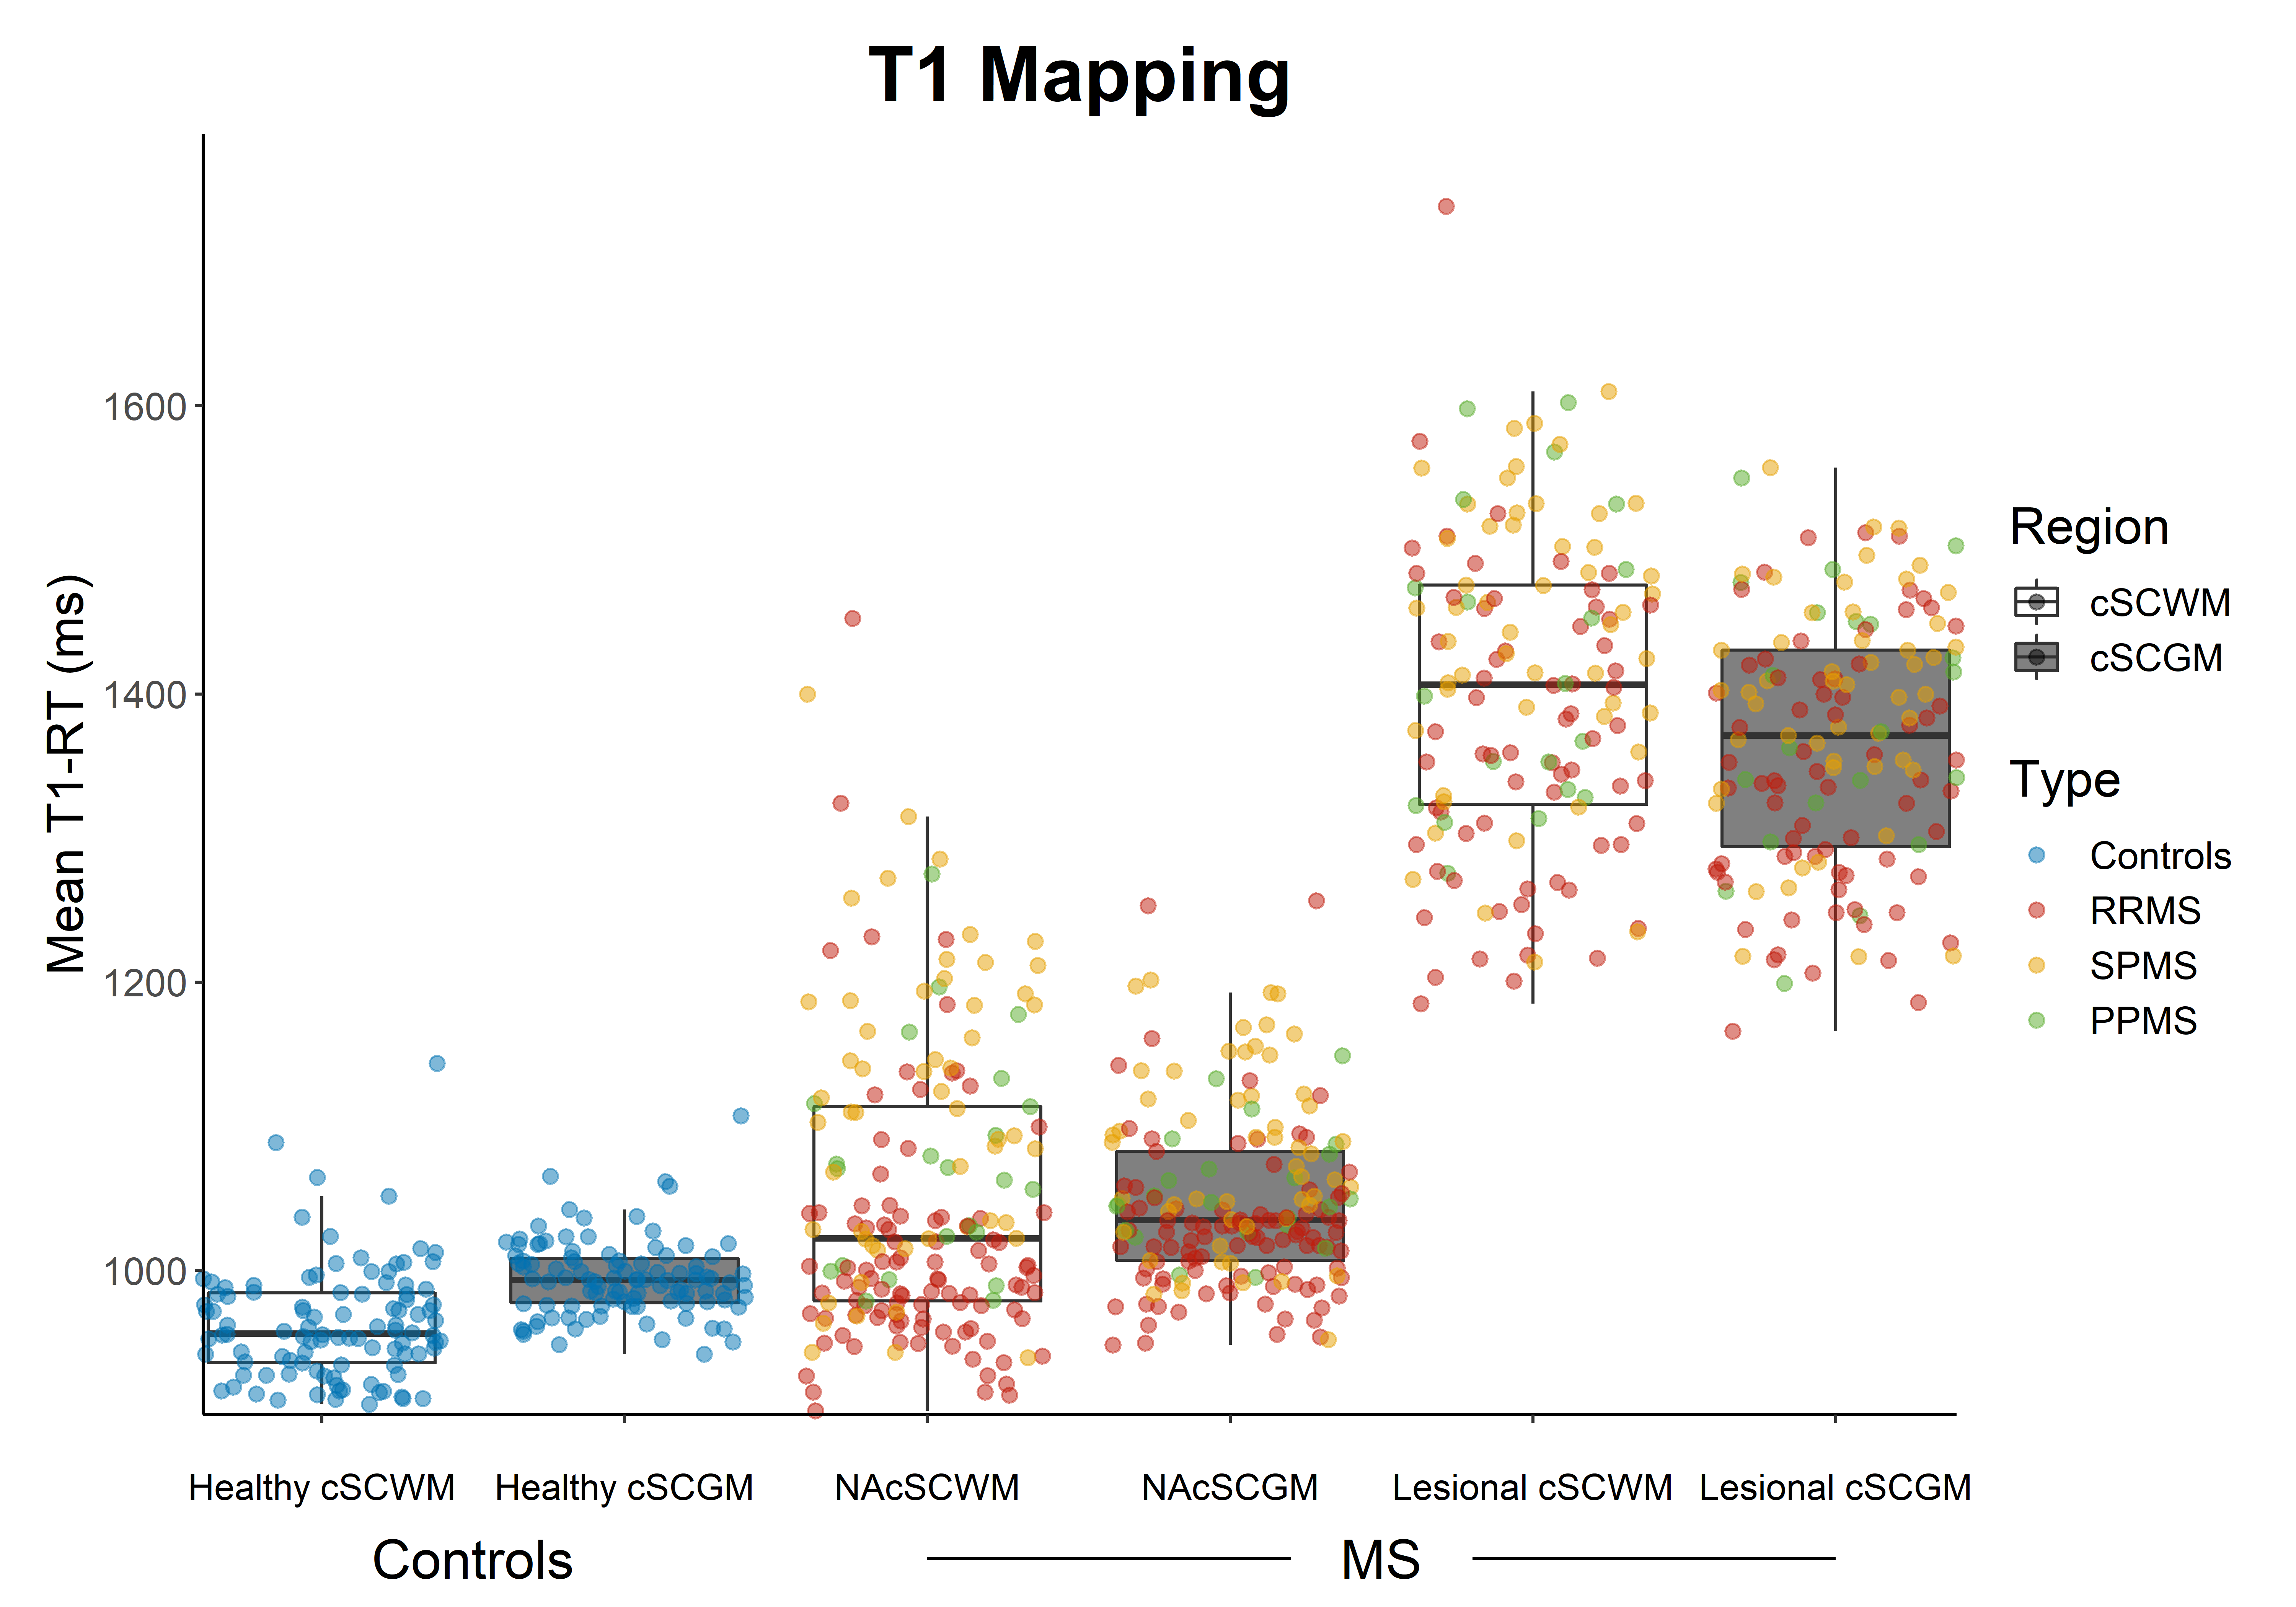
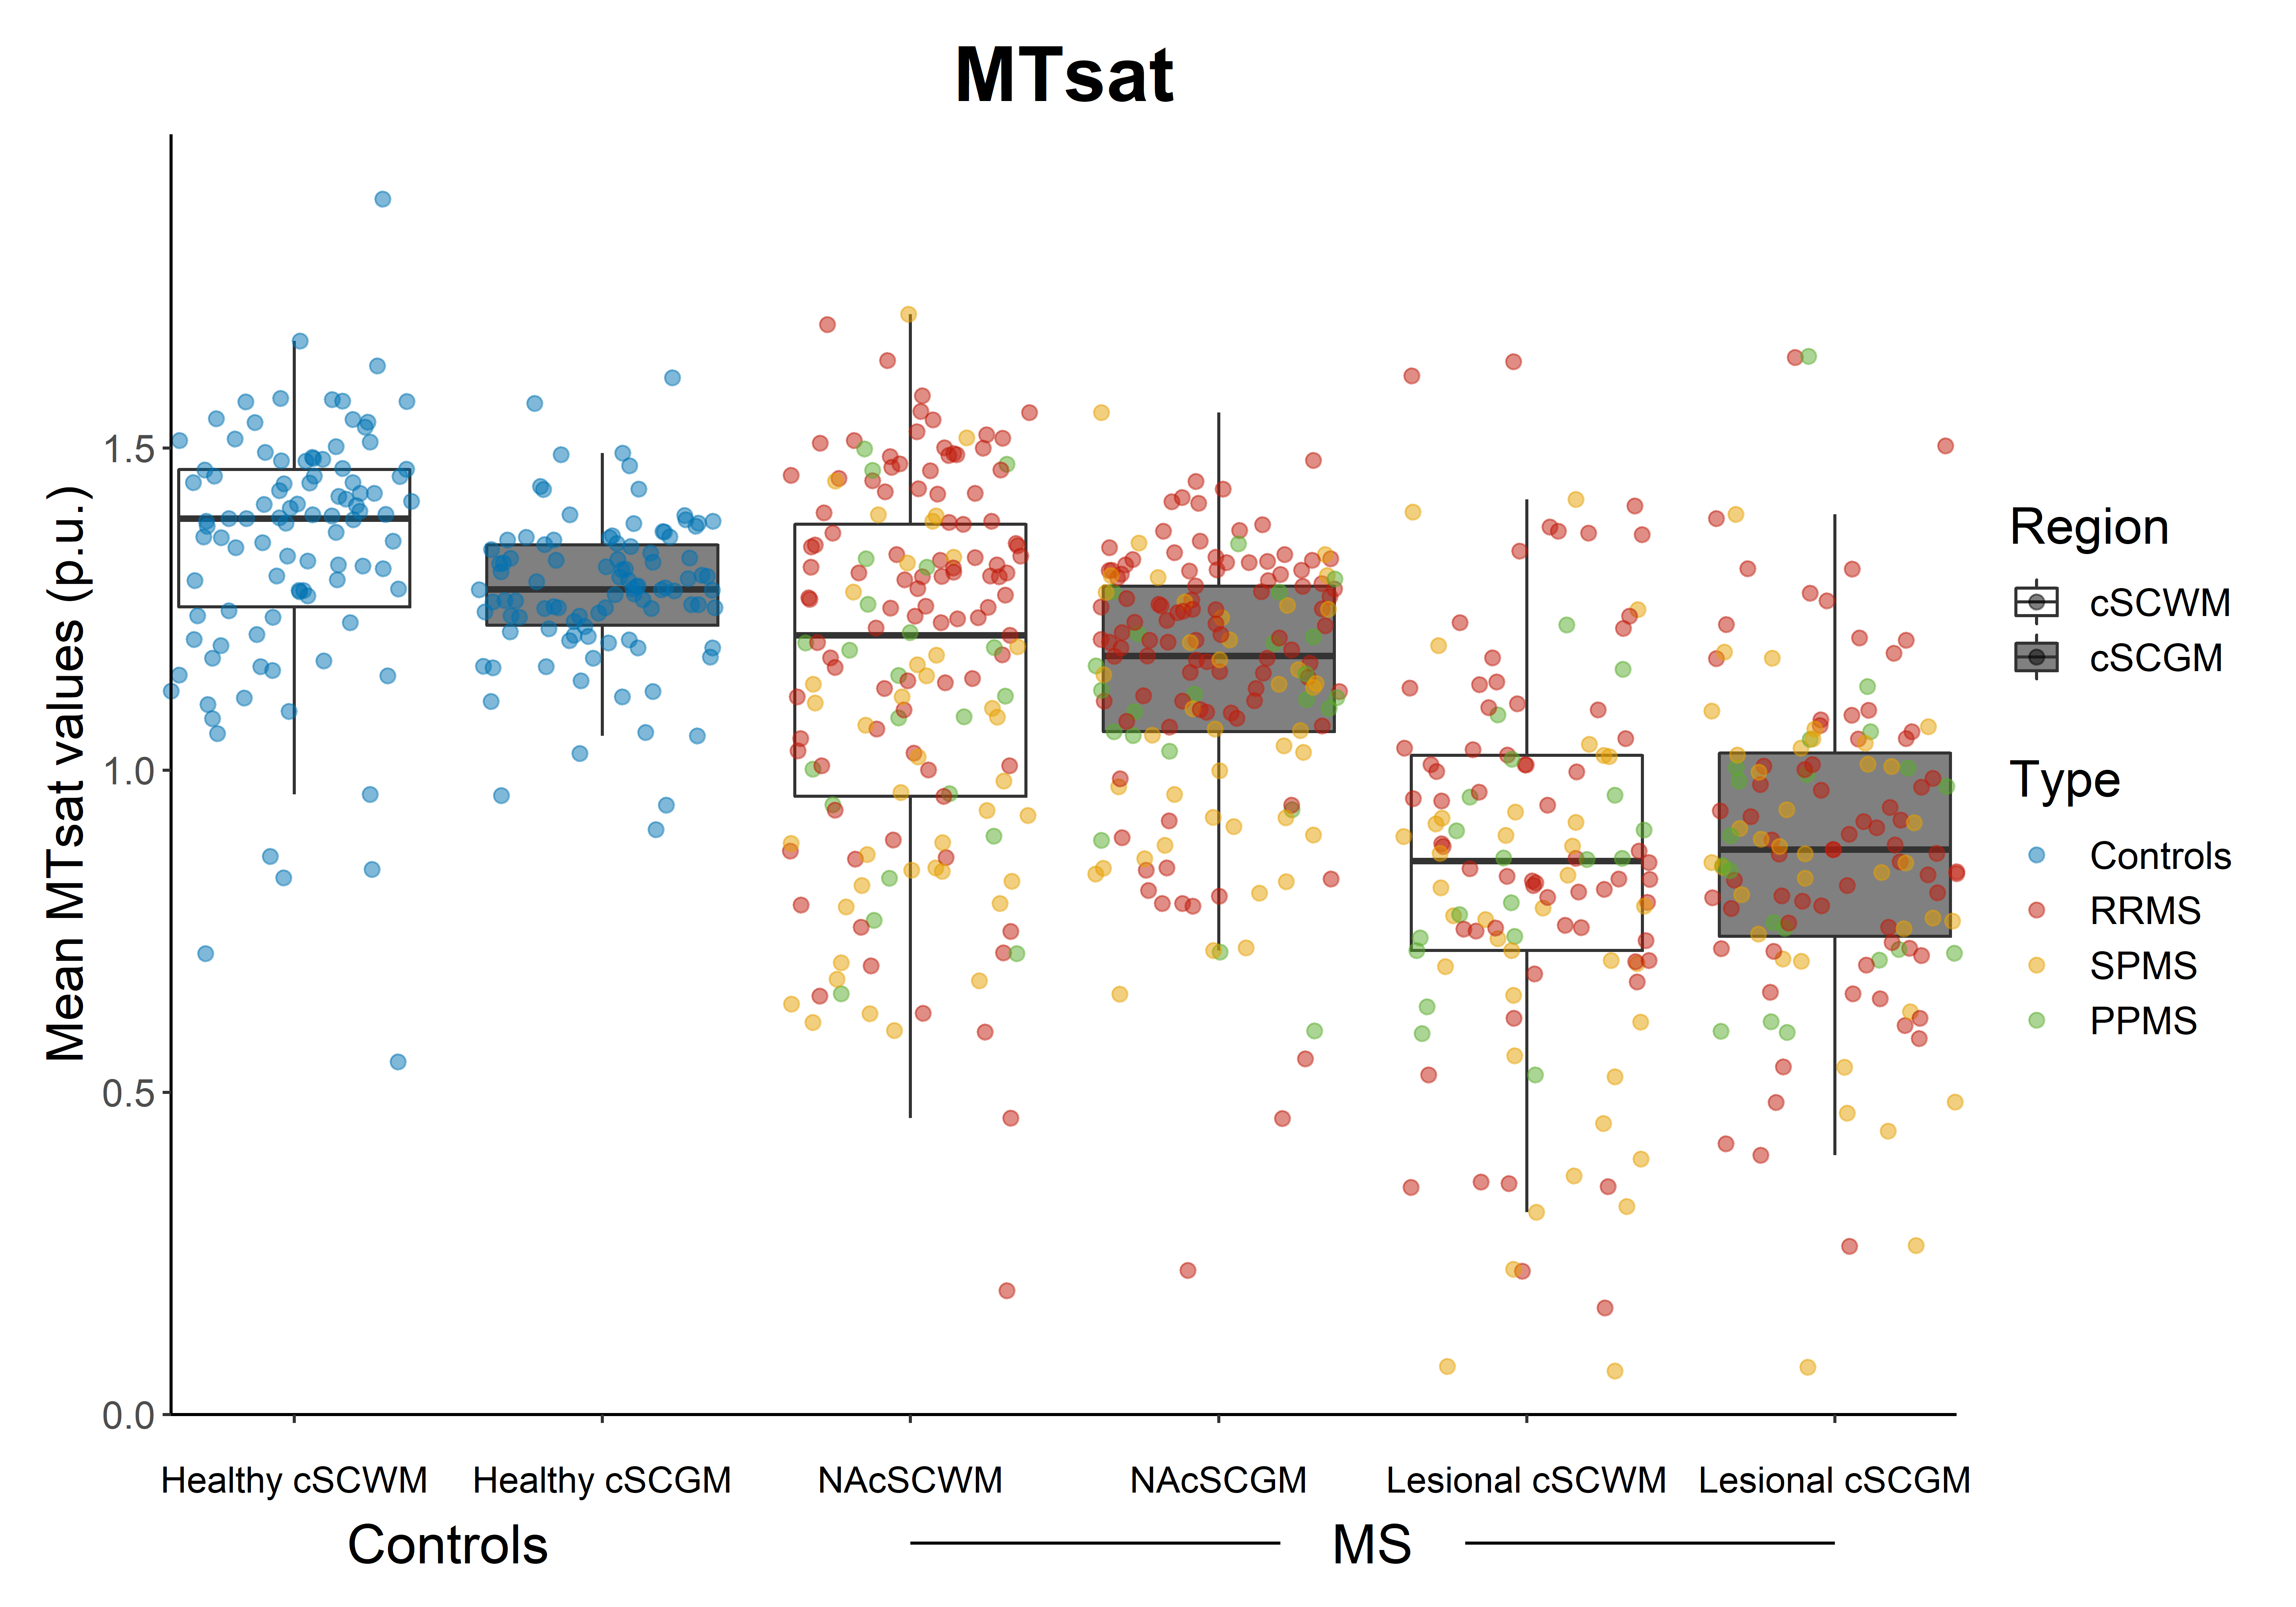
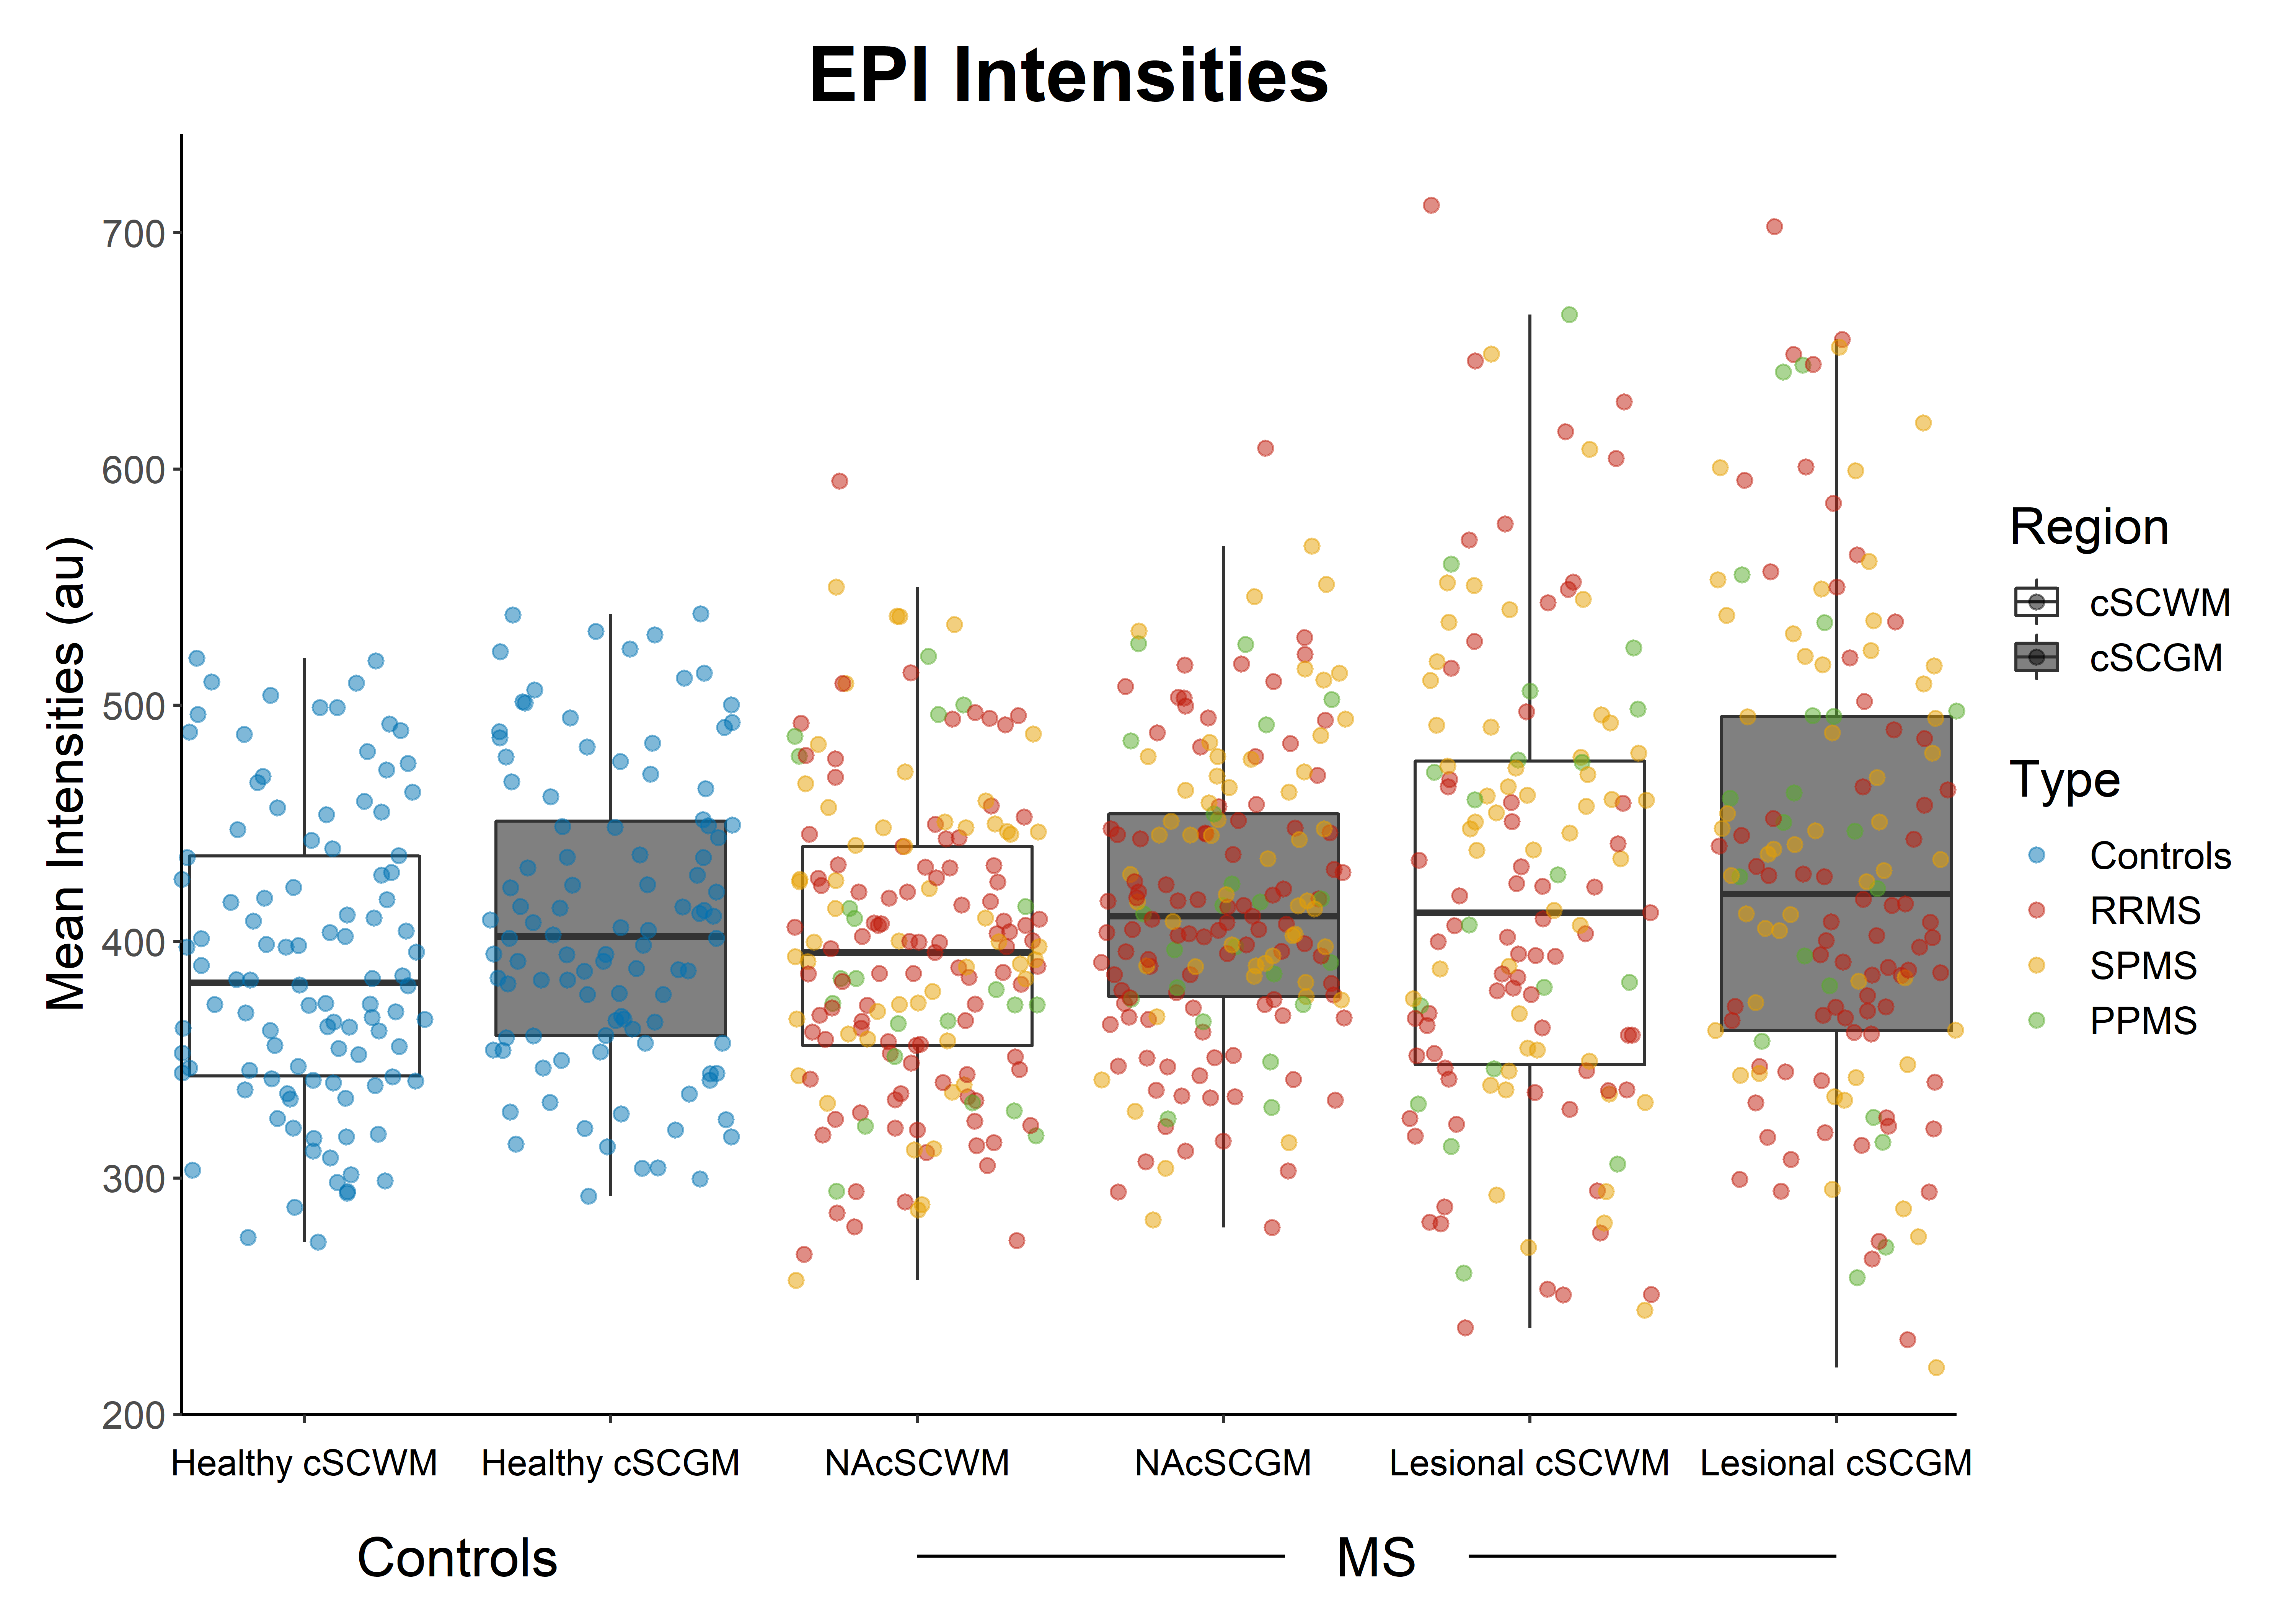
MS patients had longer mean T1-RT and lower mean MTsat values both in the normal-appearing cSCWM (Δ(T1-RT) 75.9±11.6ms; Δ(MTsat) 0.14±0.03(percent unit; p.u.), both p<0.001) and cSCGM (Δ(T1-RT) 47.3±11.6ms; Δ(MTsat) 0.12±0.03p.u., both p<0.001) as well as in the lesional cSCWM (Δ(T1-RT) 423.0±12.3ms; Δ(MTsat) 0.43±0.04p.u., both p<0.001) and cSCGM (Δ(T1-RT) 363.7±8.7ms; Δ(MTsat) 0.36±0.03p.u.), both p<0.001), compared to the cSCWM and cSCGM in healthy controls (Figure 2 & 3). Mean EPI intensities were higher in the lesional cSCWM compared to the normal-appearing cSCWM of MS patients (Δ(EPI) 23.3±7.9 arbitrary units (a.u.), p<0.01) and the cSCWM of healthy controls ((Δ(EPI) 32.2±9.4a.u., p<0.01). In contrast, the mean EPI intensities were higher only in the lesional cSCGM compared to the cSCGM of healthy controls (Δ(EPI) 22.1±9.3a.u., p<0.05) (Figure 4). Mean MTsat values and EPI intensities were similar in the lesional and normal-appearing cSCWM and cSCGM between MS types. Still, SPMS patients had longer T1-RT in the lesional and normal-appearing cSCWM and cSCGM, compared to RRMS (all p<0.001). Older age (β=0.35, p<0.001), the presence of progressive MS (βSPMS=0.30, p<0.001; βPPMS=0.17, p<0.01), and mean T1-RT of the normal-appearing cSCWM (β=0.32, p<0.001) were significantly correlated with a higher EDSS (adjusted R2=60.3%).Discussion
Our work pointed to extensive demyelination and axonal loss both in the lesional and normal-appearing cSC tissue, as shown by longer T1-RT and lower MTsat values. Our results also suggest the presence of chronic inflammation in the lesional cSCWM of SPMS patients, as demonstrated by higher EPI intensities. Interestingly, demyelination and axonal loss occurring in the normal-appearing —but not in the lesional—cSCWM were associated with higher disability in MS patients, indicating that rather diffuse cSCWM damage is linked to neurologic deficits.Conclusion
Advanced quantitative MRI techniques can shed light in the underlying pathologic processes occurring not only in the lesional, but also in normal-appearing SC tissue of MS patients. Further characterization of these pathologic changes could improve our understanding of disease progression in MS.Acknowledgements
No acknowledgement found.References
1. GBD 2015 Neurological Disorders Collaborator Group. Global, regional, and national burden of neurological disorders during 1990-2015: a systematic analysis for the Global Burden of Disease Study 2015. Lancet Neurol 16, 877–897 (2017).
2. Reich, D. S., Lucchinetti, C. F. & Calabresi, P. A. Multiple Sclerosis. New England Journal of Medicine 378, 169–180 (2018).
3. Rahmanzadeh, R. et al. Myelin and axon pathology in multiple sclerosis assessed by myelin water and multi-shell diffusion imaging. Brain 144, 1684–1696 (2021).
4. Granziera, C. et al. Quantitative magnetic resonance imaging towards clinical application in multiple sclerosis. Brain 144, 1296–1311 (2021).
5. Rahmanzadeh, R. et al. A New Advanced MRI Biomarker for Remyelinated Lesions in Multiple Sclerosis. Annals of Neurology 92, 486–502 (2022).
6. Tsagkas, C. et al. Spinal cord volume loss: A marker of disease progression in multiple sclerosis. Neurology 91, e349–e358 (2018).
7. Tsagkas, C. et al. Preferential spinal cord volume loss in primary progressive multiple sclerosis. Mult Scler 25, 947–957 (2019).
8. Rahmanzadeh, R. et al. A comparative assessment of myelin-sensitive measures in multiple sclerosis patients and healthy subjects. Neuroimage Clin 36, 103177 (2022).
9. Helms, G., Dathe, H. & Dechent, P. Quantitative FLASH MRI at 3T using a rational approximation of the Ernst equation. Magnetic Resonance in Medicine 59, 667–672 (2008).
10. Helms, G. & Dechent, P. Increased SNR and reduced distortions by averaging multiple gradient echo signals in 3D FLASH imaging of the human brain at 3T. Journal of Magnetic Resonance Imaging 29, 198–204 (2009).
11. Helms, G., Draganski, B., Frackowiak, R., Ashburner, J. & Weiskopf, N. Improved segmentation of deep brain grey matter structures using magnetization transfer (MT) parameter maps. NeuroImage 47, 194–198 (2009).
12. Tabelow, K. et al. hMRI - A toolbox for quantitative MRI in neuroscience and clinical research. Neuroimage 194, 191–210 (2019).
13. Sati, P., George, I. C., Shea, C. D., Gaitán, M. I. & Reich, D. S. FLAIR*: A Combined MR Contrast Technique for Visualizing White Matter Lesions and Parenchymal Veins. Radiology 265, 926–932 (2012).
14. Avants, B. B. et al. A reproducible evaluation of ANTs similarity metric performance in brain image registration. Neuroimage 54, 2033–2044 (2011).
15. De Leener, B. et al. SCT: Spinal Cord Toolbox, an open-source software for processing spinal cord MRI data. Neuroimage145, 24–43 (2017).
16. McLachlin, S. et al. Spatial correspondence of spinal cord white matter tracts using diffusion tensor imaging, fibre tractography, and atlas-based segmentation. Neuroradiology 63, 373–380 (2021).
Figures