0028
Positron emission tomography with [ 18F]-DPA-714 unveils a smoldering component in most multiple sclerosis lesions driving disease progression1Sorbonne Université, Paris Brain Institute, ICM, CNRS, Inserm, Paris, France, paris, France, 2Department of Neurology, Saint- Antoine Hospital, APHP, Paris, France, paris, France, 3Department of Neurology, Rehabilitation, Ophthalmology, Genetics, Maternal and Child Health, University of Genoa, Genoa, Italy, genoa, Italy, 4Padova Neuroscience Center, University of Padua, Padua, Italy, padua, Italy
Synopsis
Keywords: Multiple Sclerosis, Neuroinflammation, [¹⁸F]-DPA-714, TSPO, Lesion individualization and phenotyping, disease progression
Positron emission tomography with18kDa-translocator (TSPO) tracers opens the perspective to image innate immune cells underlying the smoldering component of multiple sclerosis (MS), that currently mostly escape from MRI evaluation. Using [18F]-DPA-714-PET, we developed a novel lesion TSPO based classification of MS lesions and showed that an unexpectedly high proportion have a persistent neuroinflammatory content. A longitudinal follow up of subjects unraveled that this lesional smoldering component predicted atrophy and clinical progression. Following the acute phase, most lesions may therefore develop a chronic inflammatory component which can persist for several years, subsequently promoting neurodegeneration and clinical progression in MS.Introduction
Several post-mortem investigations described a large heterogeneity in white matter (WM) lesions when it comes to their inflammatory composition in people with multiple sclerosis (PwMS).¹ ² A subtype of lesion with a persistent inflammatory component as reflected by activated innate immune cells that are localized on the border or widespread within the lesion have been linked to the severity of the disease.¹ ³ As current MRI sequences do not specifically quantify innate immune cells, little is known about their contribution to disease evolution in vivo. In this study with the aim to unravel the prognostic value of persisting neuroinflammation in MS lesions, we developed a 18kDa-translocator-protein-PET based classification of each lesion according to innate immune cell content and localization and assessed the respective predictive value of lesion phenotype on atrophy and disability progression over 2 years.Methods
We analyzed 36 PwMS (12 relapsing-remitting MS RRMS; 13 secondary progressive MS, SPMS; 11 primary progressive MS) and 19 healthy controls (HC), who underwent a dynamic [18F]-DPA-714 PET at baseline. At baseline and 2 years of follow-up, PwMS underwent MRI and were clinically evaluated with the Expanded-Disability-Status-Scale (EDSS). We calculated the EDSS-stepwise-change and classified patients with clinical worsening (EDSS-stepwise-change>0) or clinically stable at 2 years of follow up.The MRI protocol included the following sequences: 3-dimensional T1-weighted magnetization-prepared rapid gradient-echo (3D-T1 MPRAGE, TR/TE 2300/2.98 ms, inversion time 900 ms, resolution 1.0×1.0×1.1 mm³), T2-weighted (T2-w, TR/TE 4000/83 ms, resolution 0.9×0.9×3.0 mm³), 3-dimensional fluid-attenuated inversion recovery (FLAIR, TR/TE 8880/129 ms, resolution 0.9×0.9×3.0 mm³), and pre- and post-gadolinium T1-weighted spin-echo (T1SE, TR/TE 650/14 ms resolution, 1.0×1.0×3.0 mm³.
In PwMS, hyperintense WM lesions were manually segmented, and probability masks were generated using Jim (v6.0, http://www.xinapse.com/) based on T2-w intensities in lesions. To improve individual lesion detection within areas of confluence, we detected clusters resembling the center of each lesion by calculating the hessian matrix of the probability mask,⁴ as demonstrated in figure 1-A. Once Individualized, lesions were registered to the standard space (Montreal Neurological Institute [MNI152 09c sym]) and gadolinium enhanced and small lesions were removed from further analyses.
The PET protocol consisted of an intravenous bolus injection of 198.4 ± 22.9 MBq of [18F]-DPA-714 at the beginning of a 90-min dynamic acquisition. Images were reconstructed using the 3D ordinary Poisson ordered subset expectation maximization algorithm and the point spread function was modeled within the reconstruction to minimize partial volume effect (PVE).⁵
Applying the Logan graphical method for DPA-PET distribution volume ratio (DVR) calculation,⁵ a threshold to define the presence of significant inflammation in an area (rim/center with a volume >50 mm³, figure 1-B) was calculated based on a comparison between PwMS and HC in the standard space.⁶
Each lesion was classified with a regard to whether the persisting inflammation is present in the rim or the center. We defined 3 lesions subtypes: homogeneously-active (lesion’s center classified “active”), rim-active (“inactive” center with an “active” perilesional rim) or non-active as illustrated in figure 1-C. We measured longitudinal atrophy using the Jacobian Integration method⁷ and we defined patients who will develop pathological cortical atrophy in the coming 2 years (atrophy>0.41%).⁸
Results
Out of 1335 non-gadolinium enhanced MS lesions, 53% were classified homogeneously-active (median:17/PwMS), 41% non-active (14/PwMS) and 6% rim-active (1/PwMS). both homogeneously-active and rim active-lesions were more frequent in patients in the progressive form compared with the relapsing form as shown in figure 2-A and 2-B. The number of homogeneously active lesions was the strongest predictive metric of longitudinal brain atrophy (beta =0.44, p=0.018), cortical atrophy (rho=0.43, p=0.024) and EDSS-stepwise-change (rho=0.37, p=0.025). Both Homogeneously active and rim active were more frequent in patients with a pathological cortical atrophy compared to the rest of the cohort (homogeneously-active: median in patient with pathological cortical atrophy =27.5, median in patients without pathological cortical atrophy= 10, p=0.025 figure 2-C; rim-active: median in patient with pathological cortical atrophy= 4, median in patients without pathological cortical atrophy = 0.5, p = 0.038 figure 2-D). Only homogeneously active lesions were significantly more frequent in patients with clinical worsening compared to clinically stable (homogeneously-active: median in patients with clinical worsening = 28.5, median in clinically stable patient = 9.5, p = 0.013 figure 2-E and 2-F).Conclusion
[18F]-DPA-714-PET revealed that an unexpectedly high proportion of MS lesions have a smoldering component, which predicts atrophy and clinical progression. This suggests that following the acute phase, most lesions develop a chronic inflammatory component which can persist for several years, promoting neurodegeneration and clinical progression.Acknowledgements
No acknowledgement found.References
- Luchetti, S. et al. Progressive multiple sclerosis patients show substantial lesion activity that correlates with clinical disease severity and sex: a retrospective autopsy cohort analysis. Acta Neuropathol. (Berl.) 135, 511–528 (2018).
- Kuhlmann, T. et al. An updated histological classification system for multiple sclerosis lesions. Acta Neuropathol. (Berl.) 133, 13–24 (2017).
- Frischer, J. M. et al. Clinical and pathological insights into the dynamic nature of the white matter multiple sclerosis plaque. Ann. Neurol. 78, 710–721 (2015).
- Dworkin, J. D. et al. An Automated Statistical Technique for Counting Distinct Multiple Sclerosis Lesions. AJNR Am. J. Neuroradiol. 39, 626–633 (2018).
- García-Lorenzo, D. et al. Validation of an automatic reference region extraction for the quantification of [18F]DPA-714 in dynamic brain PET studies. J. Cereb. Blood Flow Metab. Off. J. Int. Soc. Cereb. Blood Flow Metab. 38, 333–346 (2018).
- Bodini, B. et al. Individual Mapping of Innate Immune Cell Activation Is a Candidate Marker of Patient-Specific Trajectories of Worsening Disability in Multiple Sclerosis. J. Nucl. Med. 61, 1043–1049 (2020).
- Nakamura, K. et al. Jacobian integration method increases the statistical power to measure gray matter atrophy in multiple sclerosis. NeuroImage Clin. 4, 10–17 (2014).
- Eijlers, A. J. C. et al. Cortical atrophy accelerates as cognitive decline worsens in multiple sclerosis. Neurology 93, e1348–e1359 (2019).
Figures
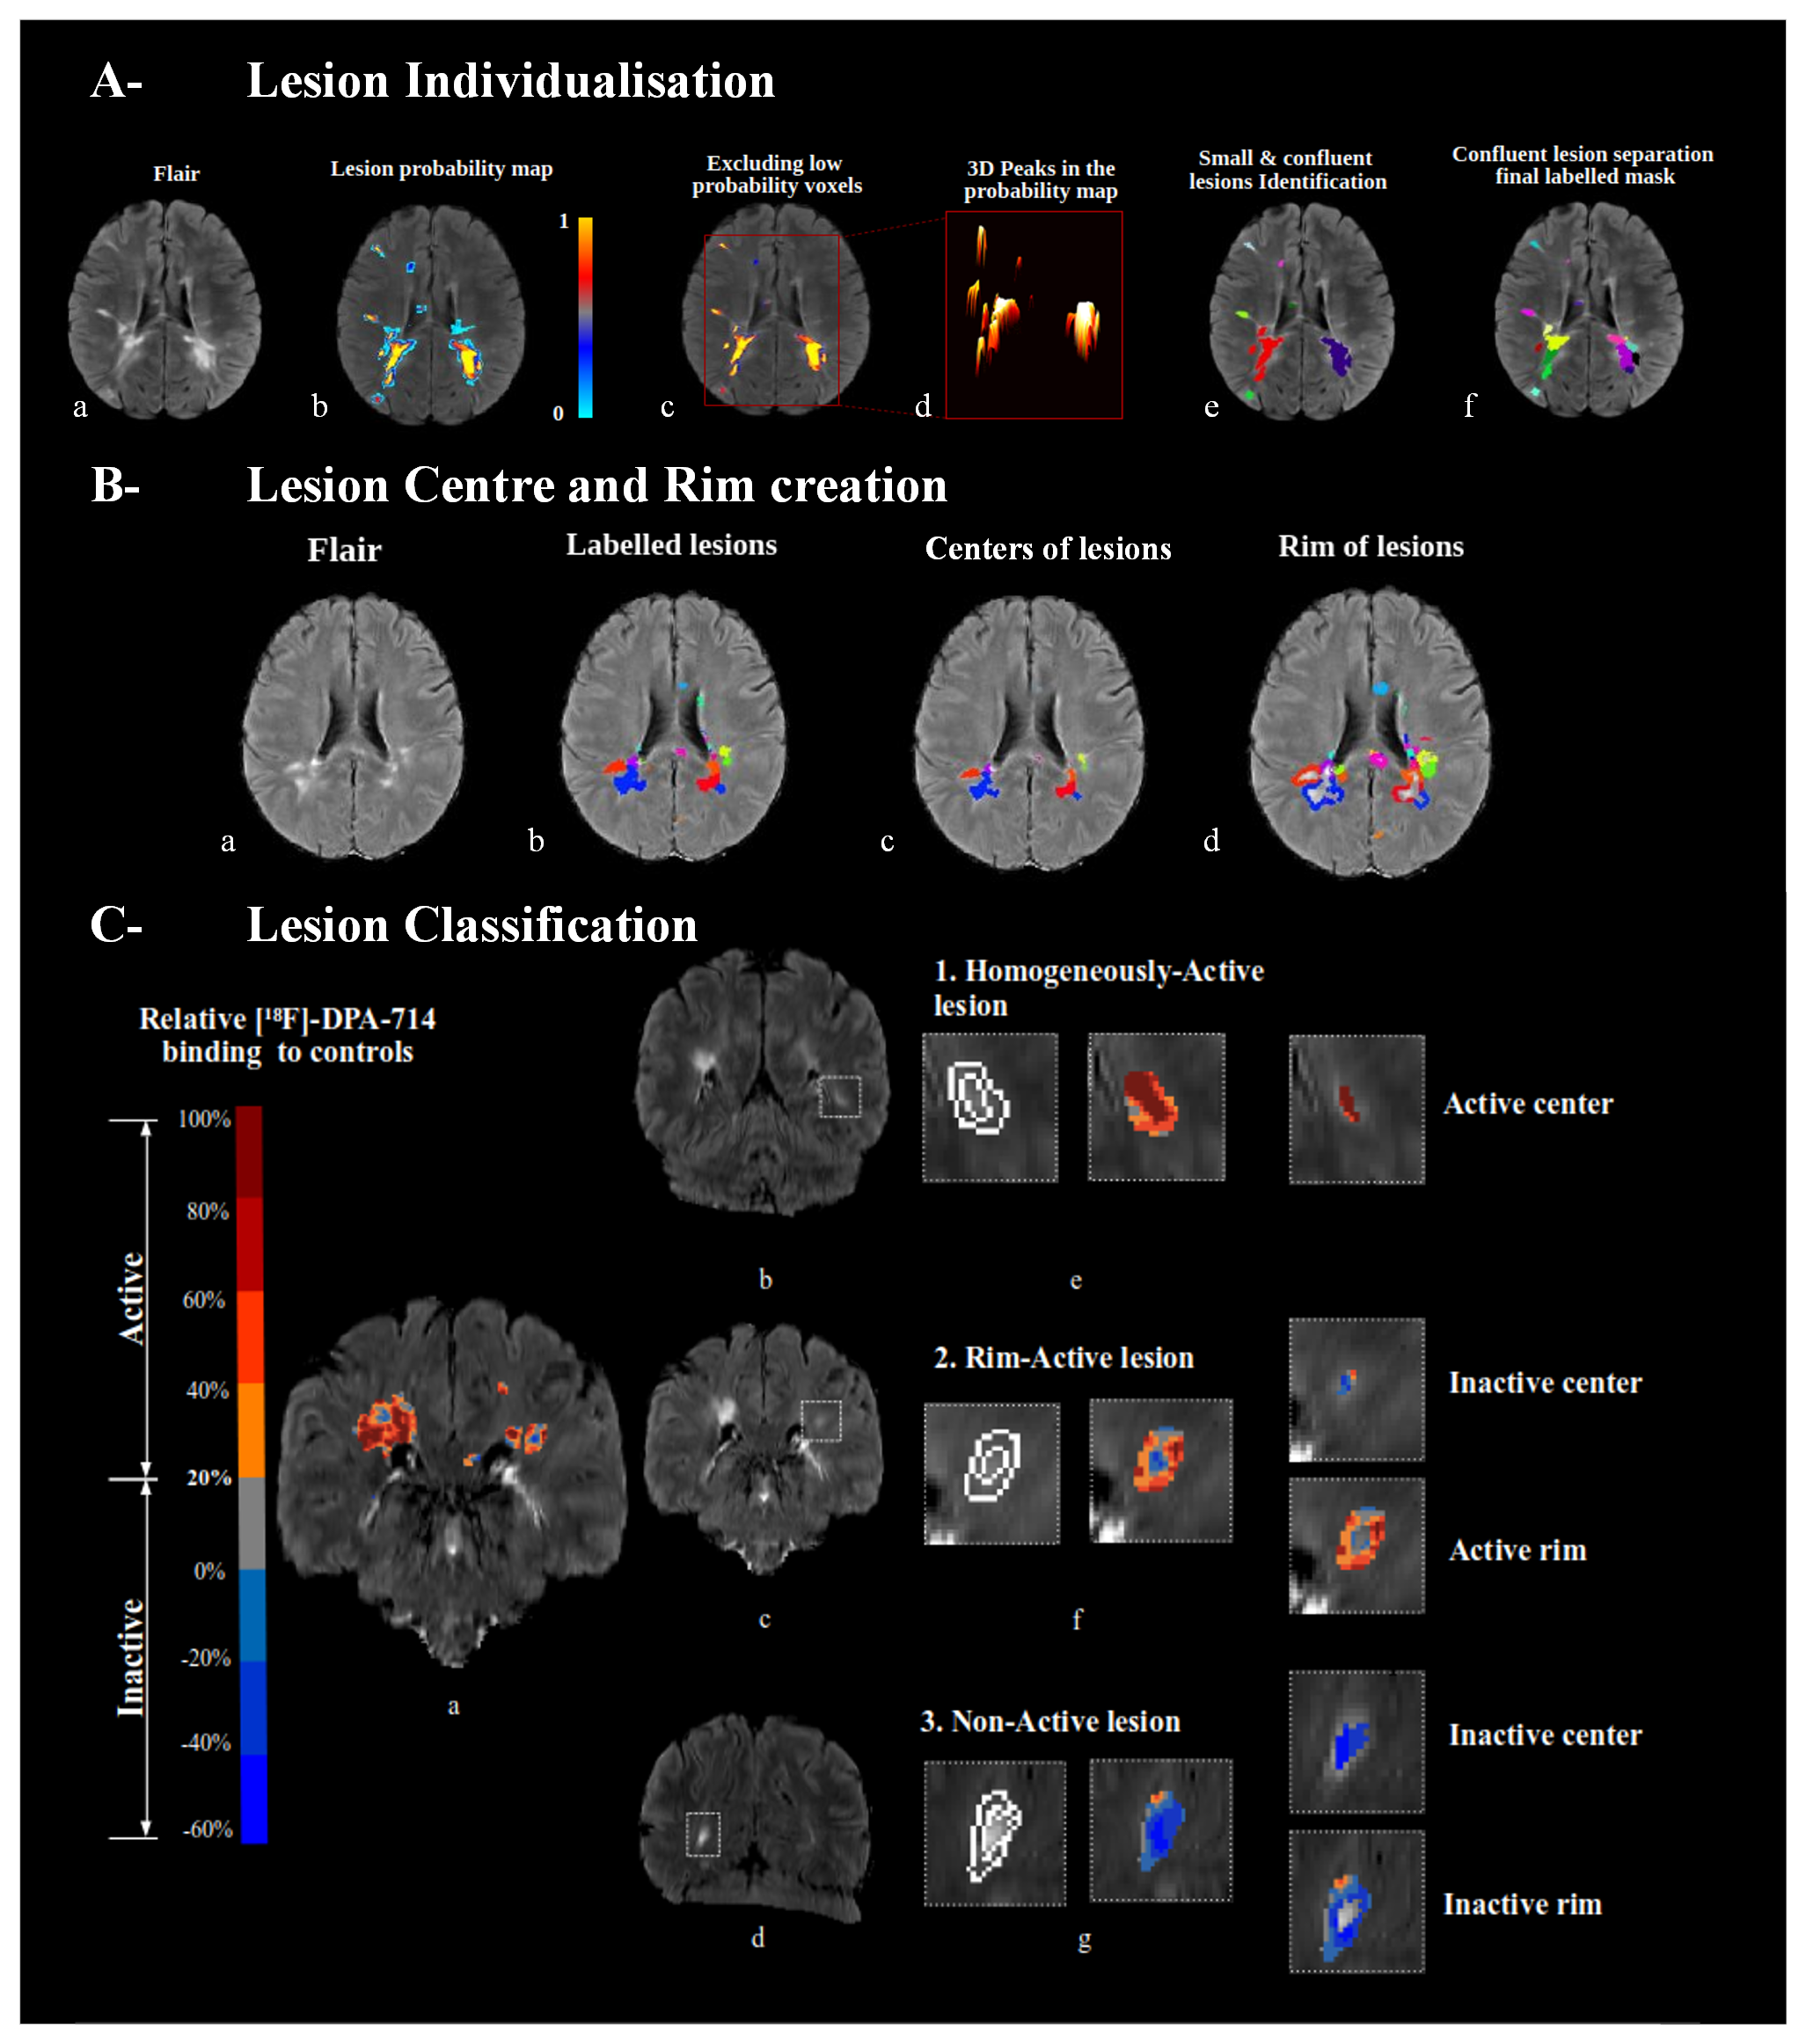
White matter lesion classification according to MRI and [18F]-DPA-714
A- (a) A subject with MS (SwMS) with confluent lesions. (b) Lesion probability map and exclusion of low values (c). (d,e) Small lesions and centers within confluent lesion discerning.
B- centers (c) and rims (d) were obtained by erosion 1mm and dilation 2mm of labelled lesion mask (b).
C- [18F]-DPA-714 binding changes between white matter (WM) lesions and corresponding areas in the WM of controls, overlayed on the FLAIR of SwMS. A threshold of 20% defines areas of pathological inflammation in patients (a).
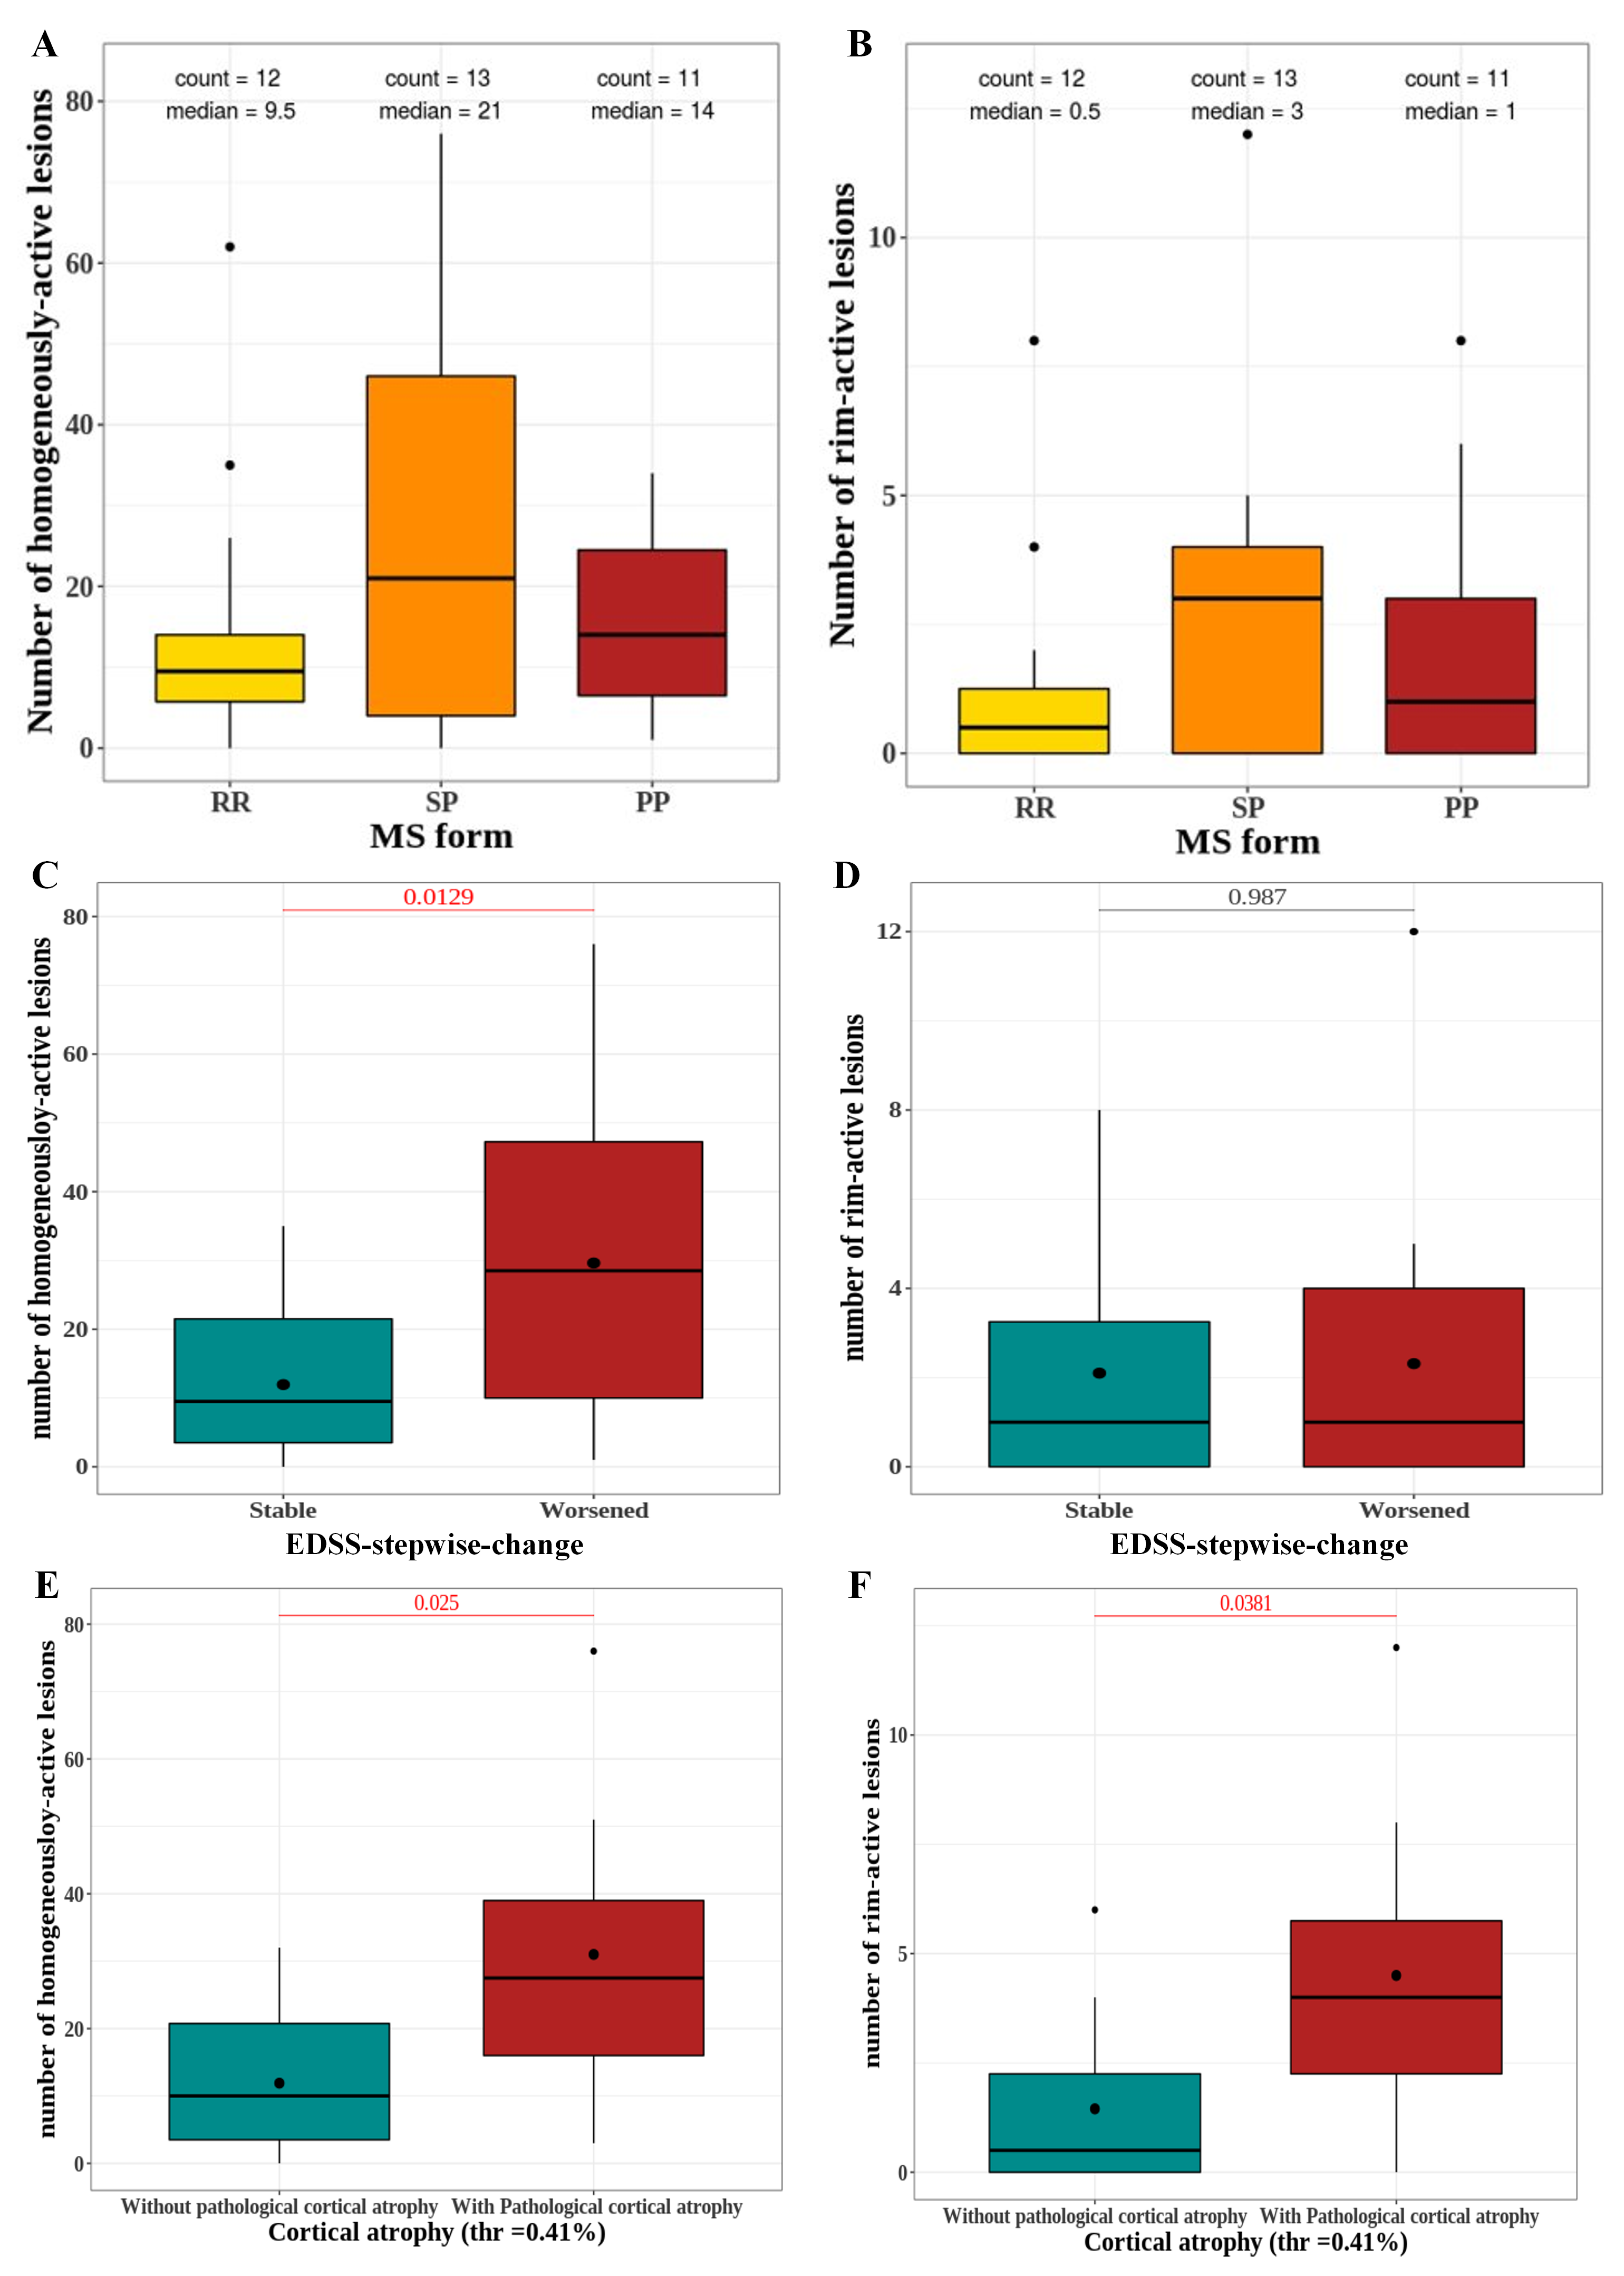
Homogeneously-active lesions predict disease progression.
Box plots showing the repartition of homogeneously active (A) and rim active (B) lesions according to MS forms. Box plots showing the distribution of homogeneously active (C) and rim active (D) lesions according to patient’s EDSS-stepwise-change status: Stable or worsened. Box plots describing the distribution of homogeneously-active (E) and rim-active (F) lesions according to the presence of pathological cortical atrophy in patients.