0026
Multiple Sclerosis (MS): High Contrast Visualisation of Abnormalities in Normal Appearing White Matter Using MASDIR Sequences1Mātai Medical Research Institute, Gisborne, New Zealand, 2Univeristy of Auckland, Auckland, New Zealand, 3Auckland Bioengineering Institute, Auckland, New Zealand, 4GE Healthcare, Victoria, Australia, 5University of California San Diego, San Diego, CA, United States
Synopsis
Keywords: Neuroinflammation, Multiple Sclerosis, neurodegeneration, MASDIR, Inversion Recovery (IR) sequences, tissue property filters
Keywords; Neuroinflammation, Multiple Sclerosis, Neuro, Drugs.
MASDIR sequences can show up to 15 times the contrast of T1-weighted MP-RAGE sequences. This is a consequence of using changes in T1 synergistically 3-4 times in the same sequence to detect subtle changes due to neuroinflammation and lesions. Extensive high contrast focal and diffuse abnormalities in white matter were demonstrated in areas that showed no abnormality with state-of-the-art T2-weighted spin echo and T2-FLAIR sequences in patients with multiple sclerosis. This demonstrated good correlation with advanced sequences such as T1 and myelin maps.
Purpose
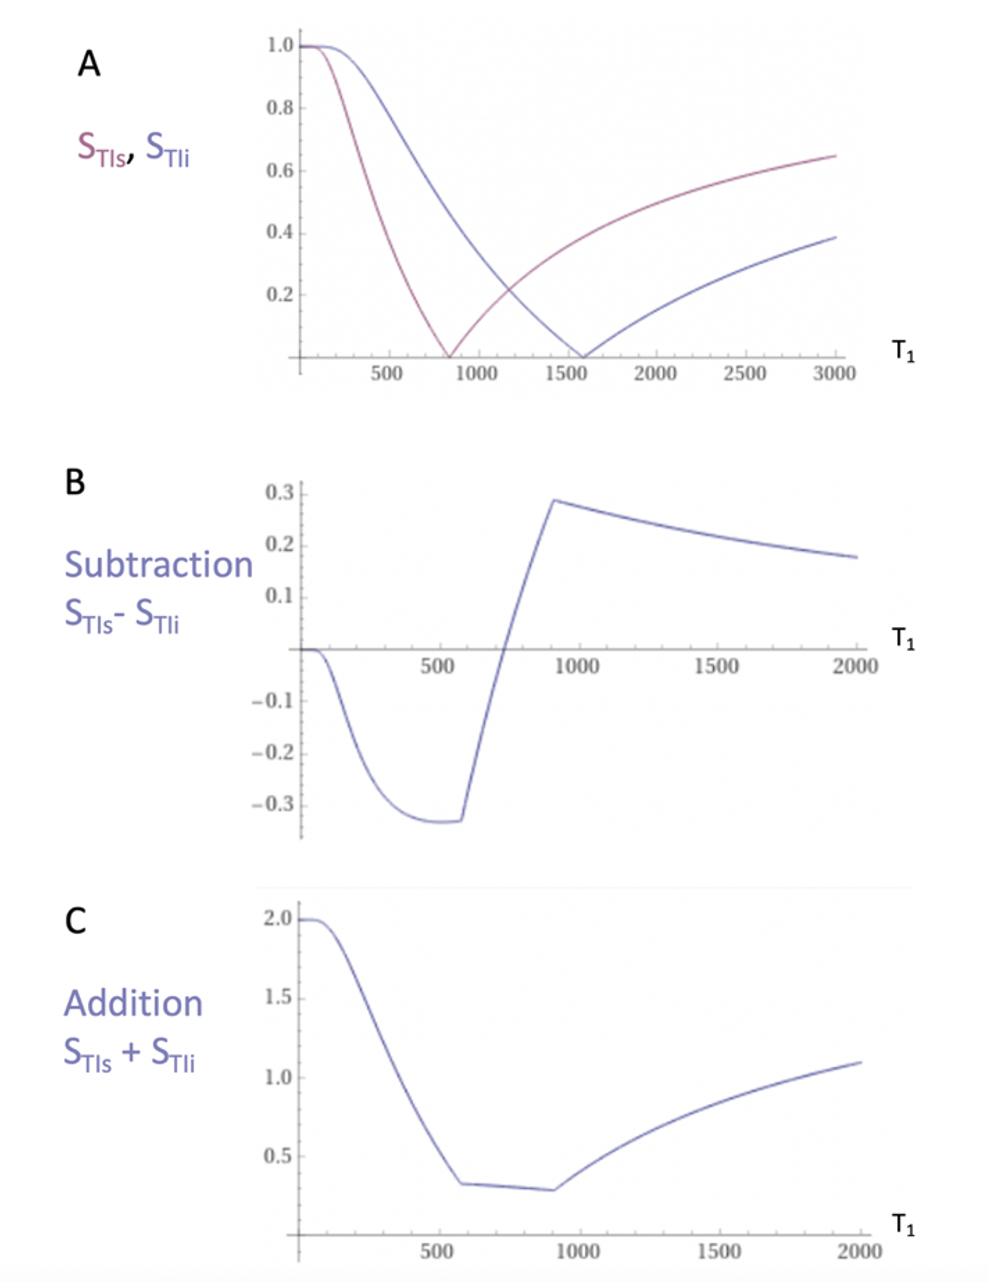
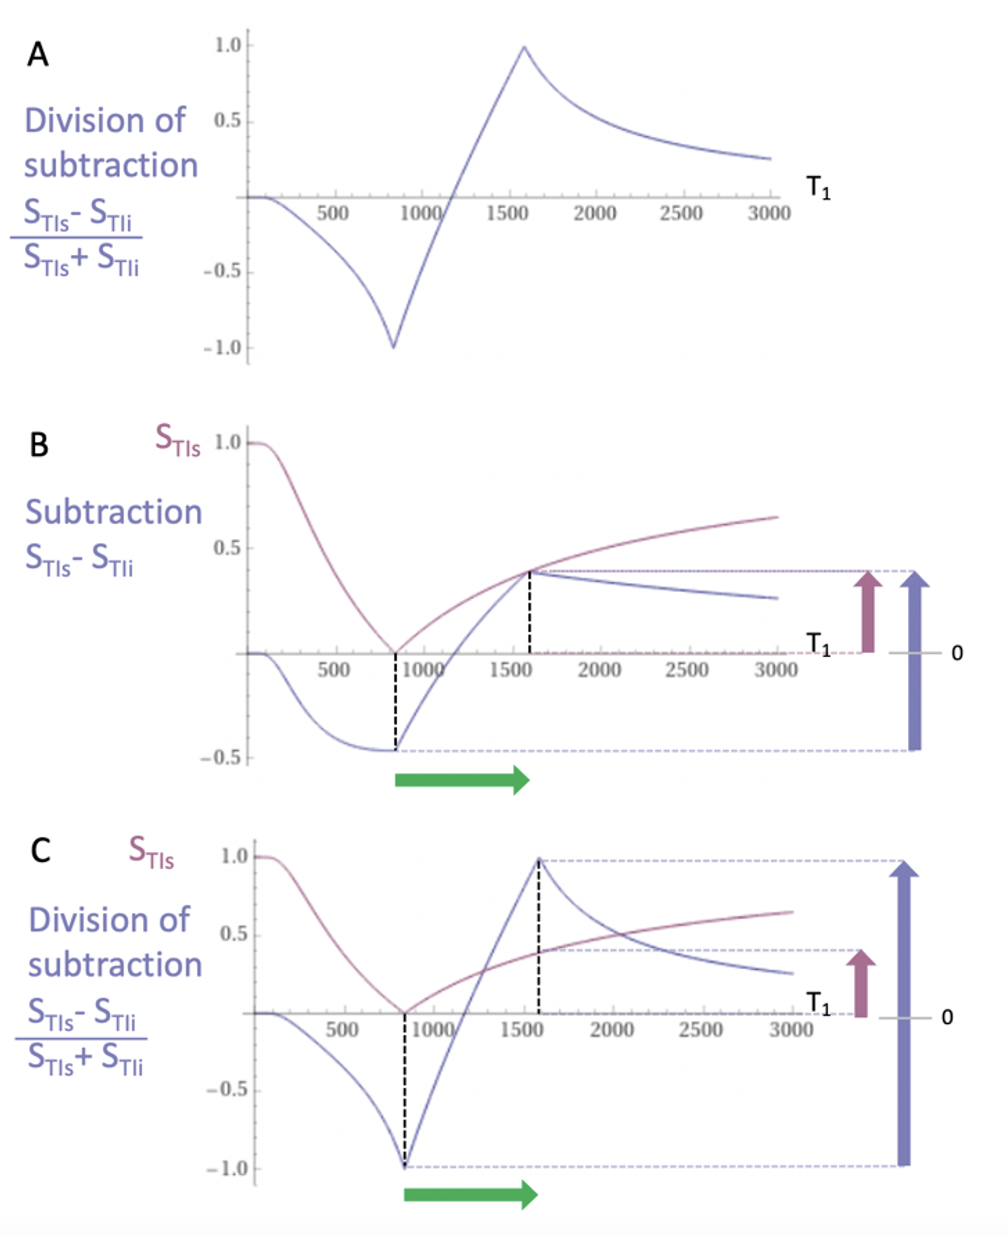
The first published MRI study in Multiple Sclerosis (MS) used a T1-weighted Inversion Recovery (IR) sequence and outperformed x-ray CT1. Two IR sequences with different Inversion Times (TIs) were multiplied together in the form of a Double IR (DIR) sequence in 19852 and this sequence has an established role in the imaging of cortical lesions in MS3. MASDIR sequences subtract, add and/or divide two IR sequences with different TIs4 to increase contrast. In the particular case of the divided Subtracted IR (dSIR) sequence the contrast produced by an increase of T1 in the sensitive middle Domain (mD) of the sequence may be five or more times greater than that produced by a conventional IR sequence (Figs. 1-2).For detecting subtle white matter disease the sequence requires accurate nulling of white matter with the first IR sequence. There is a limit to the amplification of contrast as the difference between the TIs of the two IR sequences (∆TI) is decreased and noise and/or artefact become predominant.
In this feasibility study the objective was to implement 2D and 3D forms of the dSIR sequence using conventional standard IR sequences and compare results with T2-FLAIR and synthetically created myelin maps to assess theoretical models and determine amplification limits for larger studies.
Methods
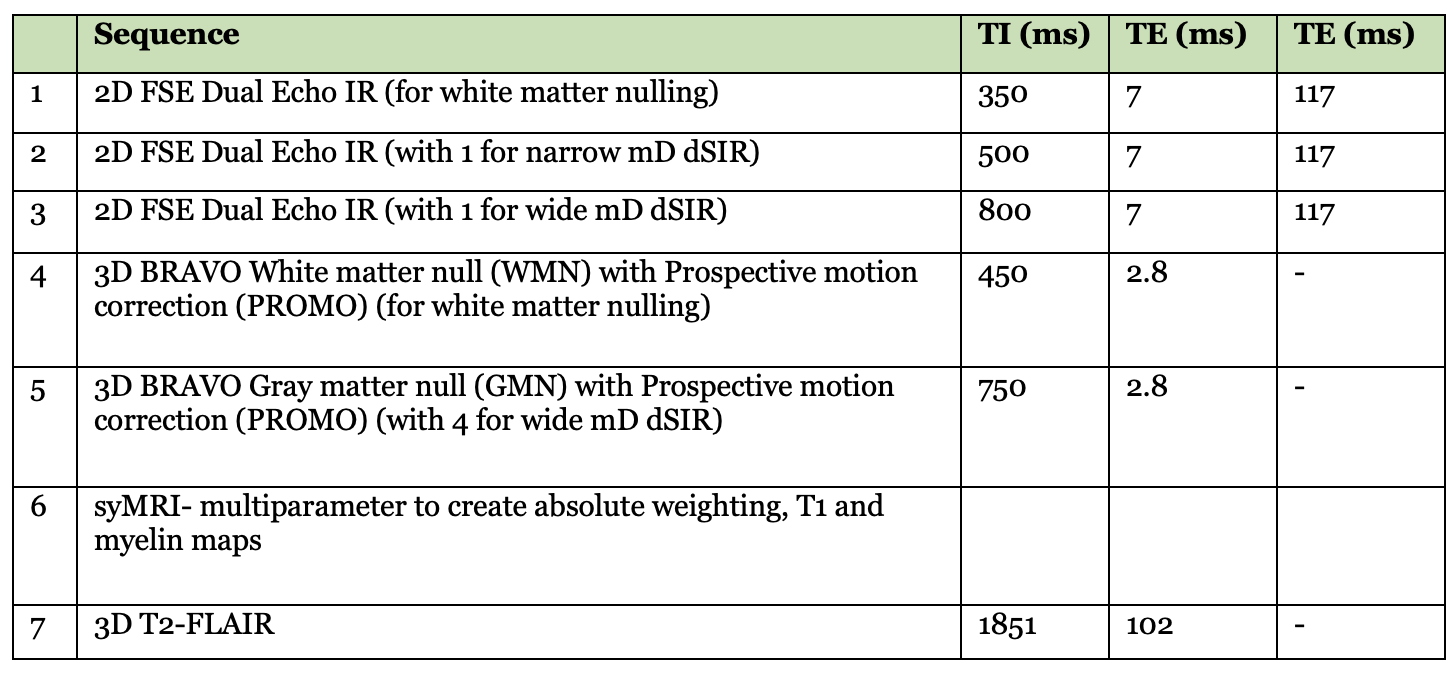
Under ethical approval, MS patients were scanned on a 3T MRI scanner (SIGNA Premier; General Electric Healthcare, Milwaukee, WI) with an AIR™ 48-channel head coil. Standard 2D FSE IR and 3D fast-SPGR IR (BRAVO) sequences were acquired with inversion times (TIs) required to produce MASDIR images: a short TI to null white matter (WM), a slightly increased TI to provide contrast in a narrow middle Domain (mD), and a further increased TI to provide contrast in a wide mD. An in-house built MATLAB code (MathWorks, Natick, WA) was used to produce dSIR images. Synthetic T1 maps, myelin maps plus 3D T2-FLAIR images were acquired for comparison (Fig. 3).Results
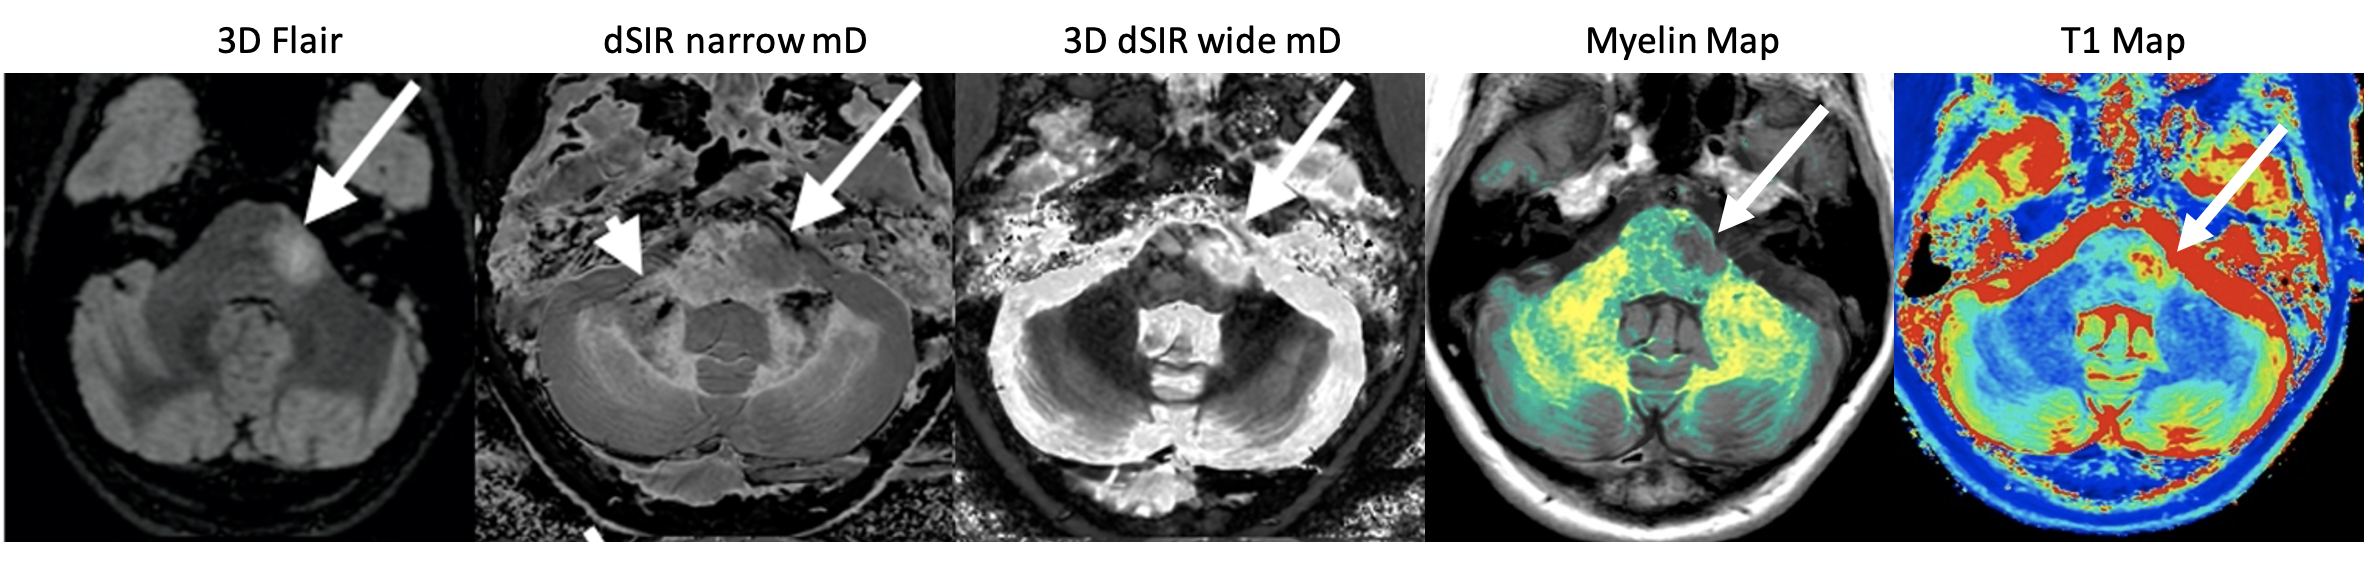
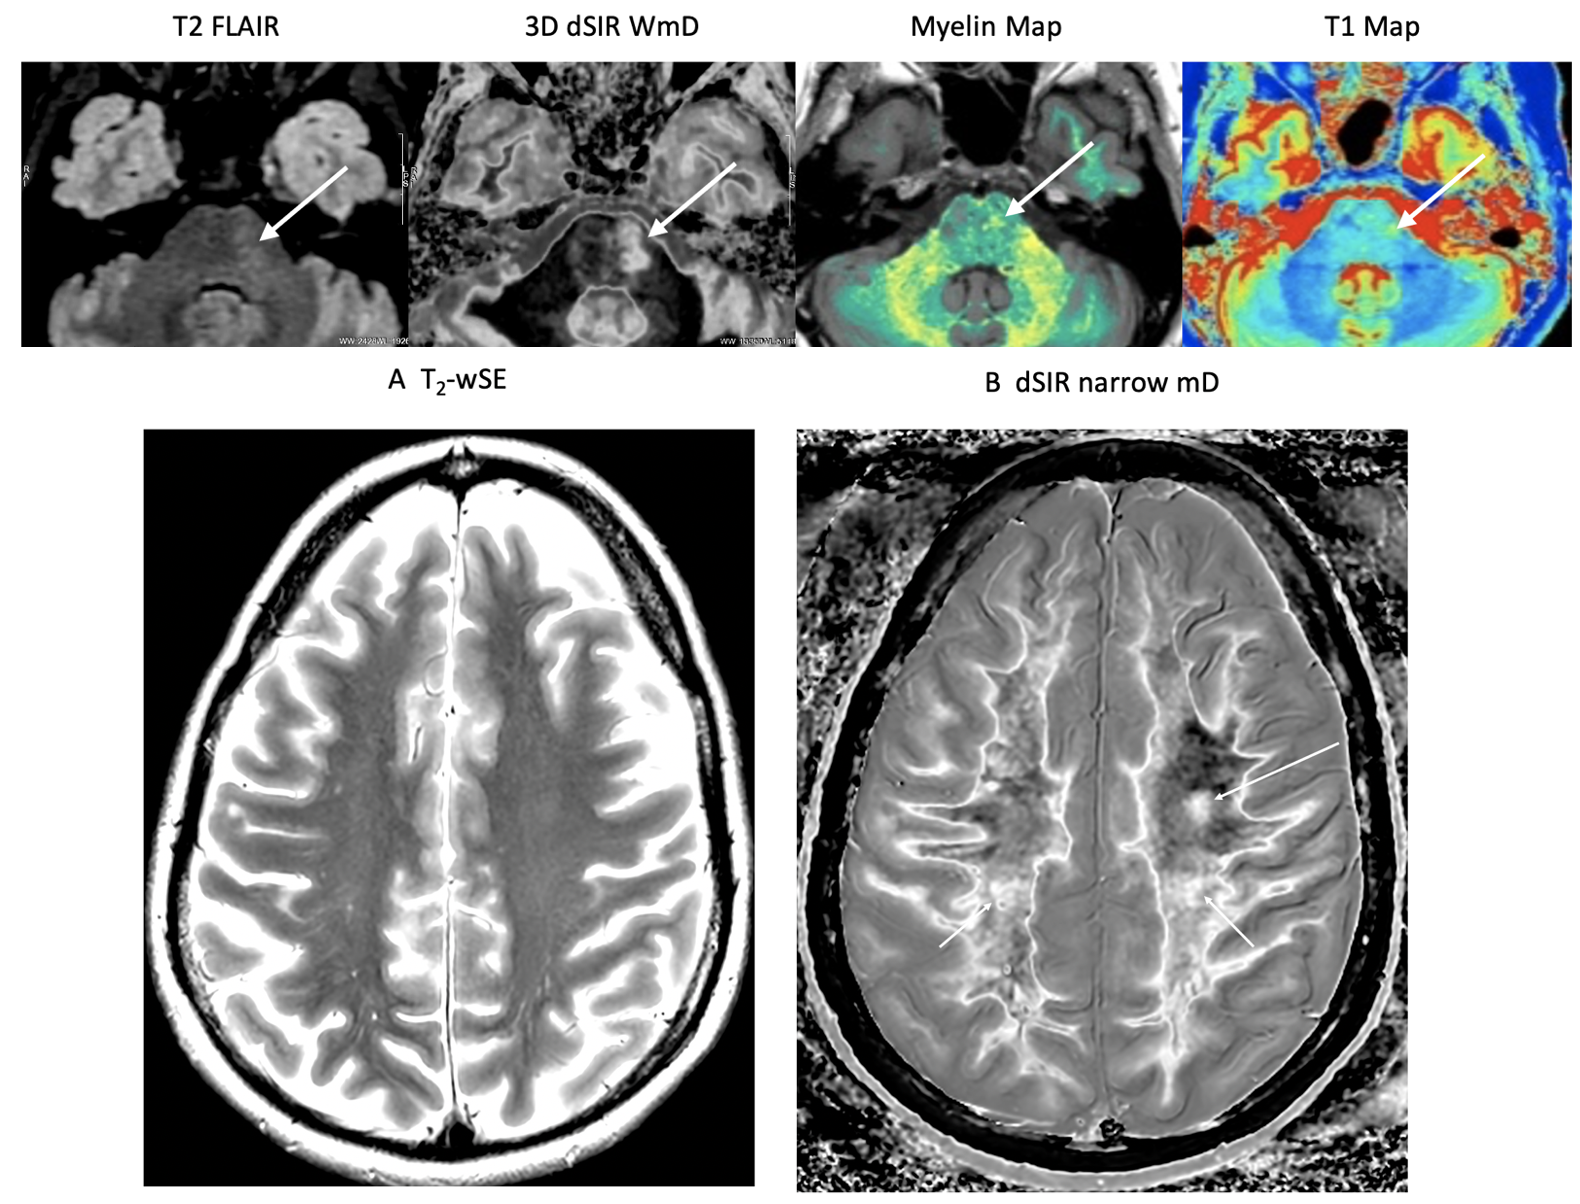
Fig. 4 shows a relapsing MS patient comparing T2-FLAIR with 2D dSIR and 3D dSIR images. The 2D dSIR images show abnormalities that are not seen with the T2-FLAIR sequence. The 3D wide mD image shows higher lesion contrast than the T2-FLAIR. Fig. 5 shows an MS remission patient with a plaque in the left pons better seen on the dSIR image than on the T2 FLAIR. No lesions seen on the T2-wSE image but very extensive focal and diffuse changes within the white matter on the dSIR images. There are also high contrast high resolution boundaries between white and gray matter on the dSIR image.Discussion
The MASDIR approaches overcome issues with standard FLAIR images whereby an increase in T2 results in increased signal but the accompanying increase in T1 decreases signal. Both the 2D and 3D IR sequences were implemented using pre-existing conventional sequences. Additional in-house built Matlab code was used to add, subtract and/or divide the images and to increase sensitivity to small changes in tissue T1.dSIR sequences using a narrow domain results in an amplification of T1 contrast compared to MP-RAGE. The images did not appear noisy and were not degraded by artefact. In addition, high contrast, high spatial resolution boundaries were demonstrated between white and grey matter. These were far more obvious than on T2-weighted spin echo or T2-FLAIR sequences and demonstrated high correlation with T1 and myelin maps.
Normal appearing white matter on T2-FLAIR sequences showed both focal lesions and diffuse changes using narrow domain dSIR sequences. These dSIR changes were particularly obvious at high levels in the brain and in some cases included most of the white matter. There are at least 20 different regions of white matter, and when T1 contrast is amplified with dSIR sequences5 it is important to recognize the subtle differences in T1 between these regions.
It has long been hypothesised that MS is a diffuse neuroinflammatory disease and that only the more severe areas of disease are apparent as focal lesions when using state-of-the-art T2-weighted spin echo and T2-FLAIR sequences6. The dSIR sequence demonstrates much more extensive involvement of white matter than seen on these sequences. It is possible that this subtle disease may be amenable to treatment so that demonstrating it and recognising changes due to treatment may be an important part of monitoring therapeutic efficacy in MS7. At the present time subtle changes are excluded from internationally agreed criteria for the diagnosis of MS.
The highly T1-weighted dSIR sequences are also very sensitive to contrast enhancement with Gadolinium-based Contrast Agents (GBCAs) and this may make it possible to recognise contrast enhancement not recognised with conventional T1-weighted spin echo or IR sequences.
It is also possible to extend the TE of gradient echo sequences to make them sensitive to both T1 and T2* shortening as may be seen in the rims of MS lesions due to iron deposition.
Conclusion
Very extensive focal and diffuse changes were demonstrated in normal appearing white matter in patients with multiple sclerosis using MASDIR sequences. These sequences may also be useful for studying other neuroinflammatory diseases such as post viral syndrome, substance abuse, brain injury, and neurodegenerative diseases.Acknowledgements
JN & HB Williams Foundation and Kānoa - RDU, New Zealand. We are grateful to GE Healthcare, Mātai Ngā Māngai Māori, and to our research participants for dedicating their time toward this study.References
- Young IR, Hall AS, Pallis CA, Legg NJ, Bydder GM, Steiner RE. Nuclear magnetic resonance imaging of the brain in multiple sclerosis. Lancet 1981;2(8255):1063-66.
- Bydder GM, Young IR. MR imaging: clinical use of the inversion recovery sequence. J Comput Assist Tomogr 1985:9:659-75.
- Wattjes MP, Ciccarelli O, Reich DS, et al. 2021 MAGNIMS-CMSC-NAIMS consensus recommendations on the use of MRI in patients with multiple sclerosis. Lancet Neurol 2021;20(8):653-70.
- Ma YJ, Moazamian D, Cornfeld DM, Condron P, Holdsworth SJ, Bydder M, Du J, Bydder GM. Improving the understanding and performance of clinical MRI using tissue property filters and the central contrast theorem, MASDIR pulse sequences and synergistic contrast MRI. Quant Imaging Med Surg 2022;12(9):4658-90.
- Bullock DN, Hayday EA, Grier MD, Tany W, Pestilli F, Heilbronner. A taxonomy of the brain's white matter: twenty-one major tracts for the 21st century. Cereb Cortex 2022;32(20):4524-48.
- Paty D. New perspectives in multiple sclerosis. Can Fam Physician 1989;35:2123-25.
- Piehl F. Current and emerging disease modulatory therapies and treatment targets for multiple sclerosis. J Intern Med 2021;289(6):771–91.
Figures