0024
Hyperpolarized 13C MRSI detects immunomodulatory responses to dimethyl fumarate and fingolimod therapies in a model of multiple sclerosis1Department of Physical Therapy and Rehabilitation Science, University of California San Francisco, San Francisco, CA, United States, 2Department of Radiology and Biomedical Imaging, University of California San Francisco, San Francisco, CA, United States, 3Department of Neurology, University of California San Francisco, San Francisco, CA, United States, 4Department of Radiology, C.J. Gorter Center for High Field MRI, Leiden University Medical Center, Leiden, Netherlands
Synopsis
Keywords: Multiple Sclerosis, Hyperpolarized MR (Non-Gas)
We used hyperpolarized 13C MR spectroscopy imaging (MRSI) in a multiple sclerosis model and showed that we could monitor immune cell activation by measuring hyperpolarized [1-13C]pyruvate conversion to lactate. We further demonstrated that this approach detected response to two existing treatments, fingolimod and dimethyl fumarate. We observed a reduction of pyruvate-to-lactate flux after treatment, that can be explained by increased pyruvate dehydrogenase activity and decrease of immune cells. In addition, we evaluated brain perfusion using hyperpolarized [13C]urea, but saw no therapy effect. Altogether, we demonstrated that hyperpolarized 13C MRSI has potential to monitor immunomodulatory therapies within the central nervous system.Introduction
In recent years, the ability of conventional magnetic resonance imaging (MRI) to monitor high efficacy therapies and predict long-term disability in multiple sclerosis (MS) has been challenged1. Existing therapies to treat MS principally target the immune system as pro-inflammatory immune cells play a crucial role in MS pathophysiology2,3. Although conventional T1 contrast enhanced MRI can identify active lesions, there is currently no clinically available MRI method able to measure immune cell activity in normal appearing tissue, thus hampering direct monitoring of therapeutic response. Hyperpolarized 13C magnetic resonance spectroscopic imaging (HP 13C MRSI) has demonstrated capacity for detecting pro-inflammatory cells in vitro and in vivo4-11. Here, we investigated whether HP 13C MRSI can detect response to two immunomodulatory drugs: dimethyl fumarate (DMF) and Fingolimod (FTY720).Methods
Experimental design: C57/BL6J mice were separated in four groups: 1-Control (n=14), 2-Cuprizone and Experimental Autoimmune Encephalomyelitis12,13 (CPZ-EAE) (n=12), 3-CPZ-EAE+DMF (n=11), and 4-CPZ-EAE+FTY720 (n=14). Control received a normal chow. Groups 2-4 received CPZ diet and were MOG35-55-immunized. Group 3 received DMF and group 4 FTY720. MRI, enzymatic assays and immunofluorescence were performed at week 7 (Figure 1.a).EAE scoring: Disease severity was scored as: 0) normal, 1) decreased tail tone, 2) hind limb weakness, 3) hind limb paralysis, 4) forelimbs weakness/paraplegia.
MR acquisitions and analyses: MR acquisitions were performed on a 14.1T Agilent MR scanner. To evaluate BBB integrity, T1-weighted images were acquired five minutes post intravenous gadolinium-DTPA injection (1 mmol/kg). For 13C MRS, 24μl [1-13C]pyruvate and 55μl [13C]urea were co-polarized in a Hypersense polarizer (Oxford Instruments). 2D dynamic CSI 13C data were acquired from the beginning of the intravenous injection. 13C spectra were summed over time and HP [1-13C]pyruvate, [1-13C]lactate and [13C]urea levels were calculated as the fit integrals. MR acquisition parameters are summarized in Figure 1.b.
Immunofluorescence: Immunofluorescence analyses were performed for BBB integrity (Fibrinogen), resting/activated microglia/macrophages (Iba1), activated microglia/macrophages (CD68), T-cells (CD3), pyruvate dehydrogenase kinase 1 (PDK1), myelin (MBP), and astrocytes (GFAP).
Enzymatic assays: Pyruvate dehydrogenase (PDH) and lactate dehydrogenase (LDH) activity were measured by spectrophotometric assays.
Statistical analyses: Statistical significance was evaluated using One-Way ANOVA or Kruskall-Wallis tests. Correlations were evaluated using Pearson coefficient correlation or linear regression (*p<0.05, **p<0.01, ***p<0.001, ****p<0.0001).
Results
First, we evaluated disease severity. CPZ-EAE mice presented tail and/or limb paralysis (Figure 2.a). DMF decreased symptom severity (p<0.0001) and FTY720 prevented disease signs (p<0.0001), confirming response to both therapies.Following injection of HP [1-13C]pyruvate and [13C]urea, CPZ-EAE mice displayed an increased [1-13C]lactate production, whereas mice treated with DMF or FTY720 showed a [1-13C]lactate production comparable to control (Figure 2.b-c). HP 13C maps showed increased HP lactate/pyruvate in CPZ-EAE mice, which was partially prevented by DMF and FTY720 (Figure 2.d). Quantitative analyses revealed that DMF and FTY720 resulted in a 1.31 and 1.35 fold decrease in HP 13C lactate/pyruvate (Figure 2.e, p=0.0331 and p=0.0219, respectively), demonstrating that HP 13C lactate/pyruvate can detect the effect of immunomodulatory therapies. HP [13C]urea levels (Figure 2.f) remained unchanged likely indicating no difference in brain perfusion.
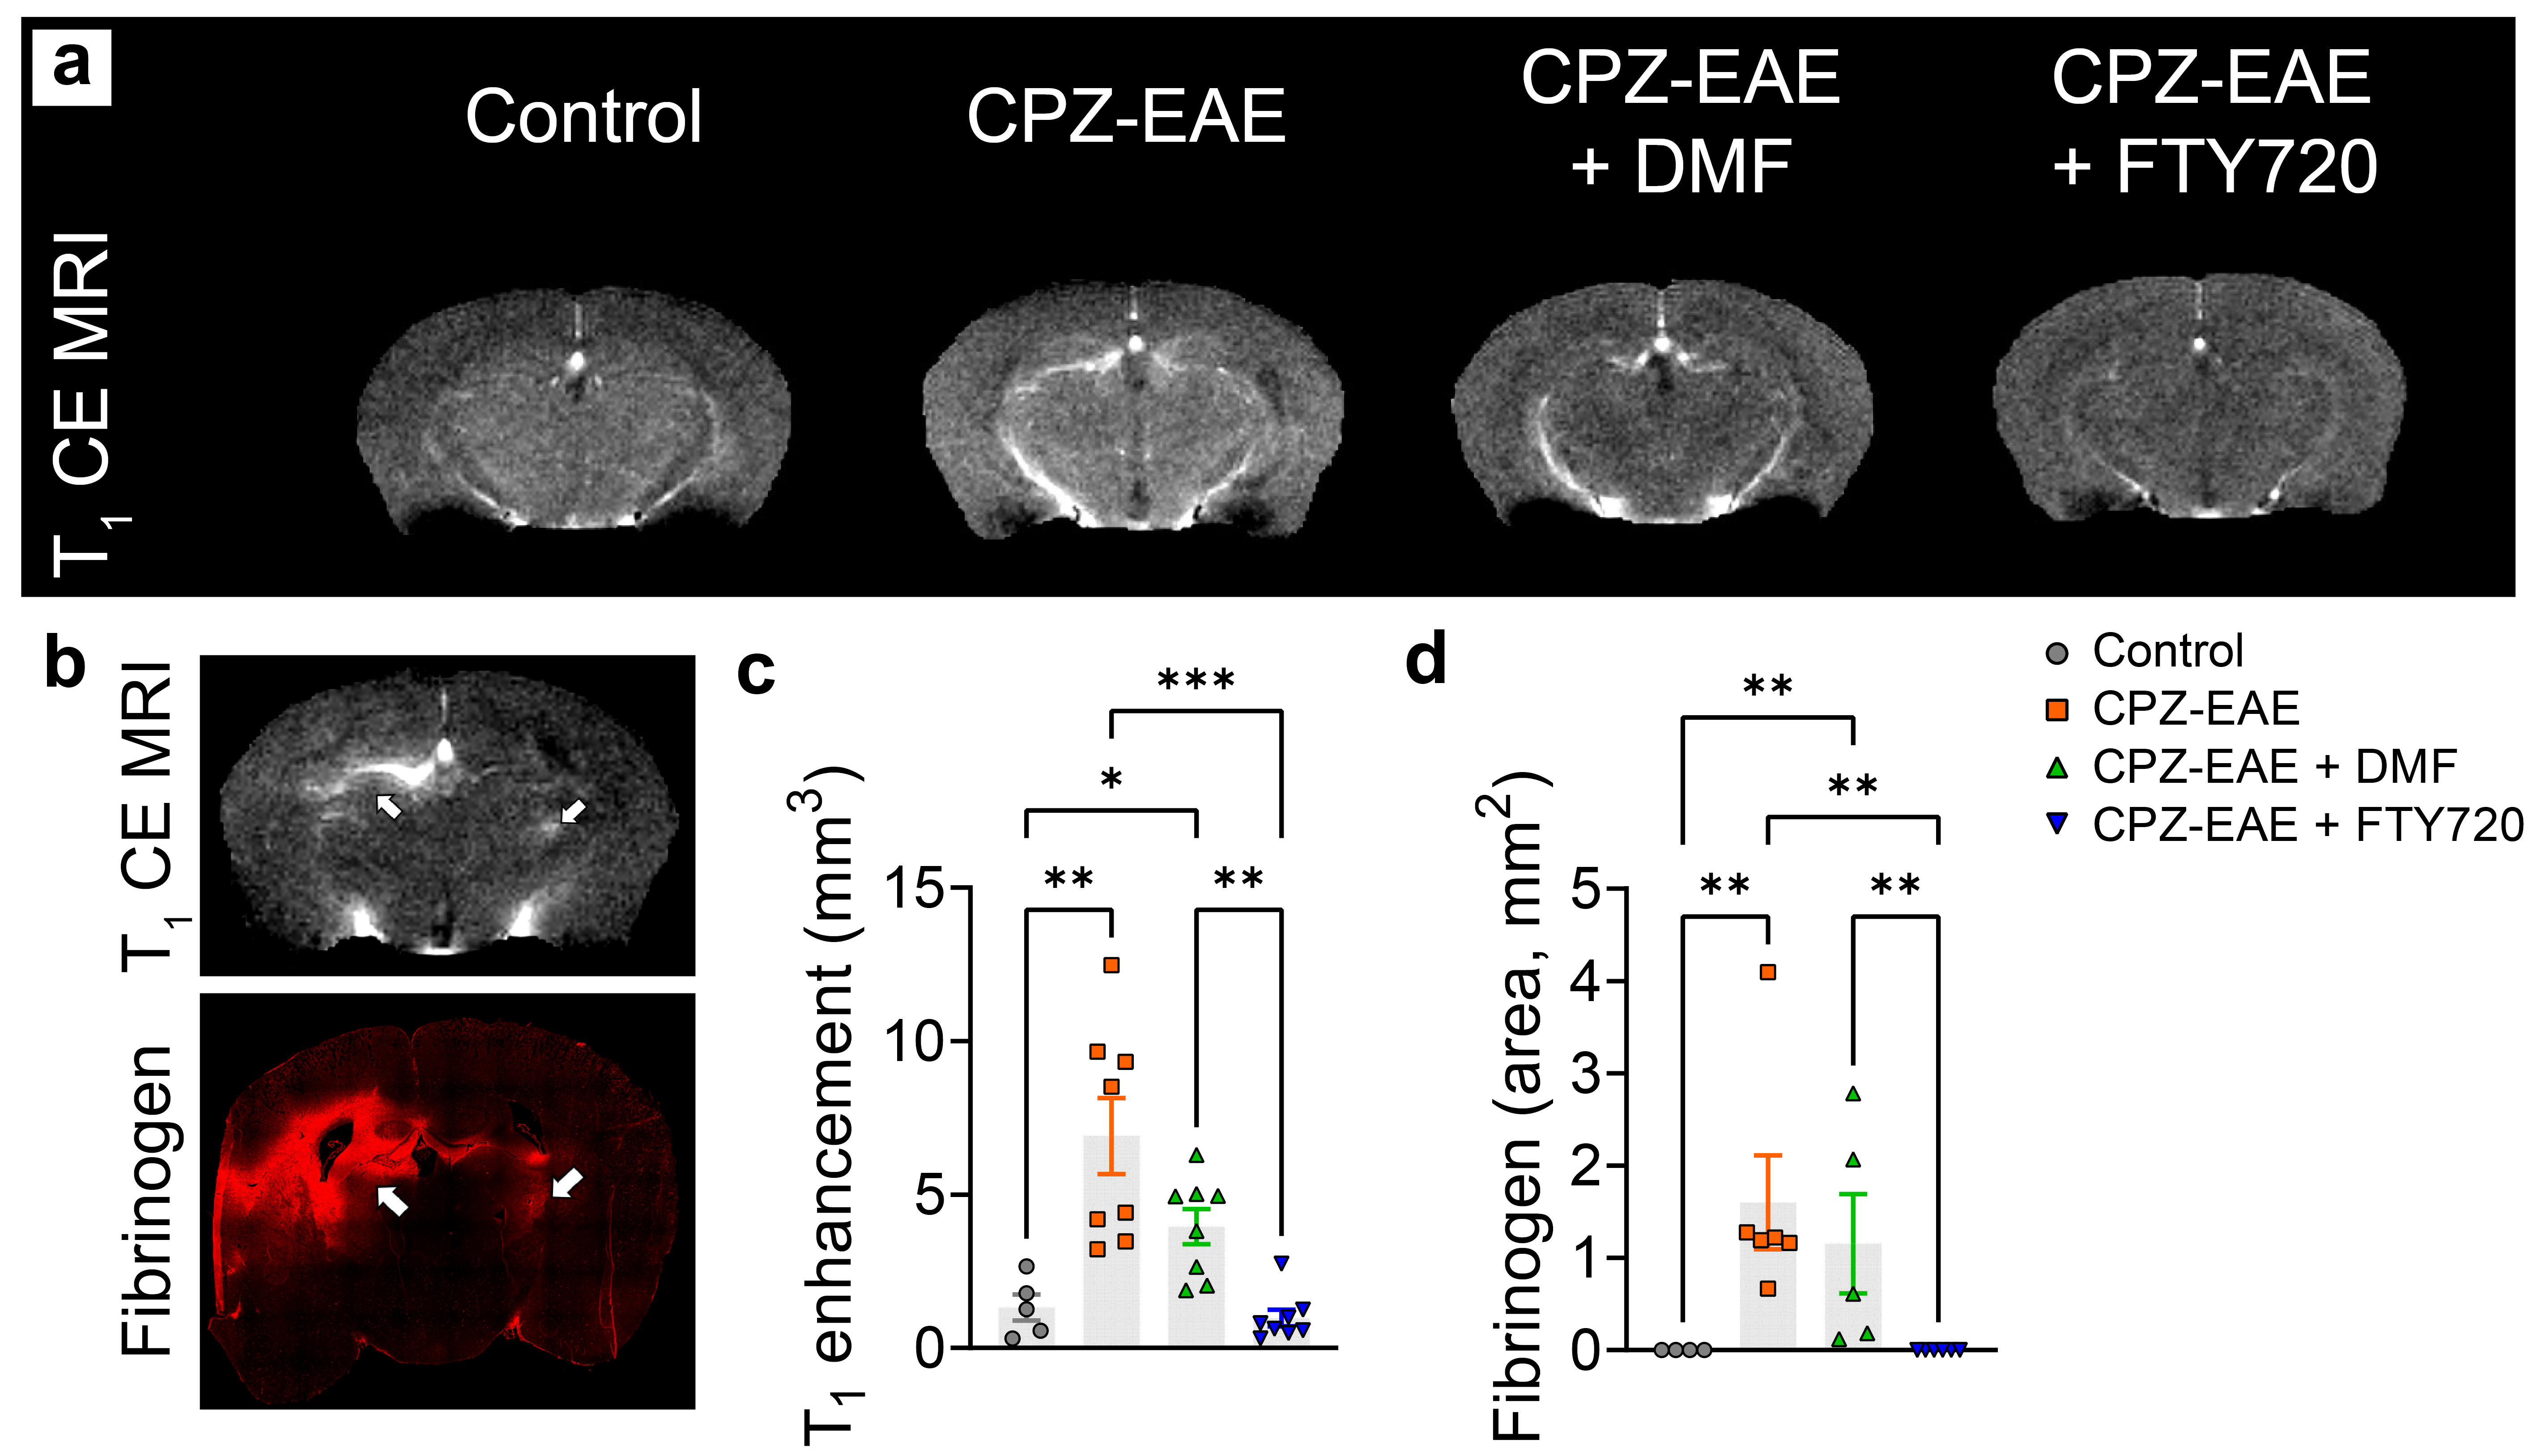
Following injection of gadolinium-DTPA, we observed hyperintense brain areas in CPZ-EAE and DMF treated mice, indicative of BBB leakiness (Figure 3.a). BBB alterations were confirmed by fibrinogen deposition, which spatially corresponded to active gadolinium enhanced MRI lesions (Figure 3.b). Quantitative analyses confirmed a 5.2 and a 3.0 fold increase in T1 enhancement volume in CPZ-EAE (p=0.0022) and following DMF (p=0.0290) as well as an increase in fibrinogen (Figure 3.c-d). No active lesion and fibrinogen deposition was seen after FTY720.
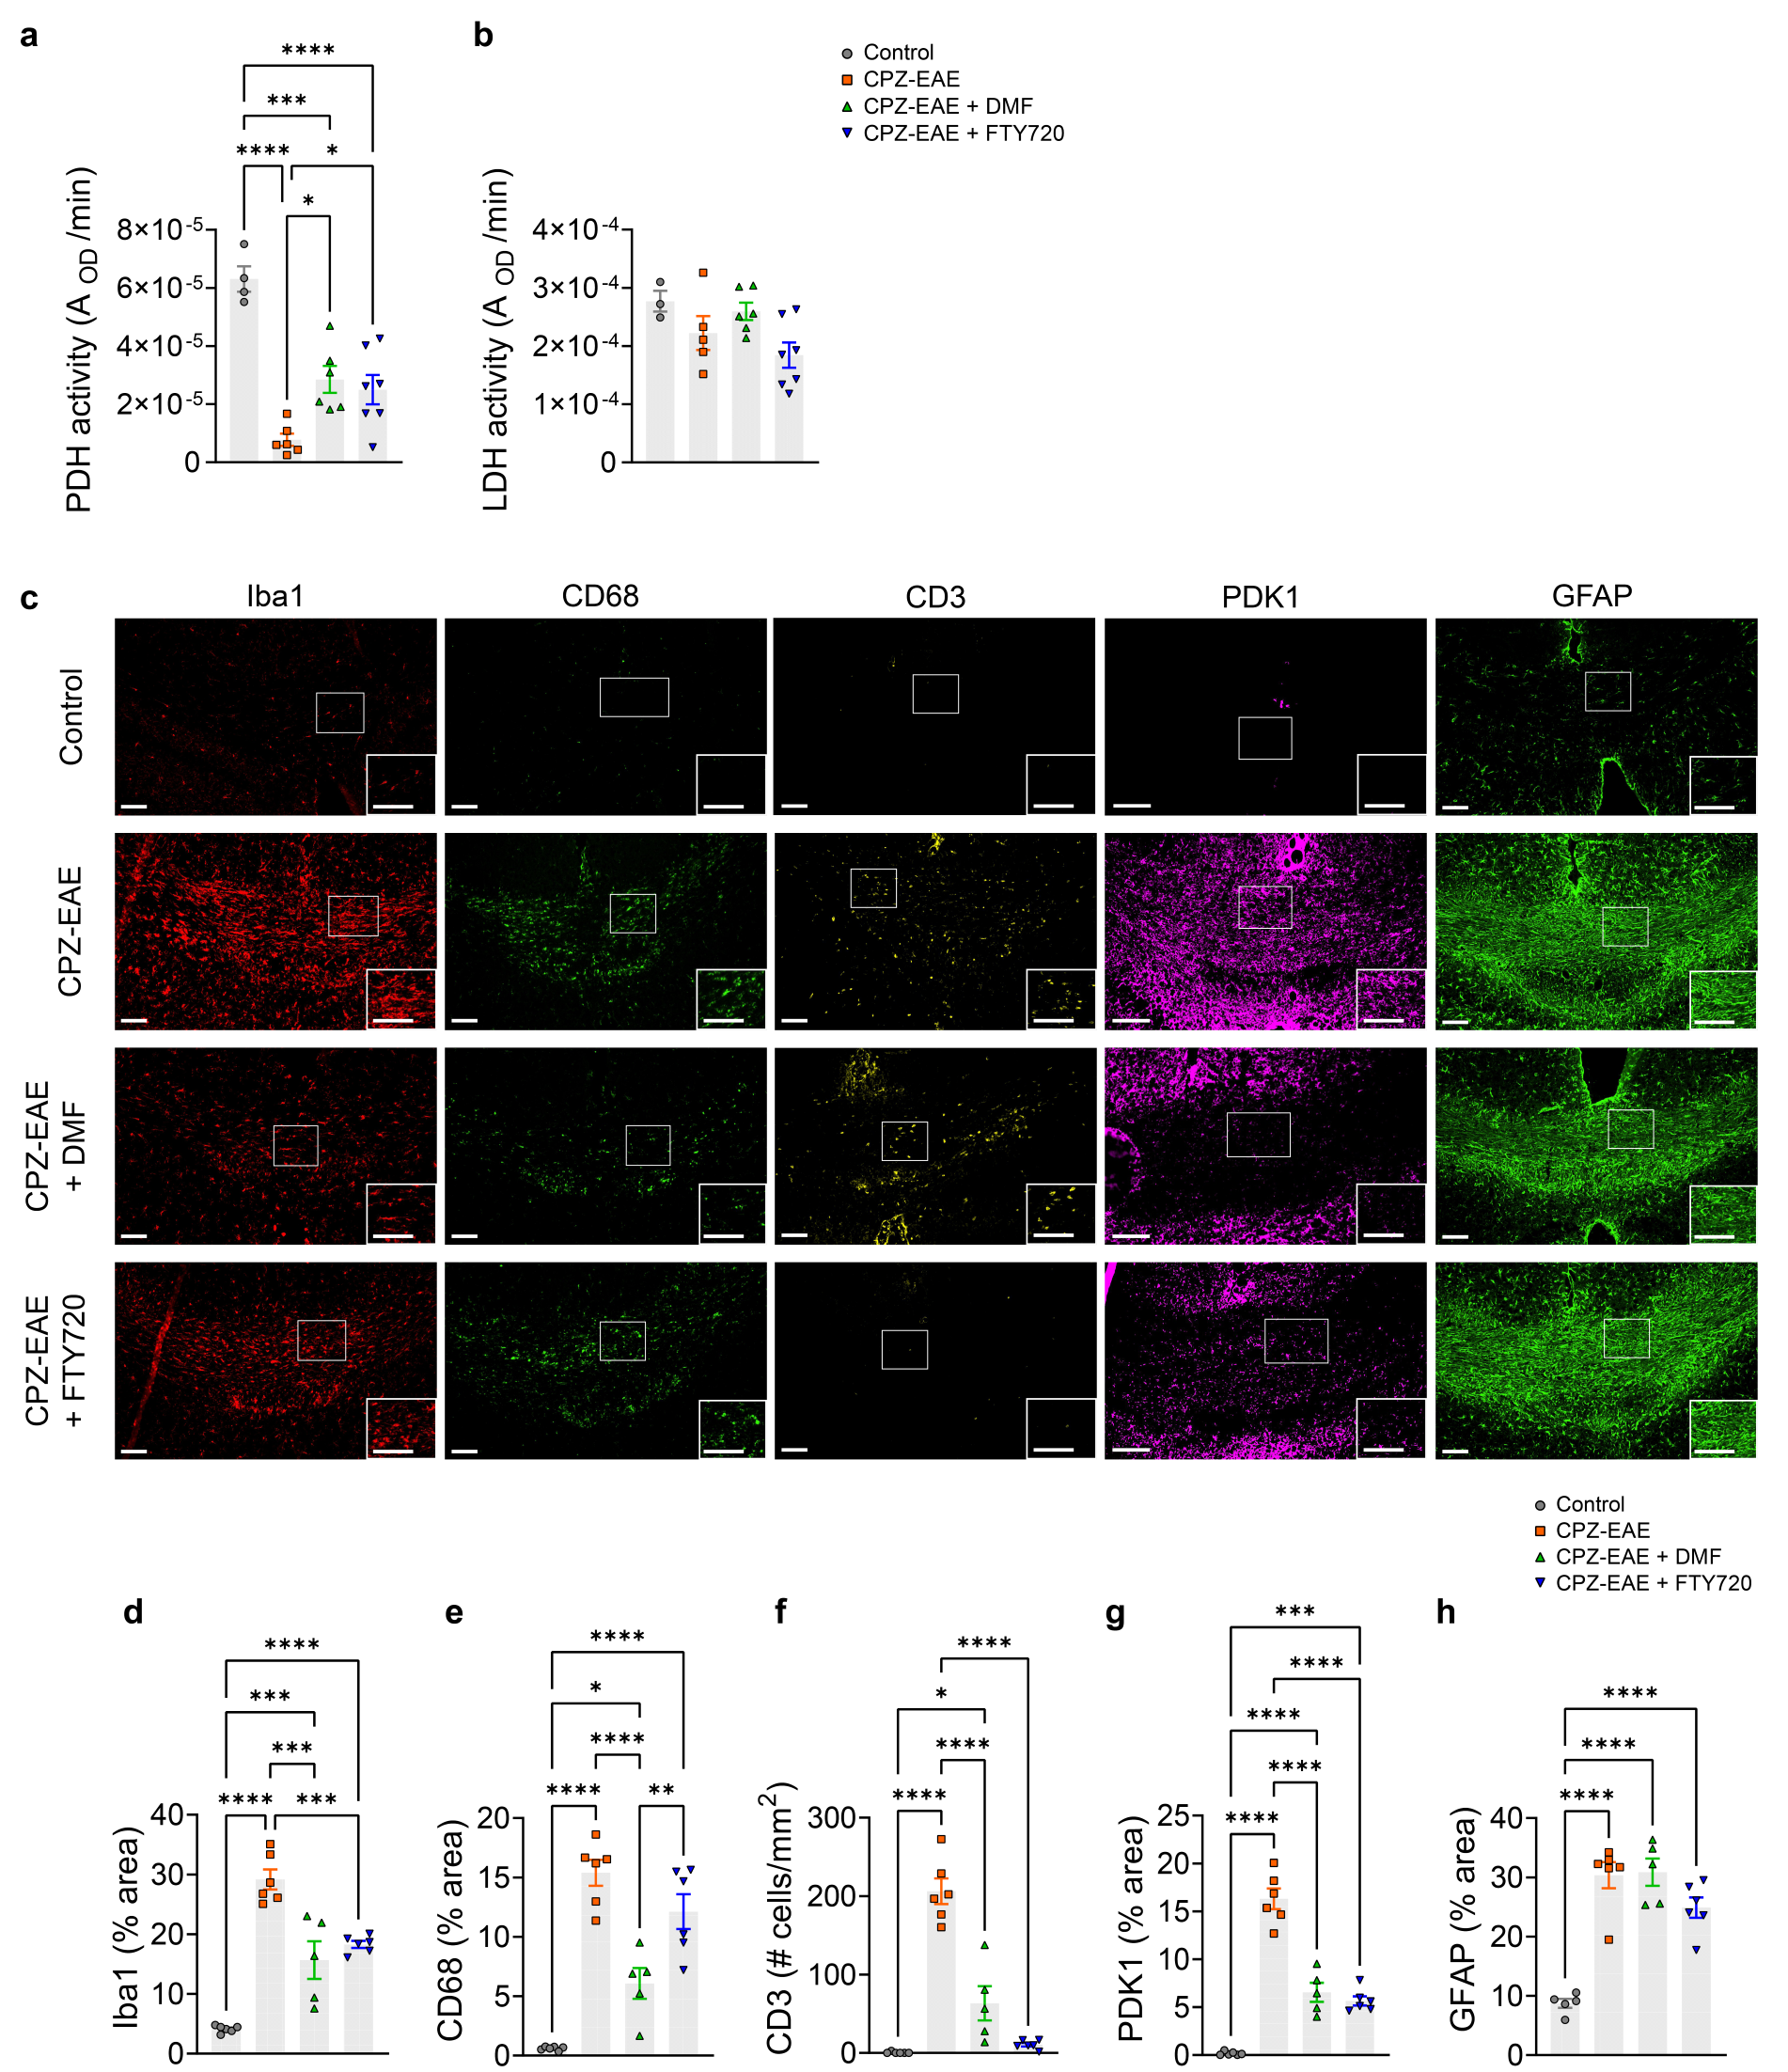
Next, we harvested the brains and measured the activity of enzymes which control the fate of pyruvate. PDH activity was strongly decreased in CPZ-EAE (Figure 4.a, p<0.0001). DMF and FTY720 partially prevented PDH decrease (p=0.0365 and p=0.0133, respectively), providing an explanation for the increased HP 13C lactate/pyruvate. LDH activity remained unchanged (Figure 4.b). Immunofluorescence detected inflammation in CPZ-EAE and confirmed DMF and FTY720 therapy responses (Figure 4.c-h). As expected, DMF induced a decrease in immune cells (Iba1+: -1.9 fold, p=0.0001; CD68+: -2.5 fold, p<0.0001; CD3+: -3.3 fold, p<0.0001). Similar effect was observed for FTY720 (Iba1+: -1.6 fold, p=0.0008; CD3+: -19.7 fold, p<0.0001). PDK1, an enzyme that inhibits PDH activity, was decreased following DMF and FTY720 (-2.5 fold, p<0.0001 and -2.9 fold, p<0.0001, respectively). Astrogliosis was not modulated by either treatment.
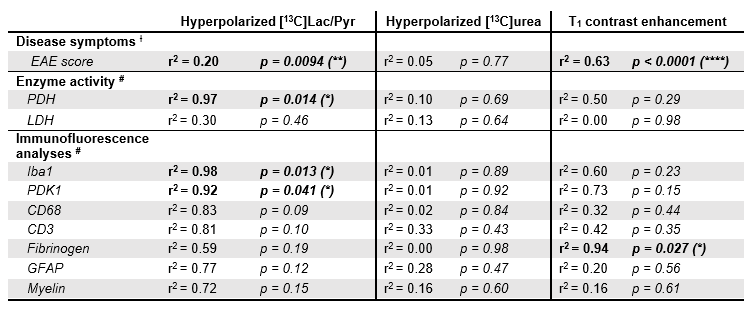
Last, we evaluated associations between MR values, disease symptoms and ex-vivo measurements (Figure 5, Table). We observed strong associations between HP 13C lactate/pyruvate and Iba1+ cells, PDH activity, PDK1+ cells and EAE scores. [13C]urea did not correlate with any of the parameters. T1 enhancement volume values correlated with fibrinogen and EAE scores.
Discussion
We showed that measurement of HP [1-13C]pyruvate flux towards lactate can monitor response to immunomodulatory therapies in a MS model, in line with altered metabolic response of immune cells following treatment. These metabolic changes were observed, both in the case of a generally intact or leaky BBB, as measured by gadolinium-enhanced MRI. Altogether, our findings highlight the added value of HP [1-13C]pyruvate for the detection of active (gadolinium positive) and inactive (gadolinium negative) inflammatory lesions and demonstrate its potential to improve the current standard of care for diagnosis and monitoring of therapies in MS patients.Acknowledgements
This work was supported by research grants: NIH R01NS102156, NIH R21AI153749, Cal-BRAIN 349087, NMSS research grant RG-1701-26630, Hilton Foundation – Marilyn Hilton Award for Innovation in MS Research #17319. Dana Foundation: The David Mahoney Neuroimaging program, NIH Hyperpolarized MRI Technology Resource Center #P41EB013598, fellowship from the NMSS (FG-1507-05297). Imaging data for this study were acquired at the Center for Advanced Light Microscopy- Nikon Imaging Center at UCSF, including the W1-CSU Confocal obtained using NIH S10 Shared Instrumentation grant (1S10OD017993-01A1).References
1. University of California, S.F.M.S.E.T., et al. Long-term evolution of multiple sclerosis disability in the treatment era. Ann Neurol 80, 499-510 (2016).
2. Reich, D.S., Lucchinetti, C.F. & Calabresi, P.A. Multiple Sclerosis. N Engl J Med 378, 169-180 (2018).
3. Lucchinetti, C.F., et al. Inflammatory cortical demyelination in early multiple sclerosis. N Engl J Med 365, 2188-2197 (2011). \
4. Thind, K., et al. Detection of radiation-induced lung injury using hyperpolarized (13)C magnetic resonance spectroscopy and imaging. Magn Reson Med 70, 601-609 (2013).
5. Josan, S., et al. Assessing inflammatory liver injury in an acute CCl4 model using dynamic 3D metabolic imaging of hyperpolarized [1-(13)C]pyruvate. NMR Biomed 28, 1671-1677 (2015).
6. MacKenzie, J.D., et al. Detection of inflammatory arthritis by using hyperpolarized 13C-pyruvate with MR imaging and spectroscopy. Radiology 259, 414-420 (2011).
7. Lewis, A.J.M., et al. Noninvasive Immunometabolic Cardiac Inflammation Imaging Using Hyperpolarized Magnetic Resonance. Circ Res 122, 1084-1093 (2018).
8. Guglielmetti, C., et al. In vivo metabolic imaging of Traumatic Brain Injury. Sci Rep 7, 17525 (2017).
9. Guglielmetti, C., et al. Hyperpolarized 13C MR metabolic imaging can detect neuroinflammation in vivo in a multiple sclerosis murine model. Proc Natl Acad Sci U S A 114, E6982-E6991 (2017).
10. Le Page, L.M., Guglielmetti, C., Najac, C.F., Tiret, B. & Chaumeil, M.M. Hyperpolarized (13) C magnetic resonance spectroscopy detects toxin-induced neuroinflammation in mice. NMR Biomed, e4164 (2019).
11. Sriram, R., et al. Molecular detection of inflammation in cell models using hyperpolarized (13)C-pyruvate. Theranostics 8, 3400-3407 (2018).
12. Scheld, M., et al. Neurodegeneration Triggers Peripheral Immune Cell Recruitment into the Forebrain. J Neurosci 36, 1410-1415 (2016).
13. Ruther, B.J., et al. Combination of cuprizone and experimental autoimmune encephalomyelitis to study inflammatory brain lesion formation and progression. Glia 65, 1900-1913 (2017).
Figures
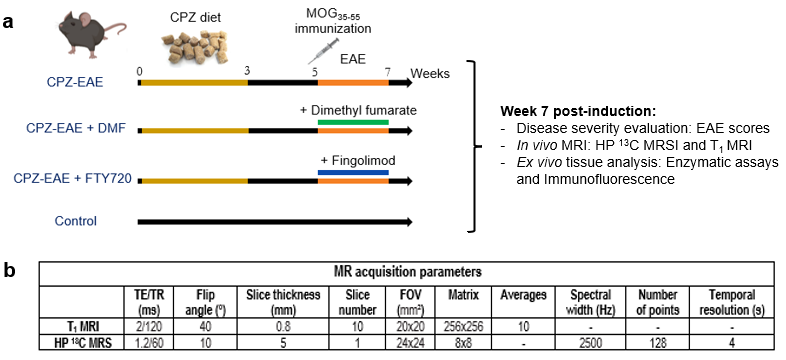
(a) Experimental design shown for the four groups of mice: 1-Control, 2-CPZ-EAE, 3-CPZ-EAE+DMF, and 4-CPZ-EAE+FTY720. Control received a normal chow. Groups 2-4 received CPZ diet (0.25%) for three weeks (W0-W3) and were MOG35-55-immunized at W5. Group 3 received DMF treatment (100 mg/kg/day) and group 4 received FTY720 (0.3 mg/kg/day) for two weeks (W5-W7). EAE scores, MRI, enzymatic assays and immunofluorescence were performed at W7. (b) Table summarizes the MR acquisitions parameters for T1 MRI and HP 13C MRSI.
(a) DMF treatment decreased disease severity and FTY720 prevented disease symptoms. (b) 13C spectra from a CPZ-EAE mouse brain (red voxel), after iv co-injection of HP [1-13C]pyruvate and [13C]urea. (c) Summed 13C spectra show increased [1-13C]lactate peak intensity in CPZ-EAE. (d) 13C lactate/pyruvate and [13C]urea color maps show widespread increase of 13C lactate/pyruvate in CPZ-EAE and partial decrease in DMF and FTY720 treated mice. (e) Quantitative analyses show lower 13C lactate/pyruvate following DMF and FTY720 treatments. (f) [13C]urea was unchanged between groups.