0023
Spatial variations of 31P metabolites within the liver measured with 3D 31P MRSI at 7T1Center for Image Sciences, University Medical Center Utrecht, Utrecht, Netherlands
Synopsis
Keywords: Liver, Spectroscopy
31P MRS can be used in liver disease diagnosis and treatment monitoring. However, it is unclear whether 31P metabolite concentrations differ across the healthy liver, which would be important to take into account. Using an integrated 31P whole-body transmit coil for a 7T MRI scanner in combination with a 16-channel body receive array, we aimed to assess spatial variations of 31P metabolites within the liver in healthy subjects. We showed that there is significant spatial heterogeneity of various 31P metabolites levels within the liver, with marked differences for the PME and PDE metabolites between the left and right lobe.Introduction
Phosphorus magnetic resonance spectroscopy (31P MRS) is a non-invasive technique allowing assessment of hepatic energy metabolism and membrane turnover1, which could potentially be used in liver disease diagnosis and treatment monitoring2–5. However, it is unclear whether 31P metabolite concentrations differ across the healthy liver, which is important to take into account when assessing (the progression of) liver disease and monitoring therapy response with 31P MRS. Using an integrated 31P whole-body transmit coil for a 7T MRI scanner6 in combination with a 16-channel body receive array, 31P signals can be measured throughout the torso and abdomen with increased sensitivity. The aim of this study was to assess spatial variations of 31P metabolites within the liver in healthy subjects, using this setup.Methods
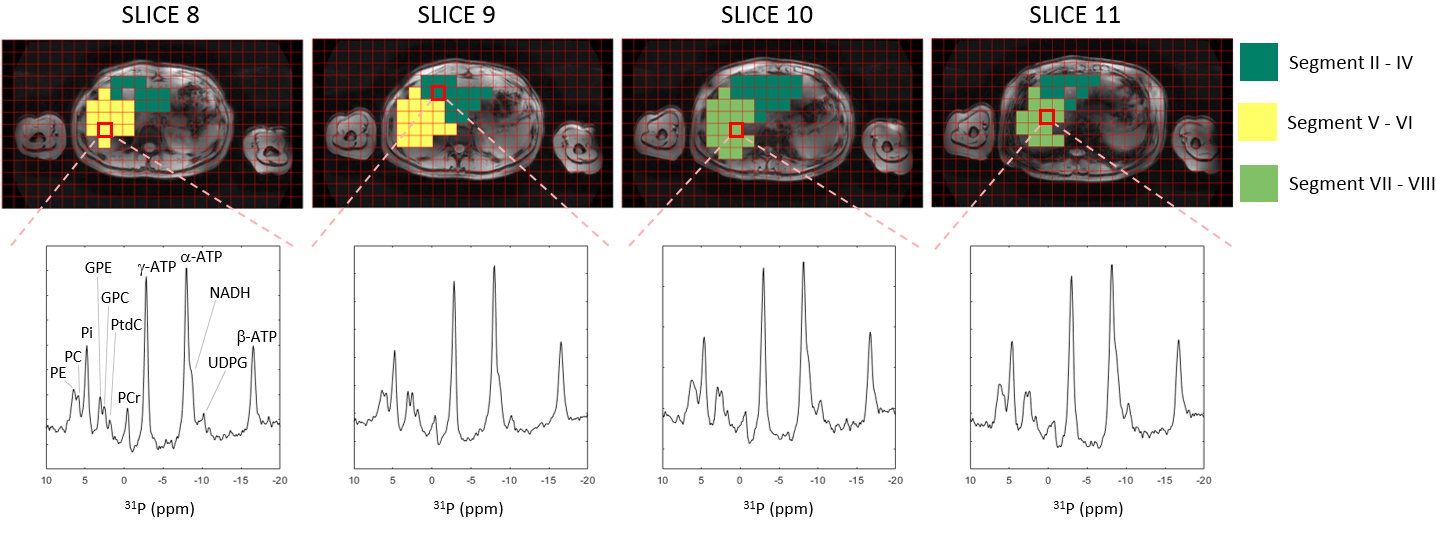
Ten healthy volunteers (four females and six males, age 34±12 (range: 25-62) years, BMI 24±4.0kg/m2) were scanned in a supine position using a whole-body 7T MR system (Philips Healthcare, Best, NL) with an in-house designed 31P whole-body birdcage transmit coil (diameter 60cm, 120.6MHz6). 31P signals were received with a local body array, containing 16 31P loop coils integrated with 8 fractionated 1H dipole antennas7,8. Subjects were scanned twice on the same day. Image-based B0 shimming was performed and transversal and coronal T1-weighted images were acquired. 31P spectra were acquired with a 3D MRSI sequence with Hamming weighted k-space sampling without respiratory gating, using a block pulse for excitation (carrier frequency set to phosphocreatine, B1=6μT, duration=0.33ms for 12° flip angle). The following parameters were used: FOV=500(LR)×280(AP)×360(FH)mm3, nominal resolution=20mm isotropic, TR=60ms, acquisition delay=0.56ms, BW=5000Hz, NSA=20, acquisition time=22:37min. A liver mask was manually drawn on the transversal T1-weighted images. 31P MRSI data were reconstructed in Matlab and metabolites were fitted with AMARES9 using OXSA10,11. PCA-based denoising12 was applied before Roemer channel combination13. Twelve metabolite signals were fitted with Lorentzian line shapes with equal line widths, with soft constraints for the chemical shifts and fixed J-couplings for the ATP doublets and triplets. For visualisation of the spatial distribution of metabolite levels within the liver, metabolite maps were created based on the liver masks. For further quantitative analysis of spatial variations of 31P metabolites, only voxels in the liver mask with a fitted PCr or PtdC amplitude smaller than the α-ATP amplitude (to filter out muscle- and gall bladder-contaminated voxels) were taken into account and this filtered liver mask was divided into three (non-overlapping) volumes of interest (VOI) based on the Couinaud classification of hepatic segments14: (1) segment II-IV, (2) segment V-VI, and (3) segment VII-VIII. Segments II-IV correspond to the left lobe of the liver and the right lobe is composed of segments V-VIII. Fitted metabolite signal amplitudes were expressed as percentage of the sum of all fitted signals and were averaged over all voxels within each segment-based VOI. Two-way ANOVA for repeated measures with Bonferroni post-hoc analyses was performed to assess significant differences between the scans and segment-based VOI’s.Results
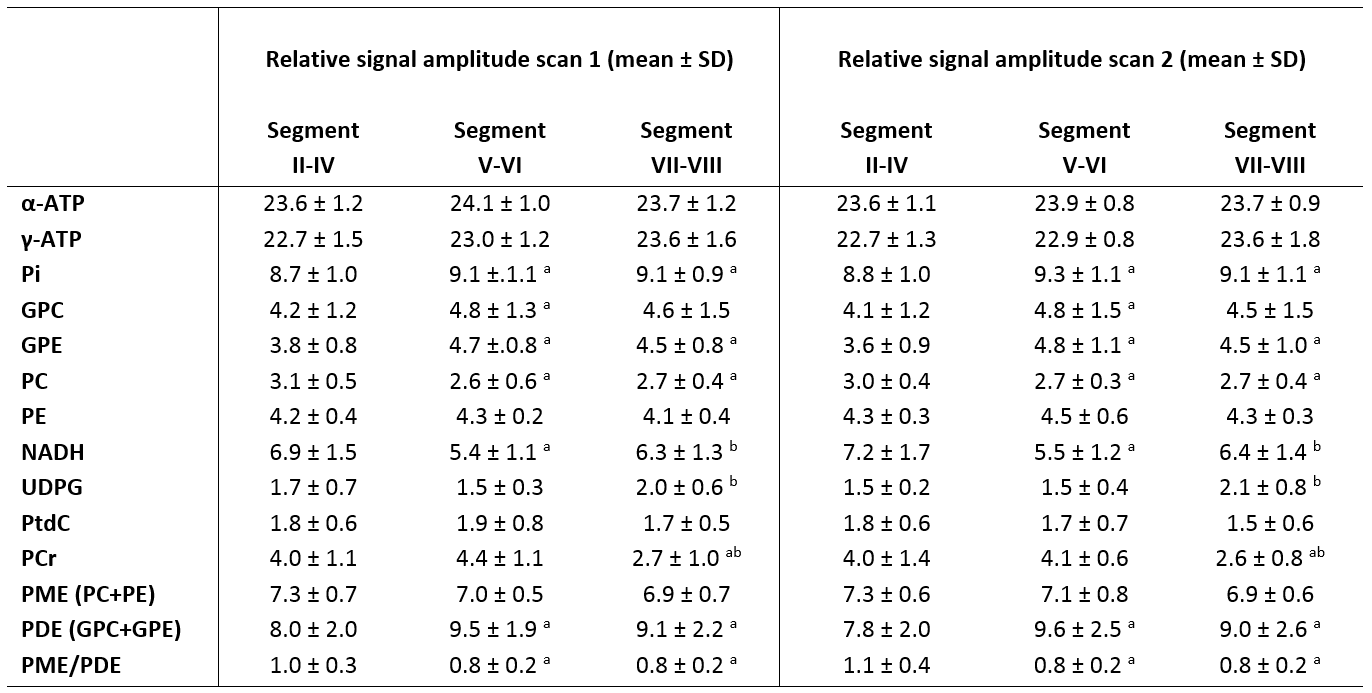
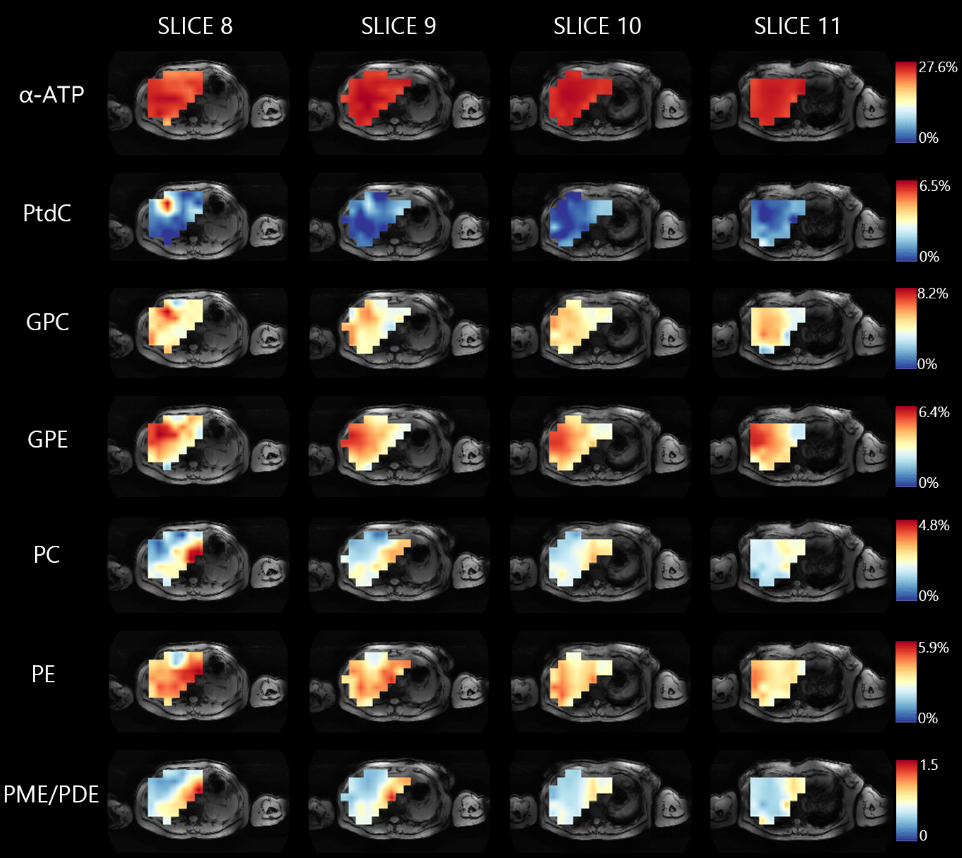
Figure 1 shows four slices of a transversal T1-weighted MRI overlaid with the 31P MRSI grid and the masks for the different liver segment-based VOI’s, including 31P MR spectra in each slice. For all volunteers, on average 28±15 and 28±11 voxels were included in the mask for segment II-IV for scan 1 and scan 2, respectively, 34±15 and 30±11 voxels for segment V-VI, and 37±20 and 42±14 voxels for segment VII-VIII. Mean quantified metabolite levels were significantly different among the segment-based VOI’s for Pi, GPC, GPE, PC, NADH, UDPG, and PCr, all independent of the scan session (Figure 2). GPC was lower in segment II-IV compared to segment V-VI, and GPE was lower and PC was higher in segment II-IV compared to segments V-VI and VII-VIII, resulting in a lower PDE and higher PME/PDE in the left lobe (segments II-IV) compared to the right lobe (segments V-VIII). Figure 3 shows liver metabolite maps for 4 consecutive transversal slices in one subject. Whereas the α-ATP level is rather homogeneous throughout the liver, for PtdC a clear hotspot is observed in the most inferior slice, corresponding with the location of the gall bladder. For the GPE and PC levels, and the PME/PDE ratio, clear differences between the right and left liver lobes can be observed.Discussion and conclusion
For various 31P metabolites, we observed spatial heterogeneity within the liver, which was consistent between repeated scans. Most significant differences in 31P metabolite levels were found for the PMEs and PDEs between the left lobe and right lobe of the liver. Interestingly, in 1H MRI studies it has been shown that also the proton density fat fraction varies over the liver and that it is significantly higher in the right lobe than in the left lobe in subjects with NAFLD, obesity, or a high risk of developing type 2 diabetes, which was speculatively associated with differences in perfusion of and/or different contributions of mesenteric versus splenic blood supply to the right and left liver lobe15–17. The observed spatial differences in 31P metabolites across the liver will be important to take into account when assessing (the progression of) liver disease and monitoring therapy response with 31P MRS.Acknowledgements
H2020-FETopen:NICIReferences
1. Liu Y, Gu Y, Yu X. Assessing tissue metabolism by phosphorous-31 magnetic resonance spectroscopy and imaging: a methodology review. Quant Imaging Med Surg. 2017;7(6):707-726.
2. Panda A, Jones S, Stark H, et al. Phosphorus liver MRSI at 3 T using a novel dual-tuned eight-channel 31P/1H coil. Magn Reson Med. 2012;68(5):1346-1356. doi:10.1002/mrm.24164
3. Brinkmann G, Melchert UH. A study of T1-weighted 31Phosphorus MR-spectroscopy from patients with focal and diffuse liver disease. Magn Reson Imaging. 1992;10:949-956.
4. Cox IJ, Menon DK, Sargetoni J, et al. Phosphorus-31 magnetic resonance spectroscopy of the human liver using chemical shift imaging techniques. J Hepatol. 1992;14:265-275.
5. Rivera D, Kalleveen I, de Castro CA, et al. Inherently decoupled 1H antennas and 31P loops for metabolic imaging of liver metastasis at 7 T. NMR Biomed. 2020;33(4):1-10. doi:10.1002/nbm.4221
6. Löring J, van der Kemp WJM, Almujayyaz S, van Oorschot JWM, Luijten PR, Klomp DWJ. Whole-body radiofrequency coil for 31P MRSI at 7T. NMR Biomed. 2016;29(6):709-720. doi:10.1002/nbm.3517
7. Raaijmakers AJE, Italiaander M, Voogt IJ, et al. The fractionated dipole antenna: A new antenna for body imaging at 7 Tesla. Magn Reson Med. 2016;75(3):1366-1374. doi:10.1002/mrm.25596
8. van Houtum Q, Mohamed Hoesein FAA, Verhoeff JJC, et al. Feasibility of 31P spectroscopic imaging at 7 T in lung carcinoma patients. NMR Biomed. 2019;(May 2019):1-8. doi:10.1002/nbm.4204
9. Vanhamme L, Van Den Boogaart A, Van Huffel S. Improved Method for Accurate and Efficient Quantification of MRS Data with Use of Prior Knowledge. J Magn Reson. 1997;129(1):35-43. doi:10.1006/jmre.1997.1244
10. Purvis LAB, Clarke WT, Biasiolli L, Robson MD, Rodgers CT. Line-width constraints in Matlab AMARES using pre-Metabolite T2 and per-Voxel Delta B0. In: In Proceedings of the 22nd Annual Meeting of ISMRM. ; :2885.
11. Purvis LAB, Clarke WT, Biasiolli L, Valkovic L, Robson MD, Rodgers CT. OXSA: An open-source magnetic resonance spectroscopy analysis toolbox in MATLAB. PLoS One. 2017;12(9).
12. Veraart J, Novikov DS, Christiaens D, Ades-aron B, Sijbers J, Fieremans E. Denoising of diffusion MRI using random matrix theory. Neuroimage. 2016;142:394-406. doi:10.1016/j.neuroimage.2016.08.016
13. Roemer PB, Edelstein WA, Hayes CE, Souza SP, Mueller OM. The NMR Phased Array. Magn Reson Med. 1990;16:192-225.
14. Vauthey JN, Zimmitti G, Shindoh J. From Couinaud to molecular biology: The seven virtues of hepato-pancreato-biliary surgery. Hpb. 2012;14(8):493-499. doi:10.1111/j.1477-2574.2012.00502.x
15. Bonekamp S, Tang A, Mashhood A, et al. Spatial distribution of MRI‐determined hepatic proton density fat fraction. J Magn Reson Imaging. 2014;39:1525-1532.
16. Fazeli Dehkordy S, Fowler KJ, Mamidipalli A, et al. Hepatic steatosis and reduction in steatosis following bariatric weight loss surgery differs between segments and lobes. Eur Radiol. 2019;29(5):2474-2480. doi:10.1007/s00330-018-5894-0
17. Syväri J, Junker D, Patzelt L, et al. Longitudinal changes on liver proton density fat fraction differ between liver segments. Quant Imaging Med Surg. 2021;11(5):1701-1709. doi:10.21037/qims-20-873
Figures