0017
Exploring glucose metabolic impairment in Alzheimer’s Disease with DMI using [6,6′-2H2]-D-glucose and [2,2’-2H2]-deoxy-D-glucose at 14.1T1Physical Therapy, UCSF, San Francisco, CA, United States, 2UCSF, San Francisco, CA, United States
Synopsis
Keywords: Deuterium, Alzheimer's Disease
We performed a deuterium metabolic imaging (DMI) investigation of two deuterated probes with different metabolic properties: 1) the glucose analog [2,2’-2H2]-deoxy-D-glucose ([2H2]2DG) which gets intracellularly trapped after being phosphorylated by hexokinase; and 2) [6,6′-2H2]-D-glucose ([2H2]Glc) which undergoes full oxidative catabolism. We tested their potential to detect metabolic impairment in a mouse model of Alzheimer’s disease. Our results demonstrated that the accumulation / metabolism of these two glucose derivatives can be detected dynamically in the mouse brain, and that DMI can detect disrupted glucose metabolism in an AD model.
Introduction
Alzheimer’s disease (AD) is the most common dementia-causing neurodegenerative disorder amongst the elderly. Neuropathology in AD can begin as early as two decades before clinical symptoms appear 1. There are currently a limited number of methods to assess the initiation and progression of AD, hindering patient-specific prediction of outcomes and personalized treatment choices.Metabolism of glucose, the key source of energy for the brain, is defective in AD1. Abnormal processing of glucose likely results from multiple pathways, including glycolysis, TCA cycle and ATP synthesis2. Glucose metabolism in AD has been heavily studied by [18F]FDG positron emission tomography (PET)3, 4, 5 with extensive data showing decreased [18F]FDG uptake in AD brains 6, 7, 8. However, while [18F]FDG-PET detects the transport and trapping of 2-deoxy-D-glucose, this method does not directly reflect cerebral glycolysis, or downstream metabolic events. Furthermore, [18F]FDG-PET uses ionizing radiation, potentially limiting its repeated use.
Here, we used Deuterium Metabolic Imaging (DMI), a non-ionizing neuroimaging strategy, to evaluate two 2H-labeled glucose derivatives with distinct metabolic properties: 1) the glucose analog [2,2’-2H2]-deoxy-D-glucose ([2H2]2DG) which gets intracellularly trapped after being phosphorylated by hexokinase; and 2) [6,6′-2H2]-D-glucose ([2H2]Glc) which undergoes full oxidative catabolism through glycolysis and TCA cycle (Figure 1). Our results suggest that both probes have the potential to detect glucose metabolic impairment in an AD murine model.
Material & Methods
Animals & MR system: Wild-type(WT) mice and hAPP-J20 mice (murine model of AD9, 10) (n=3 per group, female only, age-matched, 14-months-old) were imaged under 1.3-1.8% isoflurane on a 14.1Tesla Agilent® system using a 1H Agilent® volume coil (inner diameter 40mm) and a 2H Doty Scientific® surface coil (diameter 16mm).Infusion protocol: [2H2]2DG and [6,6’-2H2]Glc were purchased from Sigma-Aldrich® ISOTEC. 220 μL of the 2H probe solution (solution of 22mg diluted in 0.9% Sodium Chloride saline with 10% mass concentration, [2H2]2DG (166.2g/mol)=0.602M, [6,6’-2H2]Glc (182.2g/mol)=0.548M) was injected through the tail vein catheter as follows: (1) bolus: 2mg/min for 5min and (2) infusion: 0.8mg/min for 15min using a remote programmable syringe pump (Harvard Apparatus). Dose and infusion rates were optimized from literature values11.
DMI Acquisition: Longitudinal 2D CSI data were acquired at baseline (prior the start of infusion. CSI_0), then at 5 min (CSI_1) and 25 min (CSI_2) post start of infusion to quantify the dynamic changes in the levels of intracerebral 2H metabolites. The CSI parameters were 300ms TR, 90° flip angle, 1.7kHz SW, 30x30 mm FOV, 8x8 matrix, 8mm slice thickness, 32 averages, 20 min scan time. Note that each animal received each in separate imaging sessions (>24h delay).
Processing: 2D CSI data were quantified using Mestrenova. The area-under-the-curve (AUC) of HDO, 2DG, lactate, glutamate/glutamine (Glx) and glucose (Glc) were calculated for each time points. For CSI_1 and CSI_2, all metabolites’ levels were normalized to HDO levels at baseline. Unpaired t-test was used to compare J20 and WT animals (*p=0.05).
Results & Discussion
The CSI grid used for DMI acquisition is shown in Figure 2A. Post injection of [2H2]2DG, the resonances of HDO and [2H2]2DG could clearly be detected, confirming delivery and trapping (Figure 2B). Post injection of [6,6’-2H2]glucose, the resonances of HDO, Glucose, lactate and Glx could be seen, confirming metabolism (Figure 2C).All 2D CSI results are reported in Figure 3. DMI indicated a trend towards impaired [2H2]2DG uptake in the AD mouse brain, which was more apparent at later time point, although not reaching significance with this small number of animals (p = 0.25 @ CSI_1; p = 0.19 @ CSI_2). Meanwhile, the [2H2]Glc DMI study revealed a decreased production of lactate in J20 mice, which reached significance at CSI_2 (*p = 0.05), whereas the Lac/Glc ratio was similar between J20 and WT brains at both time points (p = 0.92 @ CSI_1; p = 0.61 @ CSI_1). This data suggest that decreased lactate production could be partially explained by a general impaired glucose uptake in AD brain, as demonstrated in the earlier [2H2]2DG DMI results.
However, J20 mouse brains also showed a decreased Glx production that cannot be merely explained by decreased glucose uptake, as suggested by the elevated Lac/Glx ratio (p = 0.2 @ CSI_1). Such an altered coupling between brain glycolysis and Glx production was neither obvious at the later time point (p = 0.65), nor captured by merely referring to Glx/Glc ratio (p = 0.47 @ CSI_1; p = 0.93 @ CSI_2).
Conclusions & Perspectives
In this pilot study, we performed a parallel investigation of two deuterated probes with different metabolic properties, and tested their potential to detect metabolic impairment in AD. For both 2H-labeled glucose derivatives, we demonstrated that their accumulation/metabolism can be detected dynamically in the mouse brain, and that DMI can detect disrupted AD glucose metabolism from specific aspects, including 1) glucose uptake, 2) lactate production, 3) glycolysis-Glx production coupling. A large fully powered study is underway to confirm these findings. Considering the crucial role of impaired glucose metabolism in AD, we hope an expanded DMI research of deuterated glucose can provide highly specific, reproducible and quantifiable biomarkers of cerebral metabolism, which would in turn lead to more comprehensive disease characterization and phenotyping.Acknowledgements
This work was supported by research grant R21Al164684 (NIAID).References
1. Martins, R. N. et al. Alzheimer’s disease: a journey from amyloid peptides and oxidative stress, to biomarker technologies and disease prevention strategies—gains from AIBL and DIAN cohort studies. J. Alzheimers Dis. 62, 965–992 (2018).
2. Butterfield, D.A., Halliwell, B. Oxidative stress, dysfunctional glucose metabolism and Alzheimer disease. Nat Rev Neurosci 20, 148–160 (2019). https://doi.org/10.1038/s41583-019-0132-6
3. Kuehn, B. M. In alzheimer research, glucose metabolism moves to center stage. JAMA 323, 297–299 (2020).
4. Bosco, D., Fava, A., Plastino, M., Montalcini, T. & Pujia, A. Possible implications of insulin resistance and glucose metabolism in Alzheimer’s disease pathogenesis. J. Cell Mol. Med. 15, 1807–1821 (2011).
5. Gudala, K., Bansal, D., Schifano, F. & Bhansali, A. Diabetes mellitus and risk of dementia: A meta-analysis of prospective observational studies. J. Diabetes Investig. 4, 640–650 (2013).
6. Rice, L. & Bisdas, S. The diagnostic value of FDG and amyloid PET in Alzheimer’s disease-A systematic review. Eur. J. Radiol. 94, 16–24 (2017).
7. Chételat, G. et al. Amyloid-PET and 18F-FDG-PET in the diagnostic investigation of Alzheimer’s disease and other dementias. Lancet Neurol. 19, 951–962 (2020).
8. Ou, Y.-N. et al. FDG-PET as an independent biomarker for Alzheimer’s biological diagnosis: a longitudinal study. Alzheimers Res. Ther. 11, 57 (2019).
9. Sasaguri, H. et al. APP mouse models for Alzheimer’s disease preclinical studies. EMBOJ. 36, 2473–2487 (2017).
10. Wright, A. L. et al. Neuroinflammation and neuronal loss precede Aβ plaque deposition in the hAPP-J20 mouse model of Alzheimer’s disease. PLoS One 8, e59586 (2013).
11. Pfeuffer, J. et al. Localized in vivo 1H NMR detection of neurotransmitter labeling in rat brain during infusion of [1-13C] D-glucose. Magn. Reson. Med. 41, 1077–1083 (1999).
Figures
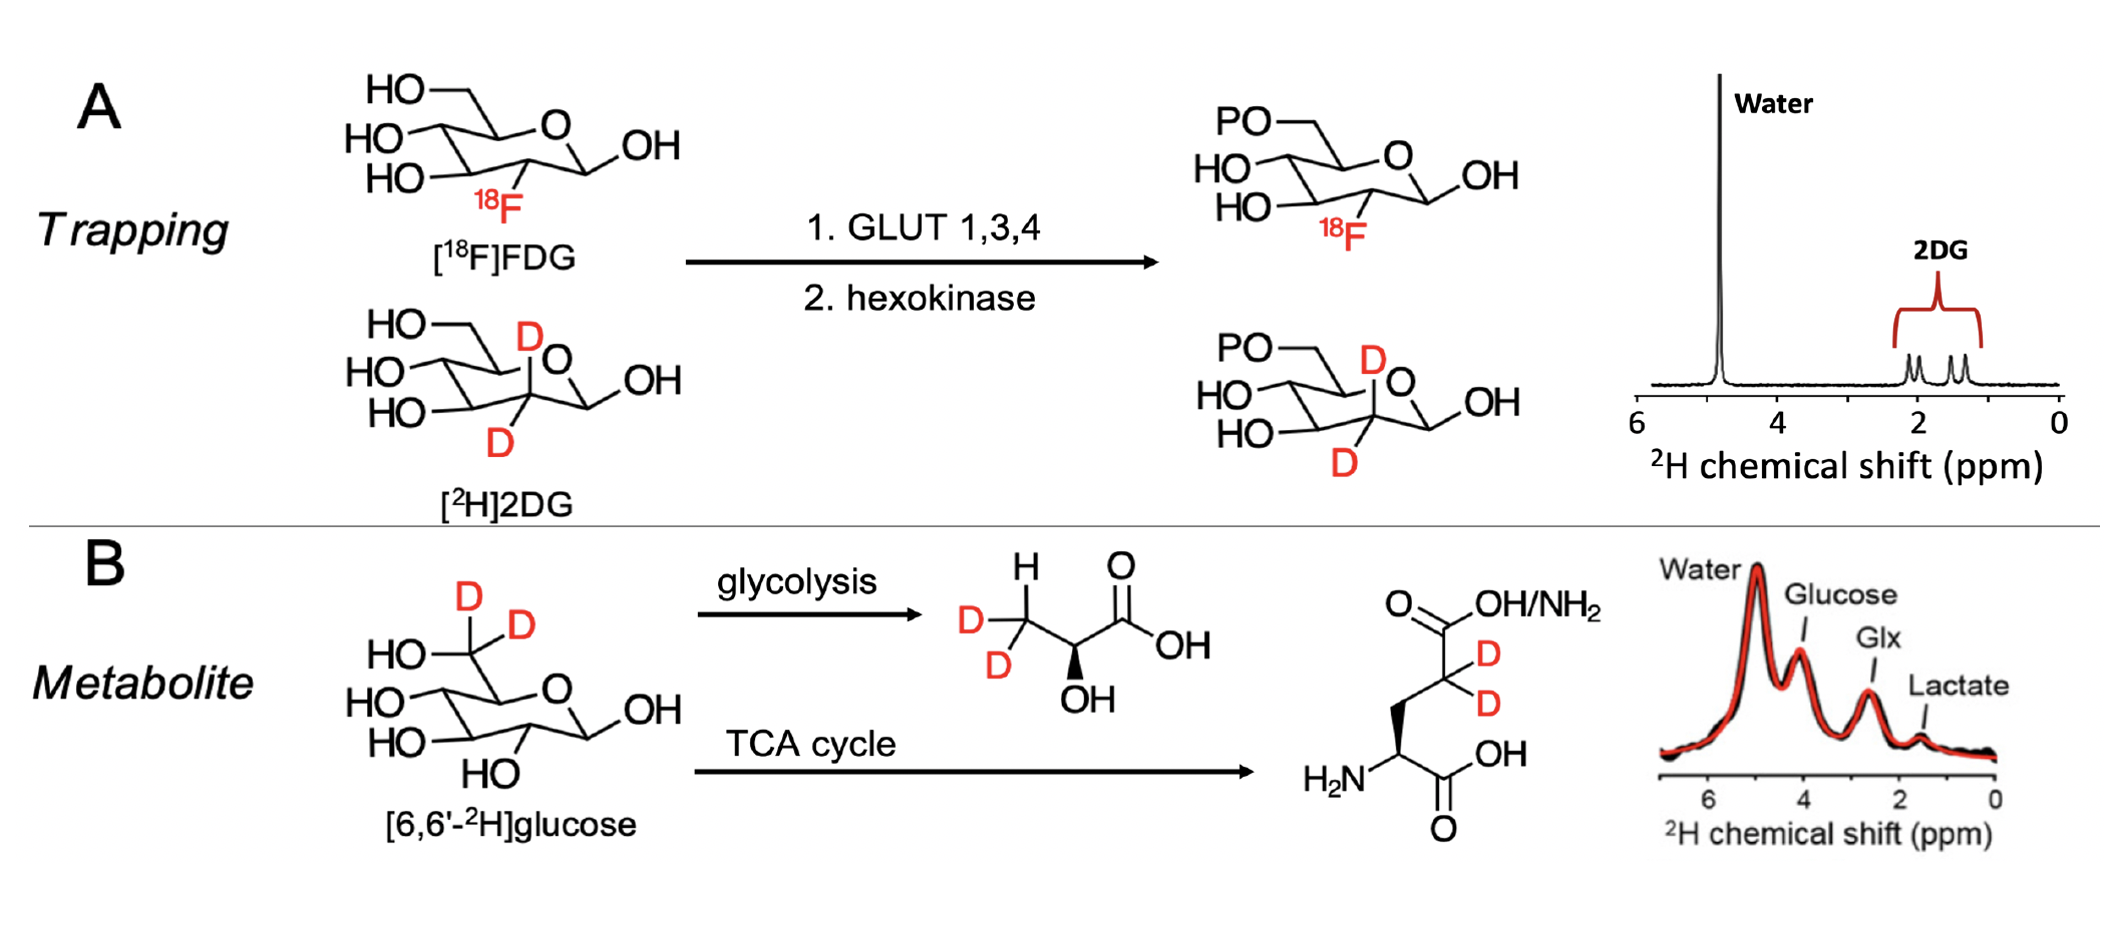
Figure 1 – Strategies for DMI interrogation of glucose metabolism. (A) Metabolic sequestration of [2H]2DG occurs via a mechanism analogous to that of [18F]FDG. Detection of the trapped, phosphorylated product is via the upfield 2-position resonances @ ~2ppm (red arrow; 2H NMR), (B) Glucose 2H-enriched at the 6,6’-position is used to detect the abundant metabolites lactate, glutamine, glutamate (2H NMR from normal brain).
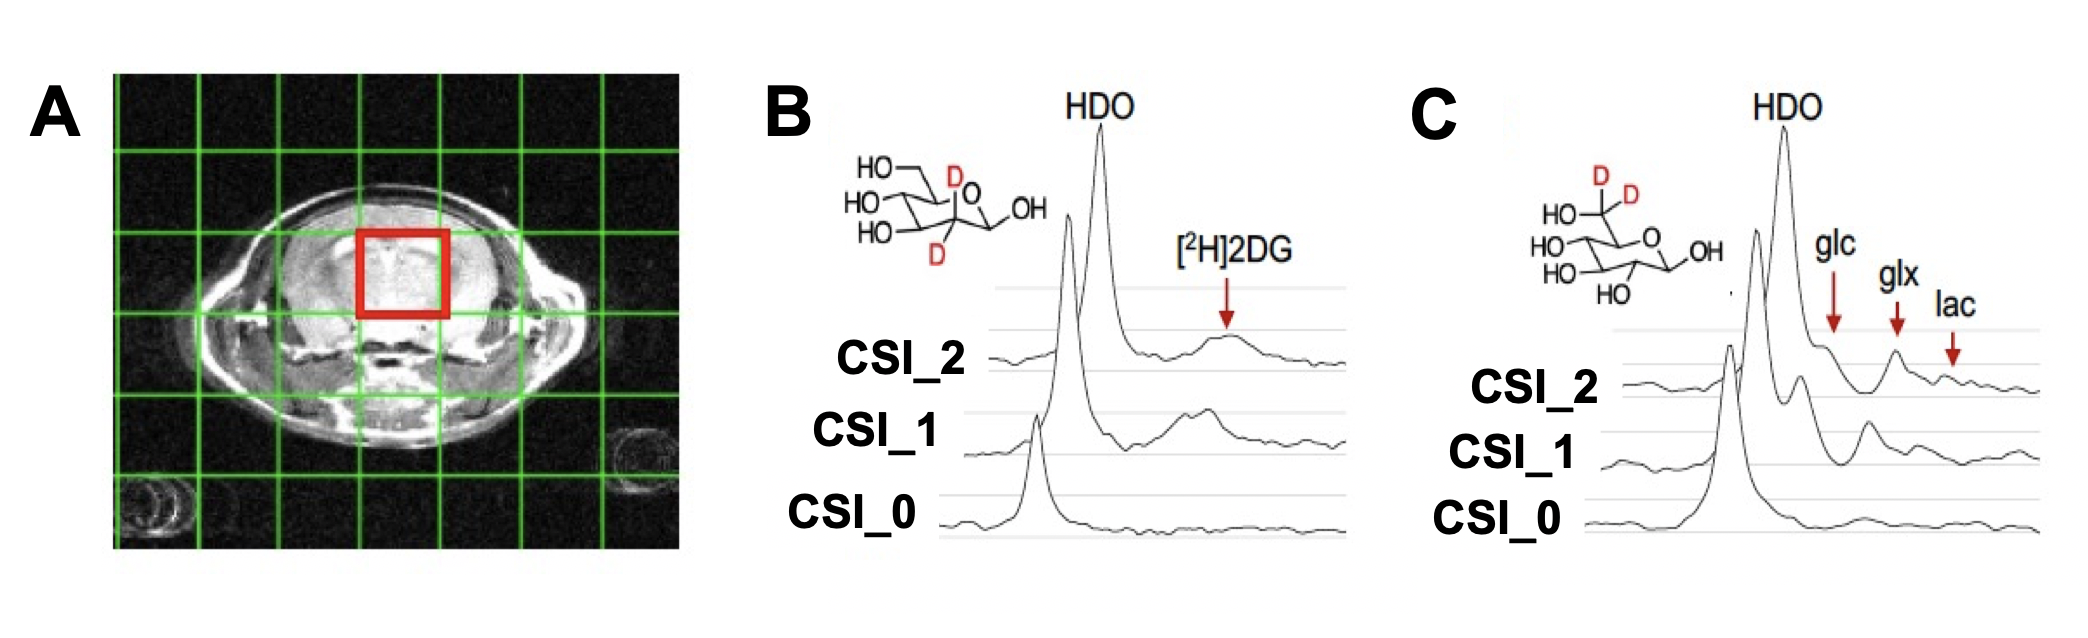
Figure 2 – Protocol used for dynamic DMI in mice. (A) CSI grid used for DMI acquisition. DMI spectrum from the brain voxel for (B) [2H]2DG and (C) [6,6’-2H2] (Glc=glucose, Glx: glutamine/glutamate, Lac=lactate) at baseline (CSI_0), 5 min (CSI_1) and 25 min (CSI_2).
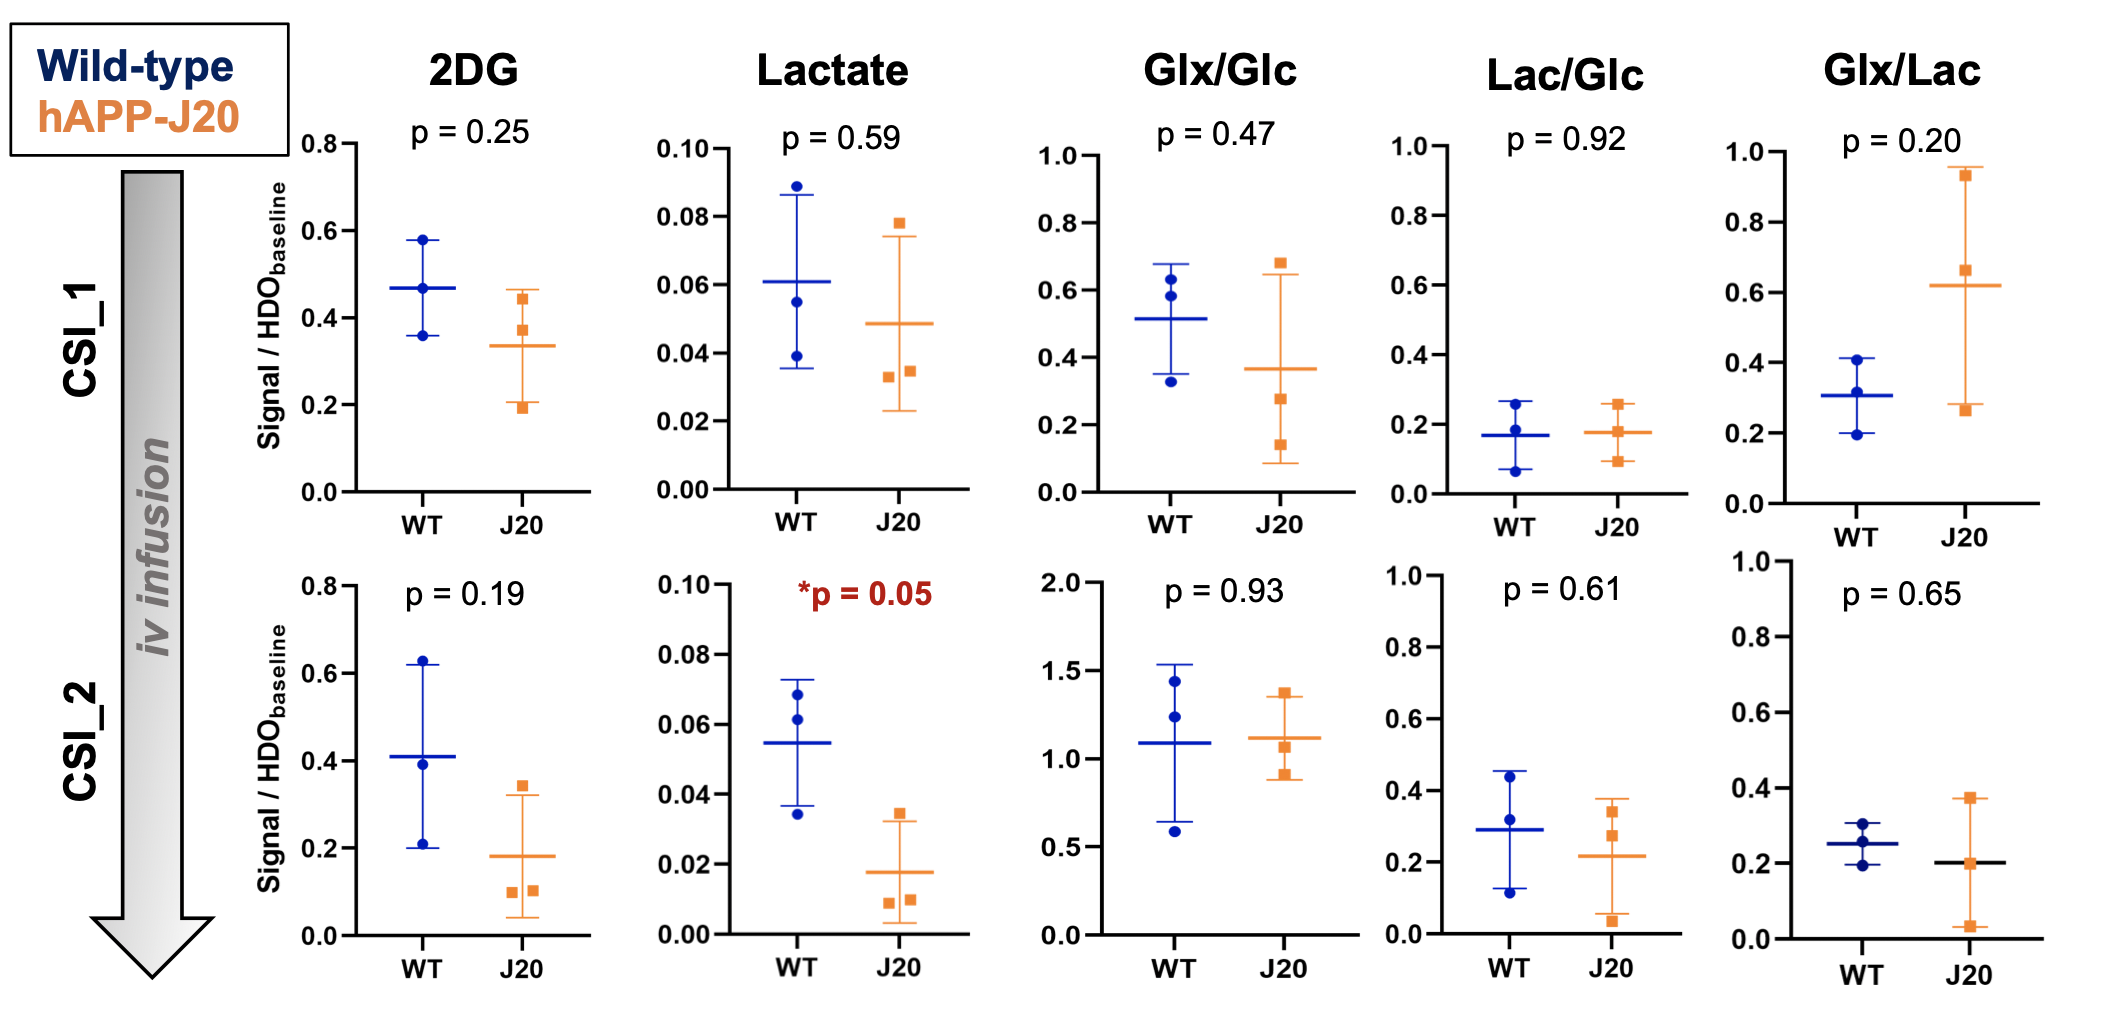
Figure 3 - Quantification of cerebral 2H-enriched metabolites. All 2H metabolites were normalized to HDO levels at baseline. [2H]2DG levels are lower in AD mice compared to control, although not reaching significance. A significant decrease in lactate production is found in AD mouse brain at CSI_2 (p=0.05), which could be partially explained by impaired glucose uptake. No significant differences in the ratios of Glx/Glc, Lac/Glc and Glx/Lac could be seen between AD and WT mice.