0016
Improved Deuterium Metabolic Imaging of Cancer by CSI-SSFP MRSI1Weizmann, Rehovot, Israel, 2Yale School of Medicine, New Haven, CT, United States
Synopsis
Keywords: Deuterium, Cancer, MRSI
Deuterium metabolic imaging (DMI) is a promising tool for studying tumor metabolism. In DMI [6,6’-2H2]-glucose is uptaken by tumors, leading to the formation of HDO and of [3,3’-2H2]-lactate as result of Warburg effect. DMI’s biggest challenge is SNR, consequence of 2H’s low Larmor frequency and the low concentrations of the targets. Depending on the type and size of the tumor, this can bring the key lactate signal below the noise level. This work explores weighted chemical shift imaging (CSI) methodologies for DMI based on SSFP sequences, providing improved lactate sensitivity over recently discussed CSI and multi-echo (ME) SSFP approaches.Introduction
DMI is a promising tool for studying tumor metabolism, whereby [6,6’-2H2]-glucose is uptaken and the formation of [3,3’-2H2]-lactate as result of the Warburg effect is monitored.1,2 Mapping these resonances as well as 2H-water (HDO) can thus highlight a tumor, as recently shown in pancreatic cancer assessments on mice.3,4 DMI’s biggest challenge is SNR, reflecting 2H’s low γ and low metabolic concentrations. Recently we showed that a 2-3x SNR improvement over conventional CSI could be imparted on DMI by multi-echo balanced SSFP (ME-SSFP) approaches.4,5 This work explores the use of SSFP in CSI sequences;6 it is shown that in combination with suitable acquisition and processing protocols, CSI-SSFP can improve ME-SSFP’s SNR per unit time by another factor of ≈3.Methods
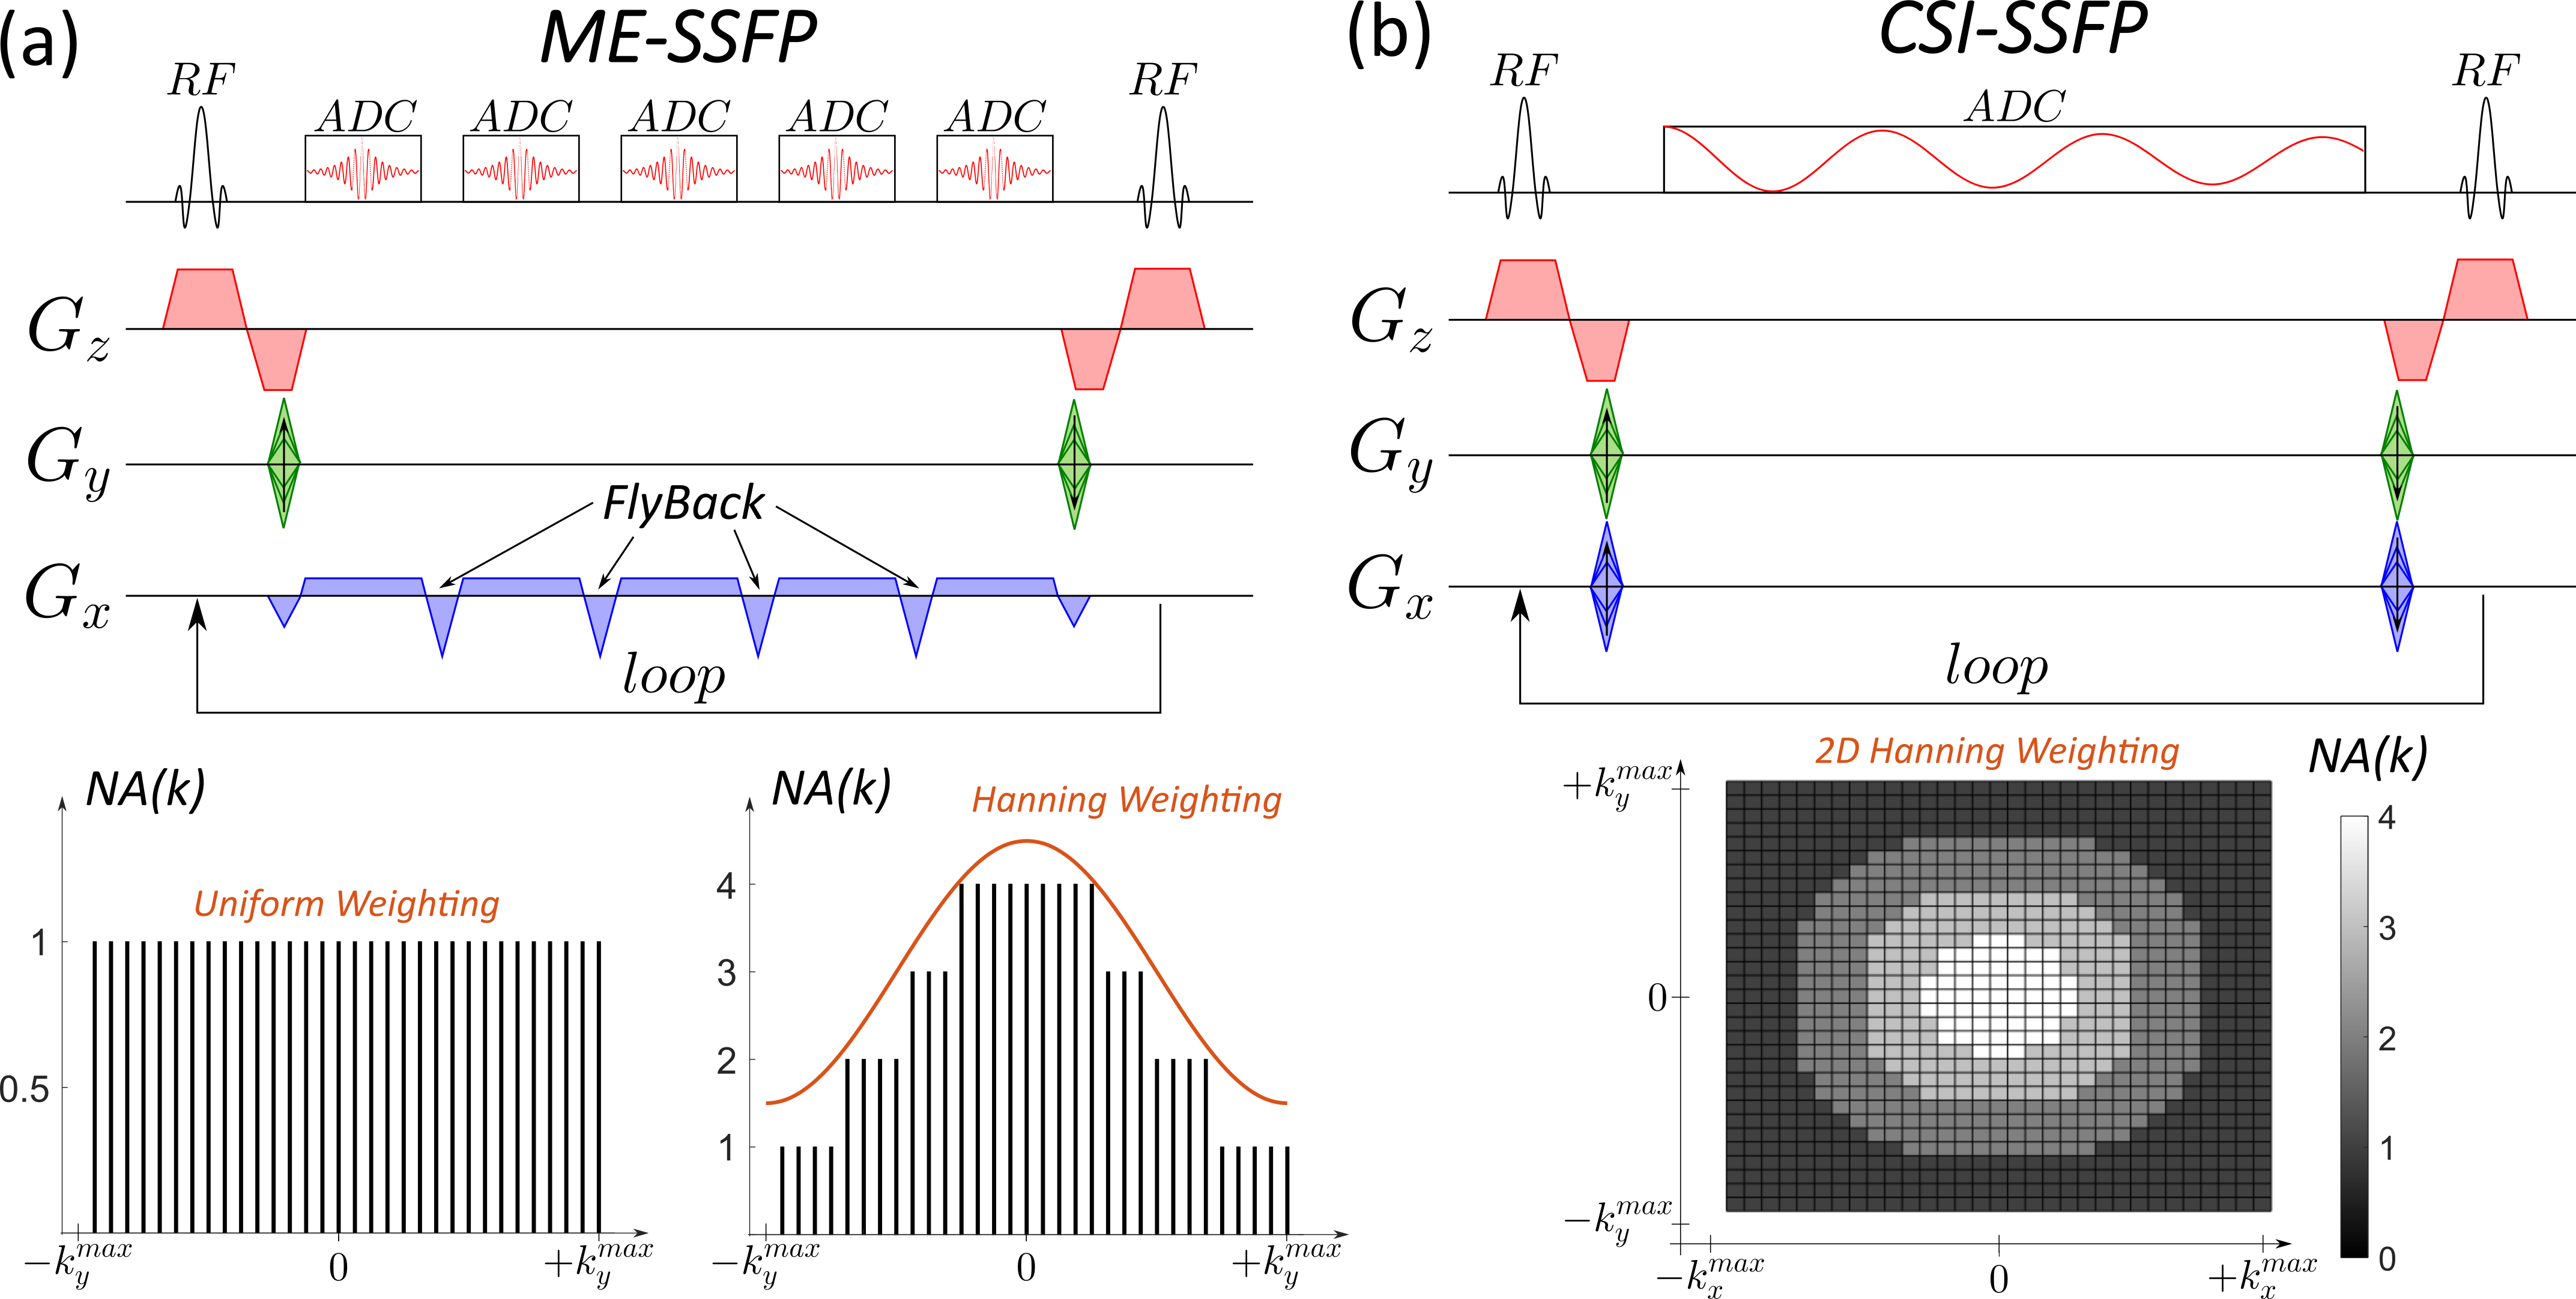
Phantom tests were done on three tubes with enriched [6,6’-2H2]-glucose, [3,3’,3’’-2H3]-lactate, and HDO at approximately 50 mM 2H concentrations in 2% agarose with PBS, respectively. In vivo experiments (approved by Weizmann’s IACUC) involved C57 black mice implanted with rodent pancreatic ductal adenocarcinoma (PDAC),5 and examined ca. a week after implantation. DMI involved injecting ~3 g/kg body weight of [6,6’-2H2]-glucose in PBS via a tail-vein line, and acquiring 2H/1H images on a 15.2T Bruker scanner, using surface coils tuned to 649.93 (1H) and 99.77 MHz (2H). ME-SSFP and CSI-SSFP sequences (Figure 1) were optimized for DMI as follows: TR =11.48 ms, flip angle = 60°, 32x32 matrices, in-plane FOV = 40x40mm2, ≈10 mm slices accommodating the full tumor. For ME-SSFP: five gradient echoes (TE = 2.1 ms) with fly-backs and a 20 kHz receiver bandwidth were used. For CSI-SSFP: same as ME-SSFP except that a 42-point gradient-free FIDs with 5 kHz receiver bandwidth were acquired. Uniform and weighted signal averaging of the phase-encoding (PE) domains9,10 were compared for the two sequences. Uniform ME-SSFP and CSI-SSFP used 1024 and 32 repetitions for their single- and dual PE axes, respectively. Signal averaging thus was ~6 min for all –uniform and weighted, CSI-SSFP and ME-SSFP– methods. 1H coronal images were collected using TurboRARE: 10 slices, 0.8mm thickness, same FOVs as DMI, 512x512 encoding matrix. 1H B0 maps were obtained by 3D double gradient echo, with same FOVs as for DMI and 64x64x8 encoding matrices. Spatial domains for both ME-SSFP and CSI-SSFP were reconstructed identically, by 2D FT after zero-filling to 64x64. Images arising from the separated ME-SSFP echoes and for each CSI-SSFP FID point (5 frames for ME-SSFP, and 42 for CSI-SSFP) were processed using IDEAL,4,7 which isolated the images of the individual sites using a priori known chemical shift positions (4.7, 3.6 and 1.2 ppm for the three DMI metabolites; 2 ppm carrier frequency). 1H-based B0 maps were used as initial guesses in the fitting to avoid “swaps” otherwise observed upon processing.8Results & Discussion
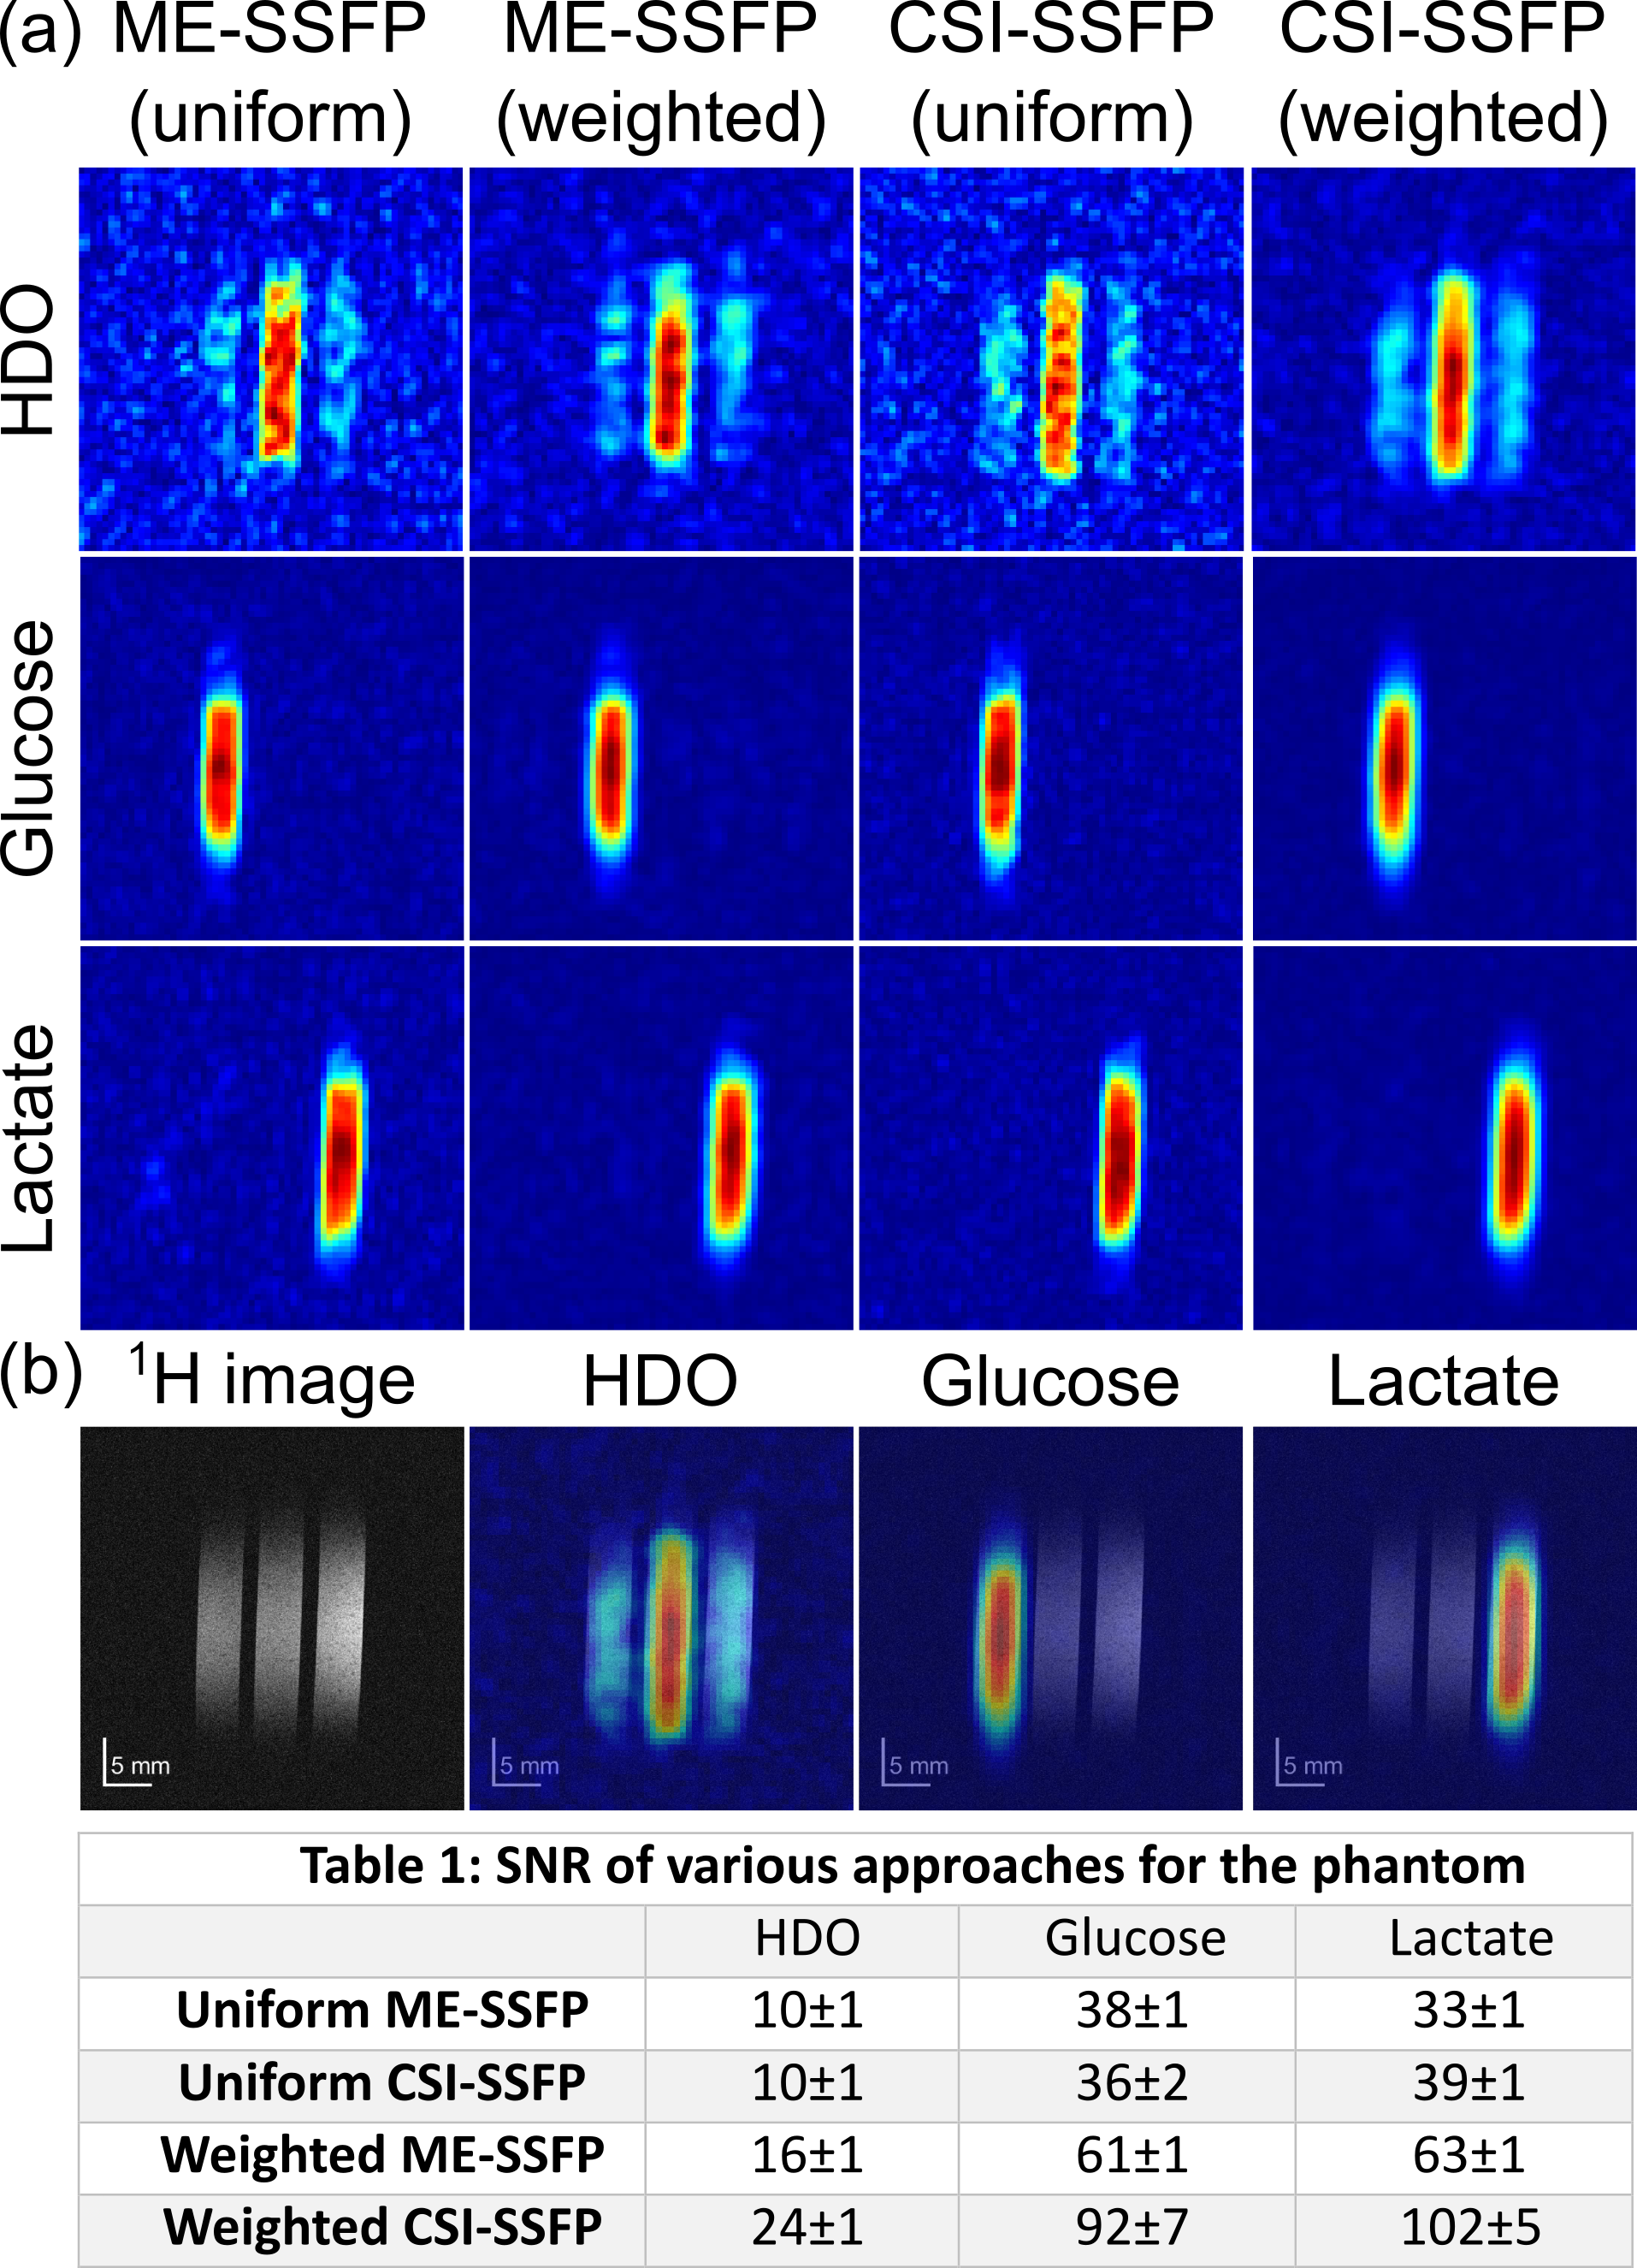
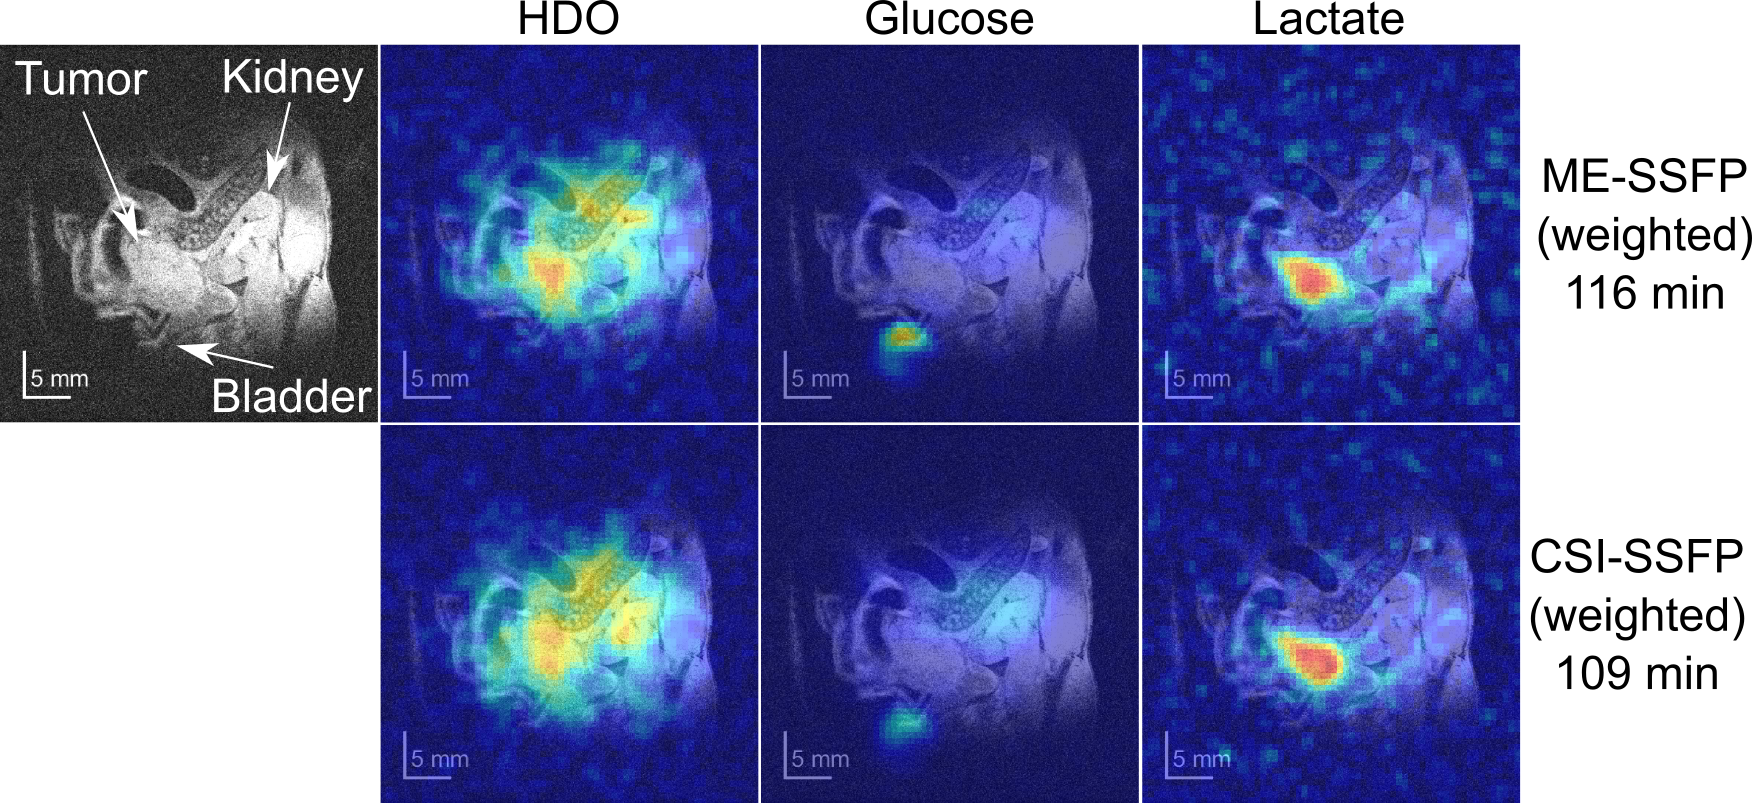
Figure 2 and Table 1 show, images and calculated SNRs for uniform/weighted CSI-SSFP and ME-SSFP, collected on a phantom. Although removing the ≈30% of time “wasted” by ME-SSFP’s flyback gradients should provide the CSI-SSFP counterpart with a ca. 15% SNR enhancement, uniformly sampled CSI-SSFP and ME-SSFP experiments have similar SNRs. This is probably by virtue of the IDEAL processing. On the other hand, the sensitivity benefits of doing a weighted averaging are clear (Table 1) –foremost in the CSI-SSFP experiment capable of implementing this along two axes. This, however, is achieved at the expense of a certain blurring, which is visible in this well-defined tube-based phantom (Figure 2).Figure 3 shows a 1H image acquired on a PDAC-implanted mouse, together with DMI results observed 109 and 116 min after [6,6’-2H2]-glucose injection, when collected with weighted CSI-SSFP and ME-SSFP methods. At this time the lactate in the tumor is maximized, and its signal is solely observed there. While by this time glucose is barely observable, HDO is visible with major intensity in the tumor position.
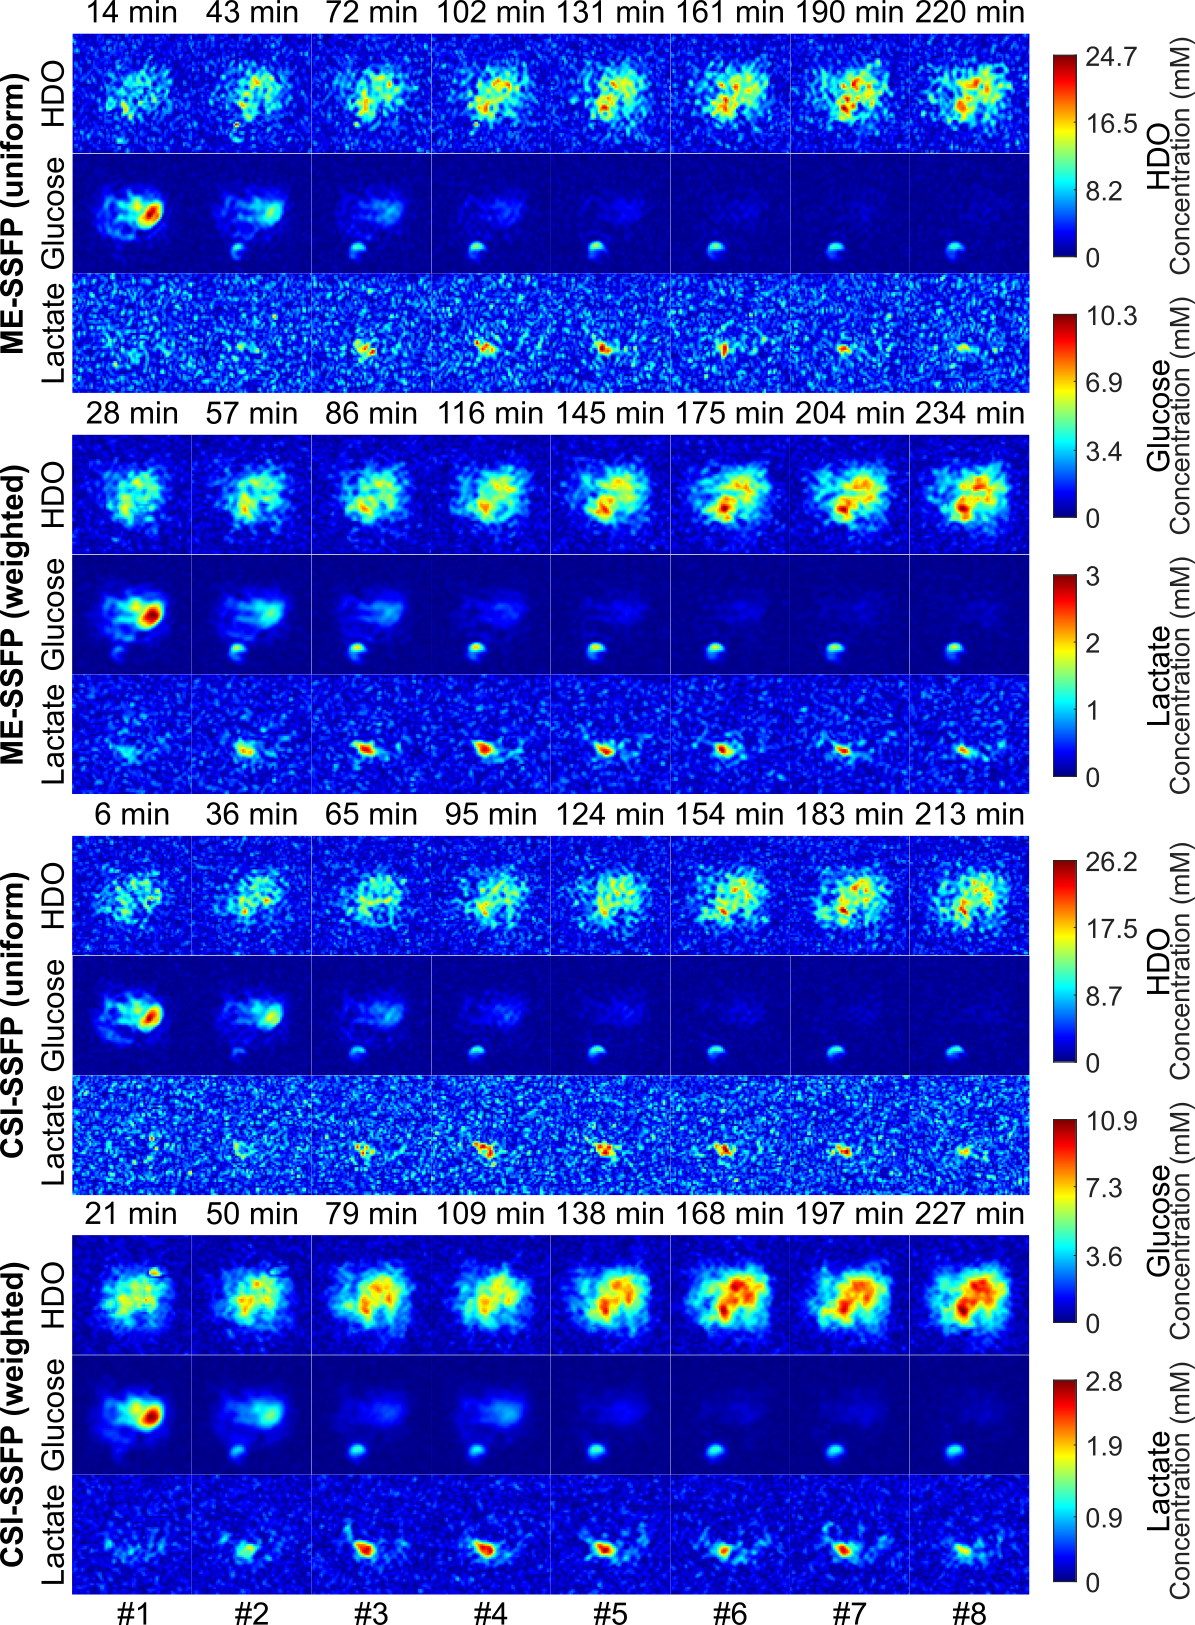
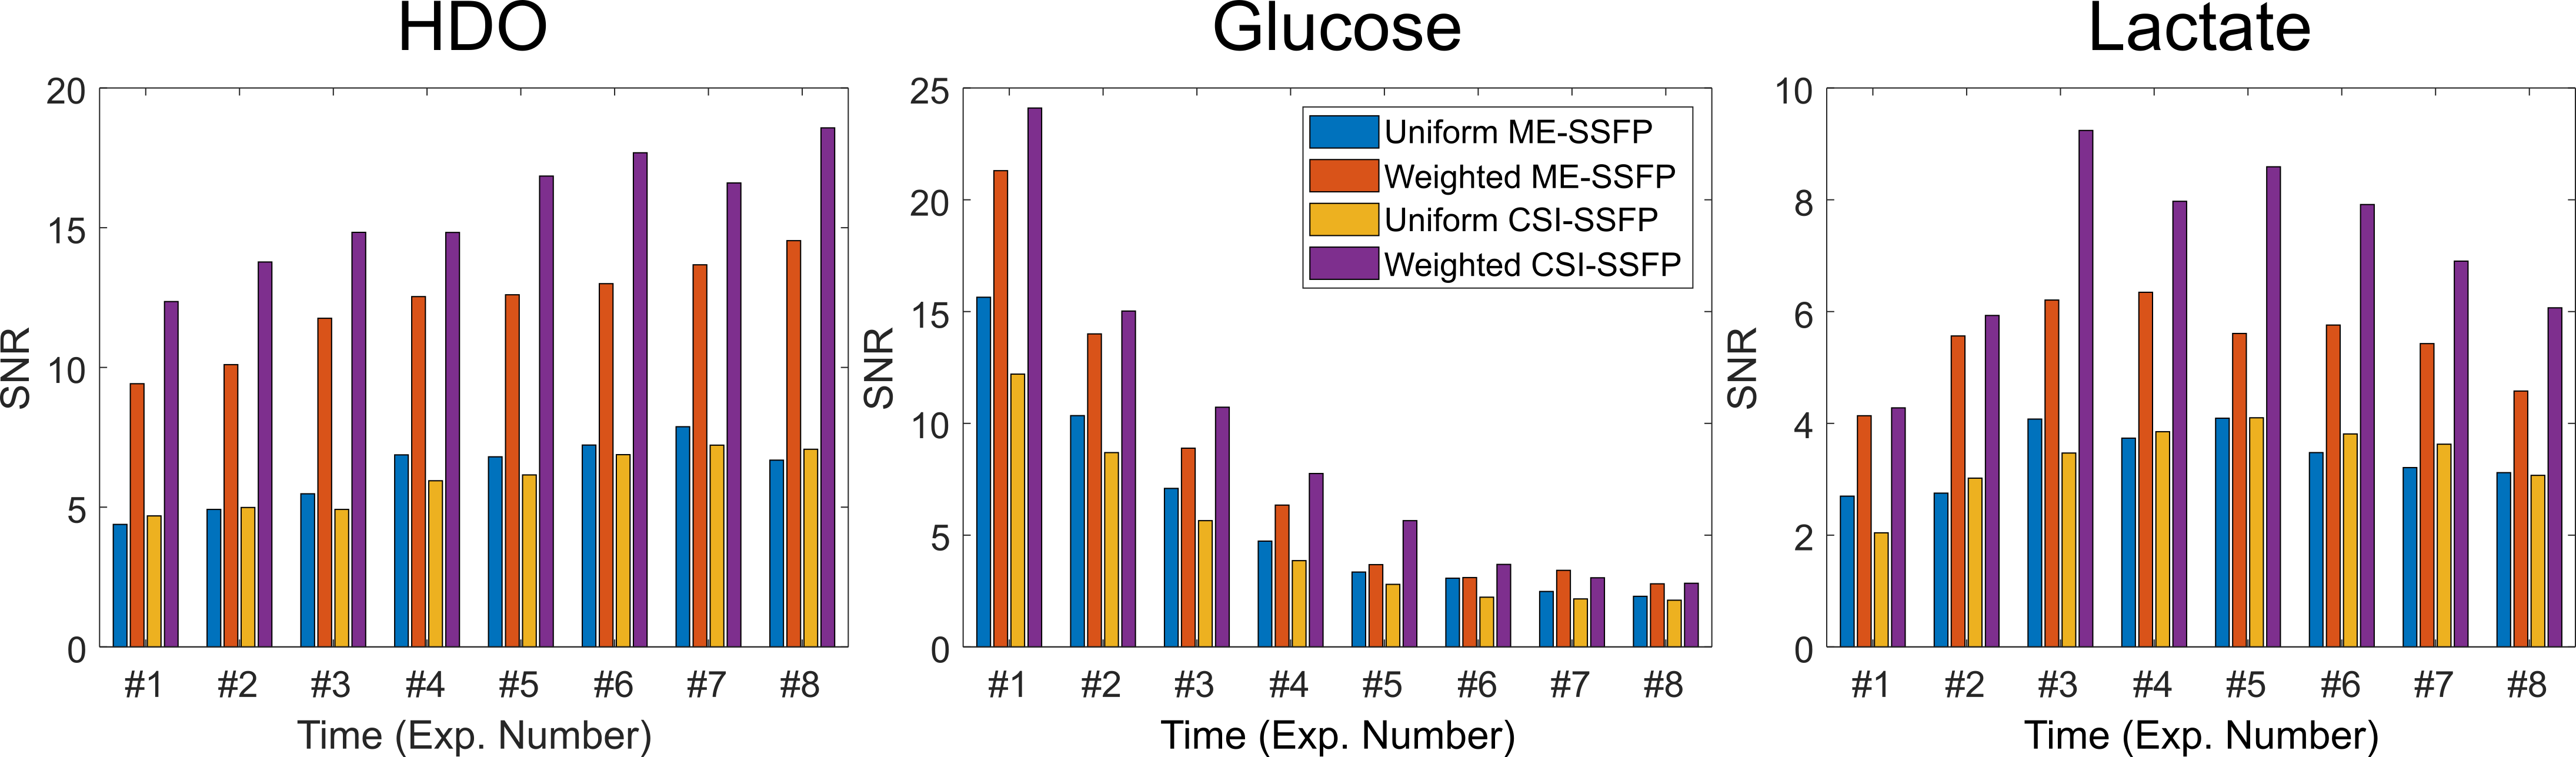
Figure 4 presents a full kinetic set of DMI results collected for both SSFP sequences, with uniform and weighted signal averagings. The superior SNR of the weighted CSI-SSFP for all metabolites is clear. No blurriness is evident, perhaps as a result of smearing in these relatively long in vivo abdominal acquisitions. The initial uptake of glucose by the kidney and slightly later by the tumor, before it gets concentrated in the bladder, is also seen. So is the increase with time of HDO throughout the body and in the tumor in particular –the latter being clearly evidenced by the lactate signature.
Figure 5 further analyzes these results by summarizing the SNRs observed for each metabolite over this whole set of time-incremented images, when focusing on the tumor region.
Conclusion
An alternative DMI acquisition mode was presented based on fitting phase-encoded FIDs collected under SSFP conditions, and reconstructing the resulting multi-time-point images using a priori information. CSI-SSFP had greater scan efficiency, and permitted greater SNR improvement using weighted averaging thanks to its bi-directional spatial encoding. Significant SNR gains were evidenced by the ensuing proposal –particularly for the lactate peak. By bringing the latter out of the noise, this could enable an earlier detection of cancer.Acknowledgements
We are grateful to Drs. Qingjia Bao and Talia Harris for assistance with the experiments. This work was supported by the Minerva, the Israel Science, and the Israel Cancer Research Foundations. LF heads the Clore Institute for High-Field Magnetic Resonance Imaging and Spectroscopy, whose support is also acknowledged.References
1. Lu M, Zhu XH, Zhang Y, Mateescu G, Chen W. Quantitative assessment of brain glucose metabolic rates using in vivo deuterium magnetic resonance spectroscopy. J Cereb Blood Flow Metab. 2017 Nov;37(11):3518-3530. doi: 10.1177/0271678X17706444. Epub 2017 May 15. PMID: 28503999; PMCID: PMC5669347.
2. De Feyter HM, Behar KL, Corbin ZA, Fulbright RK, Brown PB, McIntyre S, Nixon TW, Rothman DL, de Graaf RA. Deuterium metabolic imaging (DMI) for MRI-based 3D mapping of metabolism in vivo. Sci Adv. 2018 Aug 22;4(8):eaat7314. doi: 10.1126/sciadv.aat7314. PMID: 30140744; PMCID: PMC6105304.
3. Markovic S, Roussel T, Agemy L, Sasson K, Preise D, Scherz A, Frydman L. Deuterium MRSI characterizations of glucose metabolism in orthotopic pancreatic cancer mouse models. NMR Biomed. 2021 Sep;34(9):e4569. doi: 10.1002/nbm.4569. Epub 2021 Jun 16. PMID: 34137085.
4. Peters, DC, Markovic, S, Bao, Q, et al. Improving deuterium metabolic imaging (DMI) signal-to-noise ratio by spectroscopic multi-echo bSSFP: A pancreatic cancer investigation. Magn Reson Med. 2021; 86: 2604– 2617. https://doi.org/10.1002/mrm.28906
5. Martinho RP, Bao Q, Markovic S, Preise D, Sasson K, Agemy L, Scherz A, Frydman L. Identification of variable stages in murine pancreatic tumors by a multiparametric approach employing hyperpolarized 13 C MRSI, 1 H diffusivity and 1 H T1 MRI. NMR Biomed. 2021 Feb;34(2):e4446. doi: 10.1002/nbm.4446. Epub 2020 Nov 21. PMID: 33219722.
6. Speck O, Scheffler K, Hennig J. Fast 31P chemical shift imaging using SSFP methods. Magn Reson Med. 2002 Oct;48(4):633-9. doi: 10.1002/mrm.10279. PMID: 12353280.
7. Reeder SB, Pineda AR, Wen Z, Shimakawa A, Yu H, Brittain JH, Gold GE, Beaulieu CH, Pelc NJ. Iterative decomposition of water and fat with echo asymmetry and least-squares estimation (IDEAL): application with fast spin-echo imaging. Magn Reson Med. 2005 Sep;54(3):636-44. doi: 10.1002/mrm.20624. PMID: 16092103.
8. Yu H, Reeder SB, Shimakawa A, Brittain JH, Pelc NJ. Field map estimation with a region growing scheme for iterative 3-point water-fat decomposition. Magn Reson Med. 2005 Oct;54(4):1032-9. doi: 10.1002/mrm.20654. PMID: 16142718.
9. Adalsteinsson E, Star-Lack J, Meyer CH, Spielman DM. Reduced spatial side lobes in chemical-shift imaging. Magn Reson Med. 1999 Aug;42(2):314-23. doi: 10.1002/(sici)1522-2594(199908)42:2<314::aid-mrm14>3.0.co;2-x. PMID: 10440957.
10. Greiser A, von Kienlin M. Efficient k-space sampling by density-weighted phase-encoding. Magn Reson Med. 2003 Dec;50(6):1266-75. doi: 10.1002/mrm.10647. PMID: 14648575.
Figures