0015
Comparison of deuterium metabolic imaging measurements in human subjects at 7T following [2H2] glucose and [2H7] glucose ingestion1Sir Peter Mansfield Imaging Centre, University of Nottingham, Nottingham, United Kingdom, 2School of Physics and Astronomy, University of Nottingham, Nottingham, United Kingdom, 3NIHR Nottingham Biomedical Research Centre/Nottingham Clinical Research Facilities, Queen's Medical Centre, Nottingham, United Kingdom, 4Radiological Sciences, Division of Clinical Neuroscience, School of Medicine, University of Nottingham, Nottingham, United Kingdom, 5MRC-Versus Arthritis Centre for Muscoskeletal Ageing Research, University of Nottingham, Nottingham, United Kingdom, 6School of Life Sciences, University of Nottingham, Nottingham, United Kingdom
Synopsis
Keywords: Deuterium, Deuterium
We compared the use of DMI following D2-glucose and D7-glucose ingestion in the investigation of brain metabolism in vivo. Multiple CSI measurements were acquired from five participants over ~180 minutes at 7T following ingestion of each labelled compound. D7-glucose produced significantly larger signals allowing improved mapping of the signals from labelled metabolites. Calculated time-courses of the changes in metabolite concentration in different brain tissues show significantly larger rates of increase of HDO and Glx in all tissues for D7- versus D2-glucose (e.g. in GM HDO rate of increase for D7/D2 = 0.208±0.004/0.051±0.001 mM/min and Glx rate for D7/D2 = 0.059±0.003/0.029±0.001 mM/min).
Introduction
Recently there has been an increase in interest in MRS and MRI using deuterium (2H) labelled metabolic substrates (1-5). The most commonly used 2H-labelled substrate for deuterium metabolic imaging (DMI) is [2H2] glucose (D2-glucose) (1-4), but [2H7] glucose (D7 glucose) (7) offers a greater signal-to-noise (SNR) due to its higher deuterium content. This abstract presents the first comparison of the use of DMI following D2-glucose and D7-glucose ingestion in the investigation of metabolism in vivo in healthy human participants.Methods
This study involved using DMI following ingestion of deuterium-labelled glucose (0.75g/kg body weight dissolved in 250 ml water) to measure brain metabolism in ten healthy participants: five (age 28 ± 15 years; weight 65 ± 5 kg), ingested D2-glucose and five (age 32 ± 13 years; weight 70 ± 18 kg), ingested D7-glucose. Scanning was performed on a 7T Philips Achieva Scanner using 26.4-cm-inner-diameter, dual-tuned 1H/2H birdcage coil (Rapid Biomedical).Prior to glucose ingestion we made baseline measurements of natural abundance water signals for use in normalisation. These measurements comprised a 1H scout scan, a 1H MPRAGE scan (1.4 mm resolution), 2H pulse-acquire spectra from the whole head (TR = 1s; 16 averages) and from a 2-cm-thick axial slice positioned (TR = 1s; 128 averages) over the lateral ventricles, and a whole-brain 2H 3D chemical shift image (CSI) (15 mm isotropic resolution, FOV = 180x180x120 mm3, TR = 230 ms, TE = 2.4 ms, 6 averages with weighted k-space averaging yielding a 670-s acquisition time). In a subsequent scanning session commencing around 30 minutes after glucose ingestion we repeated the 1H scout and MPRAGE scans, and then repeatedly acquired the spectra and CSI data over a 180-minute period (yielding a minimum of 5 CSI measurements).
Spectra were fitted using the OXSA-AMARES toolbox (8,9), with single peaks for HDO, glucose (Glc), glutamate/glutamine (Glx) and lactate (Lac) for D2-glucose, while for D7-glucose additional peaks with linked amplitudes were included to represent the contributions from the different 2H sites in the two glucose anomers (10). Individual CSI data sets were smoothed to 20-mm isotropic resolution before fitting to improve SNR, summing CSI data-sets allowed analysis at 15-mm resolution. For the time-course analysis of signal changes in different brain regions, the data acquired was co-registered using the MPRAGE images for alignment. After brain extraction using FSL BET (11), MPRAGE images were segmented using FSL FAST (12) to create masks for CSF (ventricles) and grey (GM) and white (WM) matter. Occipital and frontal lobe masks were obtained from the MNI structural atlas. The CSI data were complex-averaged over the masks to produce metabolite concentrations for each region of interest.
Signal amplitudes were converted to molar concentrations using the CSI data for HDO at natural abundance (prior to the ingestion of glucose) for normalisation. This conversion also required estimates of metabolite T1-values (2), water fractions for tissue-types, and the effective number of deuterium labels appearing in metabolites when using D2-glucose (13) and D7-glucose (14).
Results
Figure 1 shows spectra acquired from a 2-cm-thick slice over the ventricles in two different participants at time-points before and after, ingesting D2- or D7-glucose. Spectra are normalised to the amplitude of the natural abundance HDO signal before glucose ingestion, and the greater amplitudes of the signals following D7-glucose ingestion are evident. A single spectrum from each time series is also shown, along with the OXSA-AMARES fit, and the contributions to the fit from HDO, Glc, Glx and Lac. Due to the additional label positions, D7-glucose produces a broader peak centred around 3.7 ppm than D2-glucose, along with additional resonances at 5.2 and 4.6 ppm.Figure 2 displays CSI data from one slice after averaging over six measurements made following D2-glucose or D7-glucose ingestion. Spectra and fits are shown overlaid on the corresponding MPRAGE images. Interpolated maps of metabolite signal amplitude derived from the fits in Figure 2 are shown overlaid on the MPRAGE image in Figure 3.
Time-courses of the estimated metabolite concentrations in CSF, GM and WM and in occipital and frontal lobes are shown in Figure 4 for the 5 participants who ingested D7-glucose, while Figure 5 shows the average time-courses over the 5 participants who ingested D7-glucose or D2-glucose.
Discussion
DMI following ingestion of D7-glucose produces significantly larger HDO and Glx signals compared to use of D2-glucose (Figs. 2 and 3), along with additional Glc peaks (Fig. 2). This allows more accurate spectral fitting and hence improved mapping of the signals from labelled metabolites (Fig. 3). Calculated time-courses of the changes in metabolite concentration in different brain tissues (Fig. 5), show significantly larger rates of increase of HDO and Glx in all tissues for D7- versus D2-glucose (e.g. in GM HDO rate of increase for D7/D2 = 0.208±0.004/0.051±0.001 mM/min and Glx rate for D7/D2 = 0.059±0.003/0.029±0.001 mM/min). Although lactate signals are weak in individual voxels, ROI analysis shows an evident increase in lactate signal following D7-glucose ingestion (Fig. 5). There is a significant variation in the concentration time courses measured in different participants particularly for HDO (Fig. 4). The latter may result from differences in the level of labelled water production by metabolism elsewhere in the body.Acknowledgements
This research was funded by the NIHR Nottingham Biomedical Research Centre and Clinical Research Facilities. DC’s Ph.D. studies are funded by the Precision Imaging Beacon at the University of Nottingham.
References
1. Lu M, Zhu X-H, Zhang Y, Mateescu G, Chen W. Quantitative assessment of brain glucose metabolic rates using in vivo deuterium magnetic resonance spectroscopy. J Cereb Blood Flow Metab 2017;37(11):3518-3530.
2. De Feyter HM, Behar KL, Corbin ZA, Fulbright RK, Brown PB, McIntyre S, Nixon TW, Rothman DL, de Graaf RA. Deuterium metabolic imaging (DMI) for MRI-based 3D mapping of metabolism in vivo. Science advances 2018;4(8):eaat7314.
3. De Feyter HM, de Graaf RA. Deuterium metabolic imaging – Back to the future. Journal of Magnetic Resonance 2021;326:106932.
4. de Graaf RA, Hendriks AD, Klomp DWJ, Kumaragamage C, Welting D, Arteaga de Castro CS, Brown PB, McIntyre S, Nixon TW, Prompers JJ, De Feyter HM. On the magnetic field dependence of deuterium metabolic imaging. NMR Biomed 2020;33(3):e4235.
5. Simões RV, Henriques RN, Cardoso BM, Fernandes FF, Carvalho T, Shemesh N. Glucose fluxes in glycolytic and oxidative pathways detected in vivo by deuterium magnetic resonance spectroscopy reflect proliferation in mouse glioblastoma. NeuroImage: Clinical 2022;33:102932.
6. Warburg O. On the origin of cancer cells. Science (New York, NY) 1956;123(3191):309-314.
7. Mahar R, Zeng H, Giacalone A, Ragavan M, Mareci TH, Merritt ME. Deuterated water imaging of the rat brain following metabolism of [2H7] glucose. Magn Reson Med. 2021 Jun;85(6):3049-3059. doi: 10.1002/mrm.28700. Epub 2021 Feb 12. PMID: 33576535; PMCID: PMC7953892.
8. Purvis LAB, Clarke WT, Biasiolli L, Valkovic L, Robson MD, Rodgers CT. OXSA: An open-source magnetic resonance spectroscopy analysis toolbox in MATLAB. Plos One 2017; 12(9):e0185356.
9. Vanhamme L, van den Boogaart A, Van Huffel S. Improved method for accurate and efficient quantification of MRS data with use of prior knowledge. Journal of Magnetic Resonance 1997;129(1):35-43.
10. Govindaraju V, Young K, Maudsley AA. Proton NMR chemical shifts and coupling constants for brain metabolites. NMR in Biomedicine 2000;13(3):129–153. https://doi.org/10.1002/1099-1492
11. Smith SM. Fast robust automated brain extraction. Human brain mapping 2002;17(3):143-155.
12. Zhang Y, Brady M, Smith S. Segmentation of brain MR images through a hidden Markov random field model and the expectation-maximization algorithm. IEEE transactions on medical imaging 2001;20(1):45-57.
13. de Graaf RA, Thomas MA, Behar KL, De Feyter HM. Characterisation of kinetic isotope effects and label-loss in deuterium-based isotopic labelling studies. ACS Chem. Neurosci. 2021;12: 234−243
14. Funk AM, Anderson BL, Wen X, Hever T, Khemtong C, Kovacs Z, Sherry AD, Malloy CR. The rate of lactate production from glucose in hearts is not altered by per-deuteration of glucose. J. Magn. Reson. 2017;284:86–93
15. Kaggie JD, Khan AS, Matys T, Schulte RF, Locke, MJ, Grimmer A, Frary A, Graves MJ, Mclean MA, Gallagher FA, Kaggie J. Deuterium metabolic imaging and hyperpolarized 13C-MRI of the normal human brain at clinical field strength reveals differential cerebral metabolism. MedRxiv 2022; 257:119284. https://doi.org/10.1101/2022.02.07.22269533
16. Ruhm L, Avdievich N, Ziegs T, Nagel AM, de Feyter HM, de Graaf RA, Henning A. Deuterium metabolic imaging in the human brain at 9.4 Tesla with high spatial and temporal resolution. NeuroImage 2021;244. https://doi.org/10.1016/j.neuroimage.2021.118639
Figures
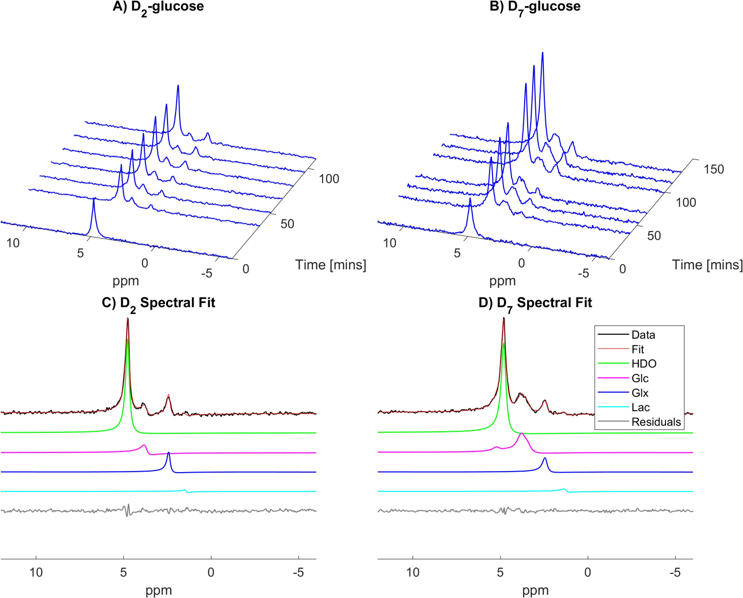
Figure 1. Stacked selective spectra from a 2-cm-thick slice over the lateral ventricles from participants who had ingested D2-glucose (a) or D7-glucose (b). (c-d). Spectra from the ~100 minute timepoints with corresponding fits are shown, along with separated contributions from each metabolite and the residuals after fitting.
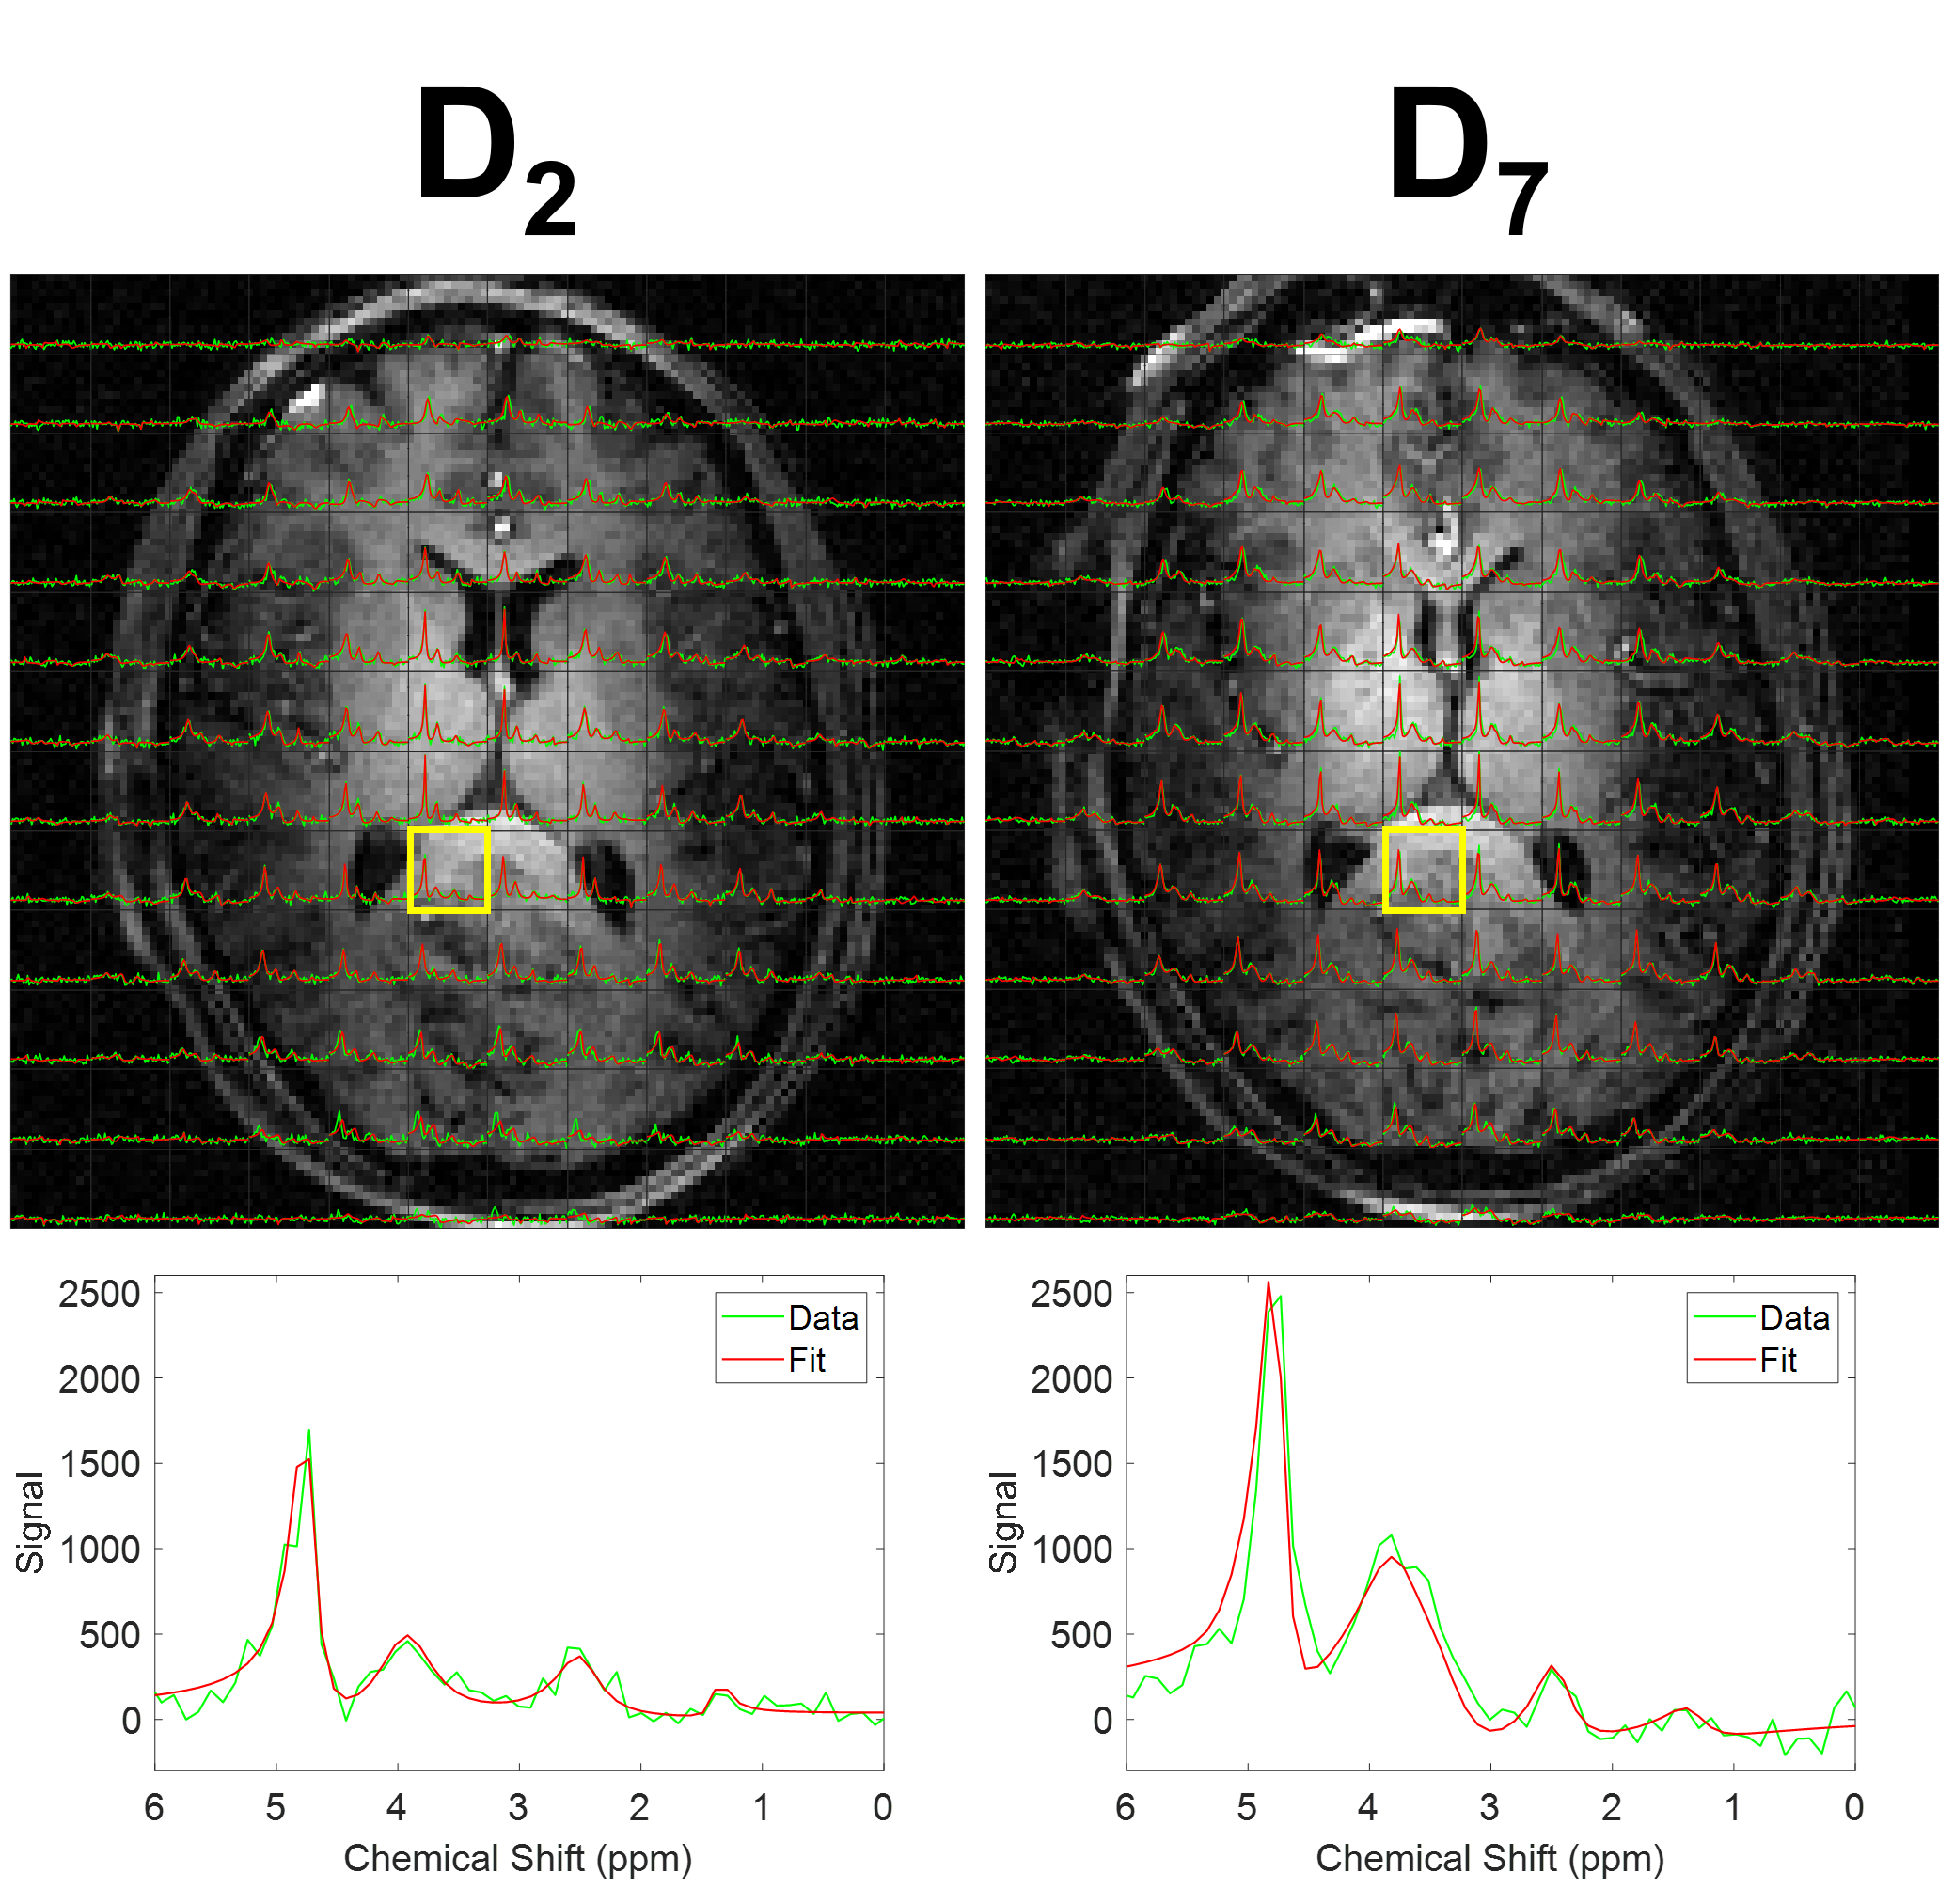
Figure 2. CSI data from one slice from the 3D data set (FOV = 180x180x120 mm3, 15mm resolution, apodised using 5 Hz exponential filter) measured from the same participant after ingestion of D2-glucose (left) and D7-glucose (right) in separate experimental sessions. Spectra were produced by averaging over six CSI scans acquired during each session and are overlaid on the corresponding slice of the MPRAGE image acquired in that session. Experimental data (green) and fits (red) are shown for each voxel. The spectra from the highlighted voxels are shown in detail in the lower plots.
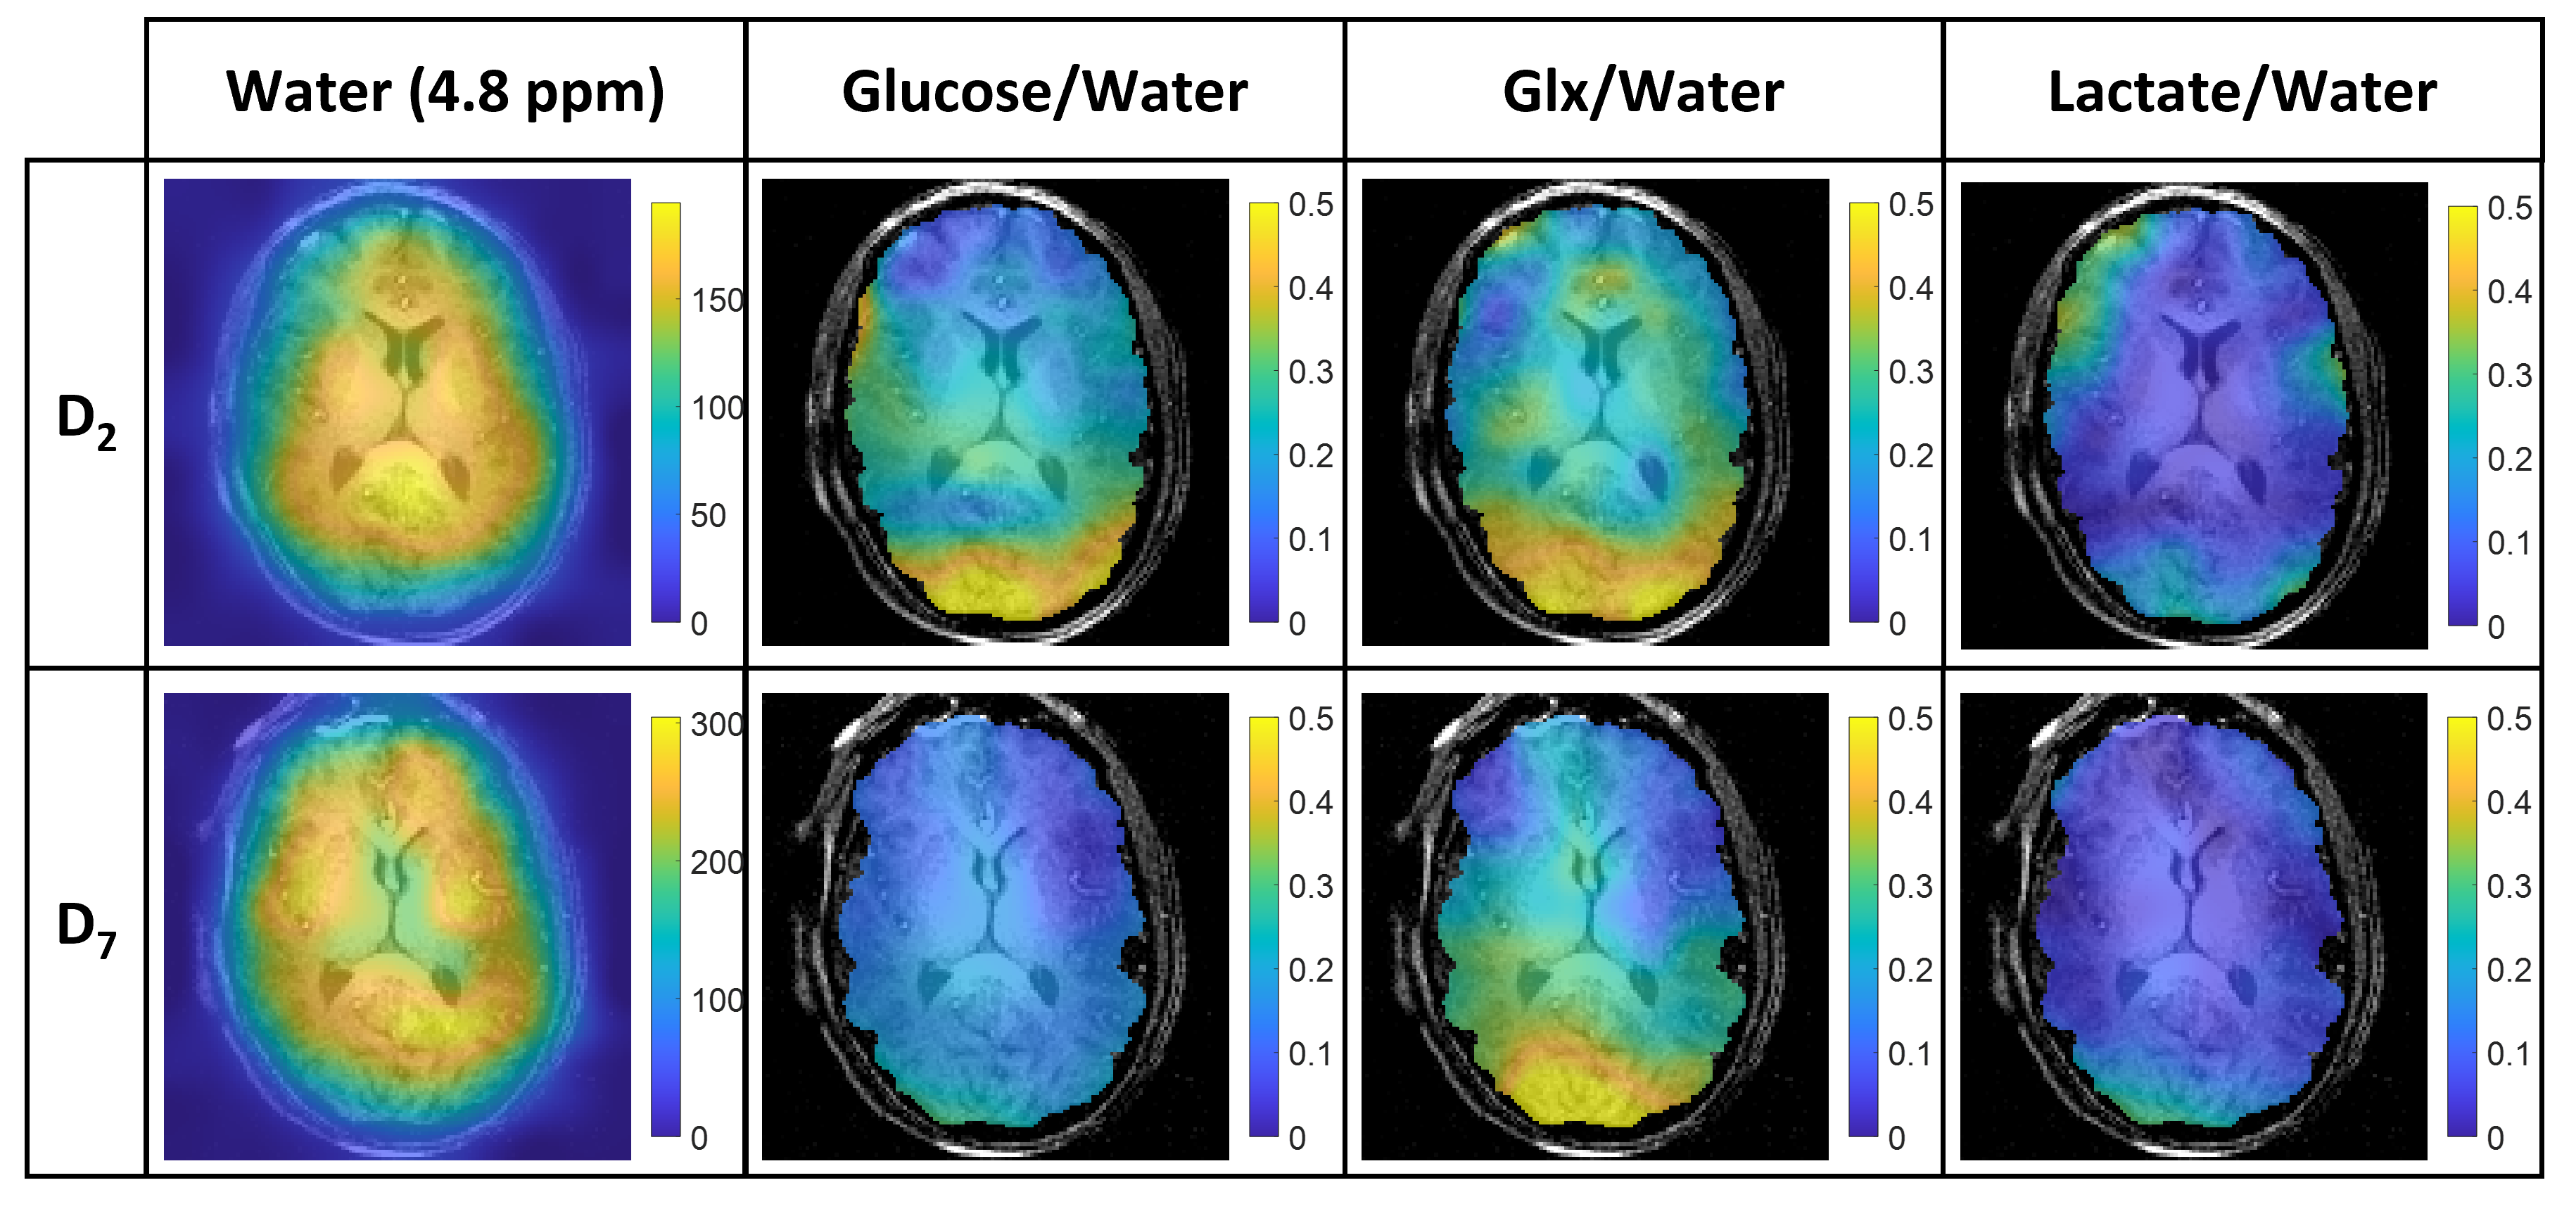
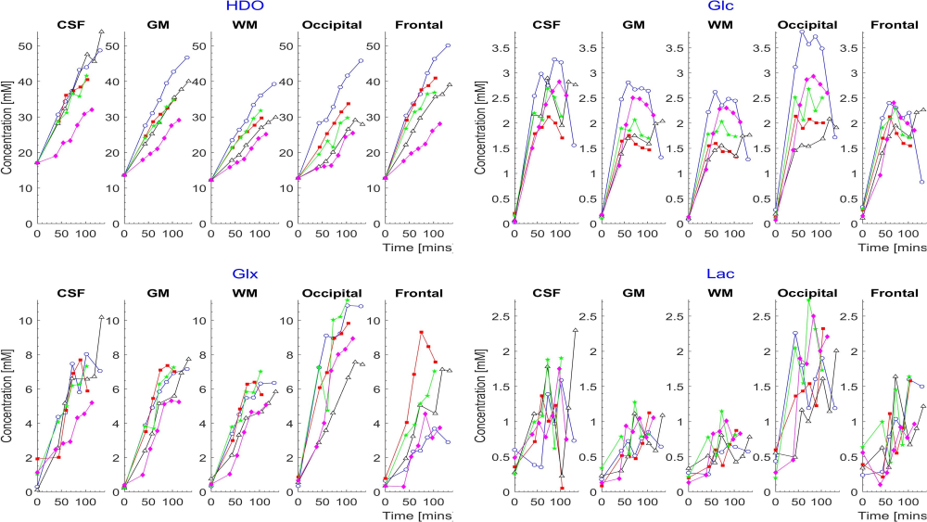
Figure 4. Time course of metabolite concentrations in CSF, GM, WM, occipital lobe and frontal lobe for the five participants who ingested D7-glucose. Values are calculated by averaging the masked complex amplitude maps for each CSI, using literature values of T1, water fractions and the effective number of deuterium labels appearing in metabolites.
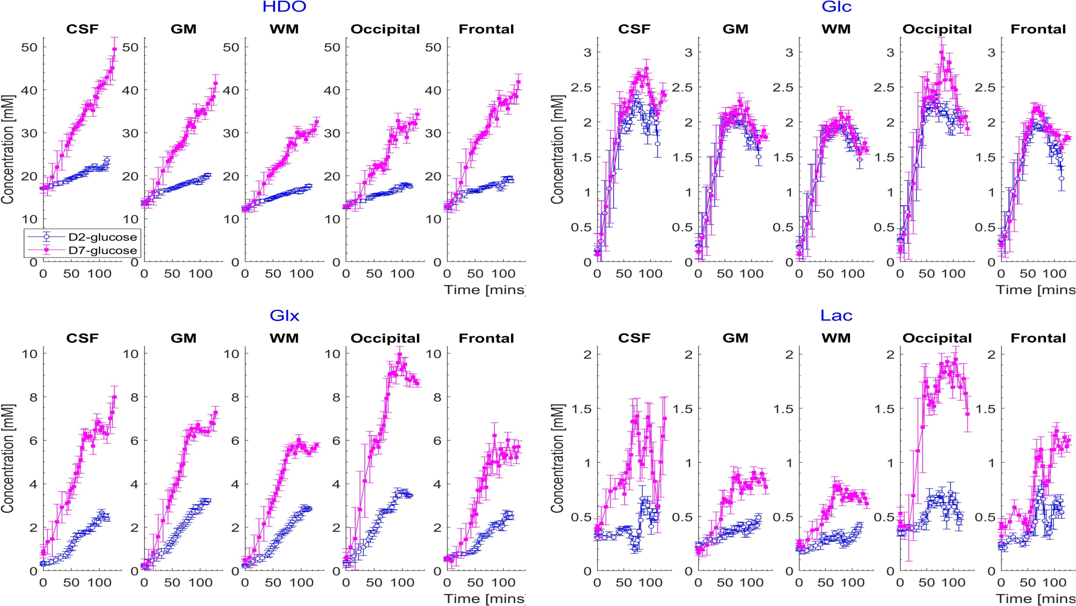
Figure 5. Average time courses of metabolite concentrations from CSF, GM, WM, occipital lobe and the frontal lobe from participants who ingested D2-glucose (blue) and D7-glucose (pink). Values are averaged over five participants with error bars representing the standard deviation over participants.