0014
Functional Study of Glucose Consumption, TCA Cycle Activity and Lactate Production in Healthy Human Brain Using Dynamic 2H MRS Imaging at 7T1Center for Magnetic Resonance Research, Department of Radiology, University of Minnesota, Minneapolis, MN, United States, 2Beckman Institute for Advanced Science and Technology, University of Illinois at Urbana-Champaign, Urbana, IL, United States, 3National Center for Supercomputing Applications, University of Illinois at Urbana-Champaign, Urbana, IL, United States, 4Department of Electrical and Computer Engineering, University of Illinois at Urbana-Champaign, Urbana, IL, United States
Synopsis
Keywords: Deuterium, fMRI, Functional deuterium metabolic imaging
The relationship of total glucose consumption, TCA cycle and glycolysis in healthy human brain under resting and activated conditions has not been well studied due to the lack of effective neuroimaging tools. The recently developed dynamic deuterium metabolic imaging method provides a long desired capability for such studies. Here, we present the first functional deuterium imaging study in human brains during hemi-field visual stimulation at 7T. Our results provide new insights into the metabolic shifting between oxidative phosphorylation and aerobic glycolysis from the rest to activated state in supporting high energy demand of evoked activity in human visual cortex.INTRODUCTION
Glucose is the main energy substrate for a healthy brain. The glycolysis, tricarboxylic acid (TCA) cycle and oxidative phosphorylation (OXPHOS) form a complex metabolic network to produce ATP energy under various brain states. In normal resting brain, most glucose is metabolized through TCA cycle and OXPHOS pathways with a high ATP yield, but when brain state changes, aerobic glycolysis that produces lactate and only 2 ATP/glucose can increase dramatically 1, an important phenomenon of metabolic shifting. Due to the lack of effective neuroimaging techniques, the quantitative relationship of total glucose consumption, TCA cycle and aerobic glycolysis in the human brain under different conditions has not been well investigated. We have applied recently developed dynamic in vivo deuterium (2H) MRS imaging (DMRSI) technique 2-4 to simultaneously measure the dynamic changes of deuterated metabolites involved in glucose metabolism, namely, 2H-labeled water (HDO), glucose (Glc), mixed glutamate/glutamine (Glx) and lactate (Lac) in human visual cortex during hemi-field visual stimulation.METHODS
Three healthy volunteers (2 female/1 male, 31-36 years old) participated in this study with oral administration of deuterated D-Glucose-6,6-d2 (D66, Cambridge Isotope Lab, 0.75 g/kg dose). A 7T Siemens human scanner (Magnetom, Germany) and a passively decoupled quadrature 1H and single loop 2H (8.9cm diameter) surface coil covering the occipital lobe were used. A hemi-field black-red checkerboard stimulus flashing at 8Hz was used for BOLD fMRI and functional DMRSI measurements. The subject's responses to the stimulus (pressing a button when seeing a change in fixation at the center of the screen) were monitored and recorded. High-resolution dynamic 3D DMRSI data with ~0.4cc nominal voxel and 92s/volume was acquired before and after the oral administration of the D66-glucose solution 4.The 1H MRI was co-registered with the DMRSI data. Brain tissue segmentation was performed on the T1-weighted image to calculate the fraction of grey matter (GM), white matter (WM) and cerebrospinal Fluid (CSF) for each DMRSI voxel or ROI. The DMRSI data were reconstructed using a SPICE-based processing scheme, which significantly reduced the spectral and temporal fluctuations, while preserving the spatial-spectral-temporal distribution of the original data 3-5. After SPICE processing, the 2H signals of each metabolites of interest at different spatial and time points were converted to the molar concentrations using the corresponding natural abundance water signal as an internal reference after correcting the saturation effect.
RESULTS
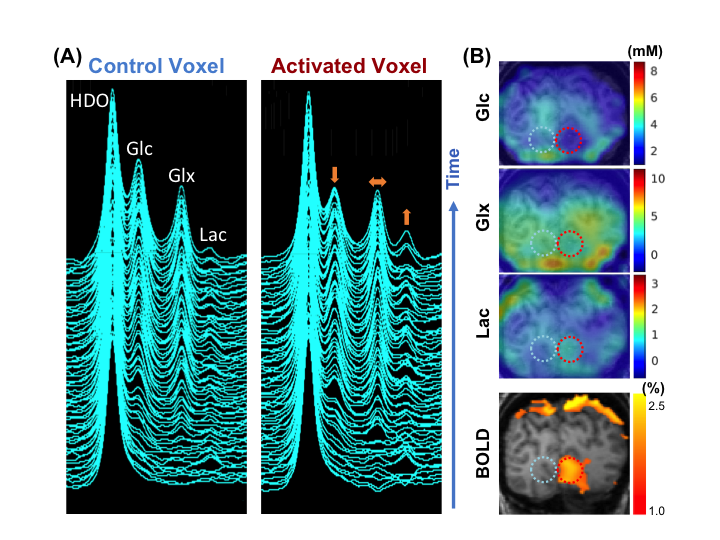
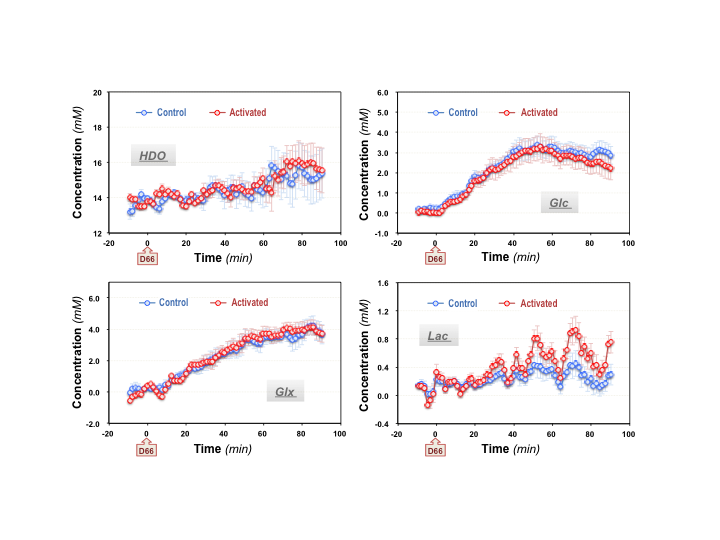
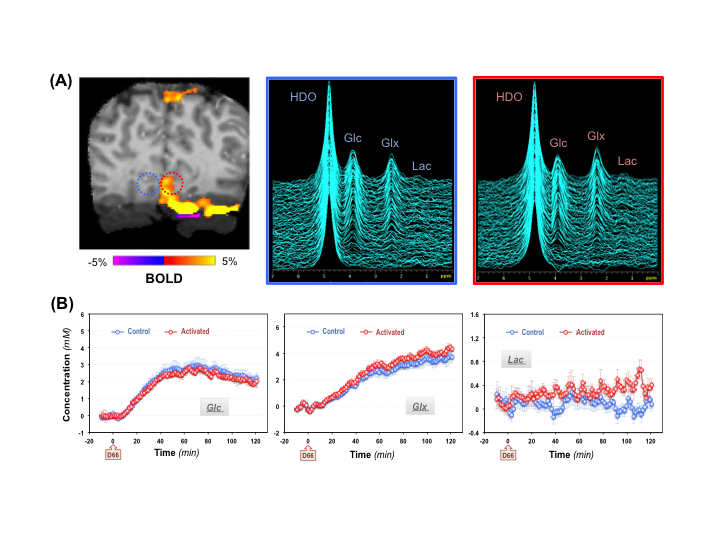
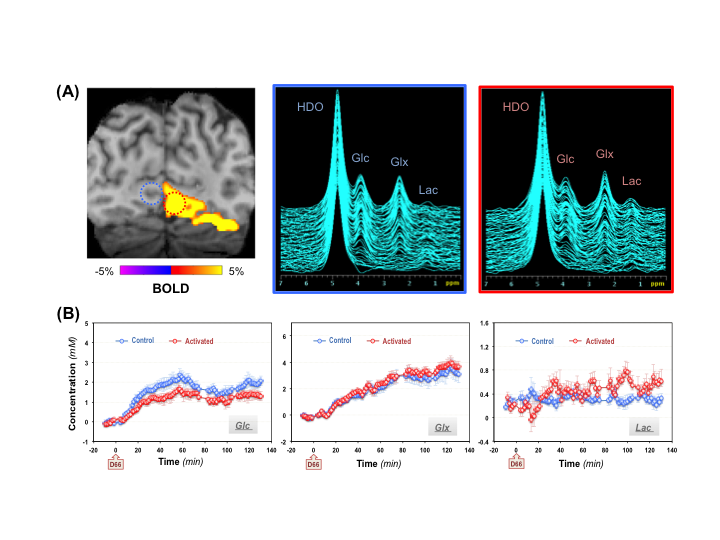
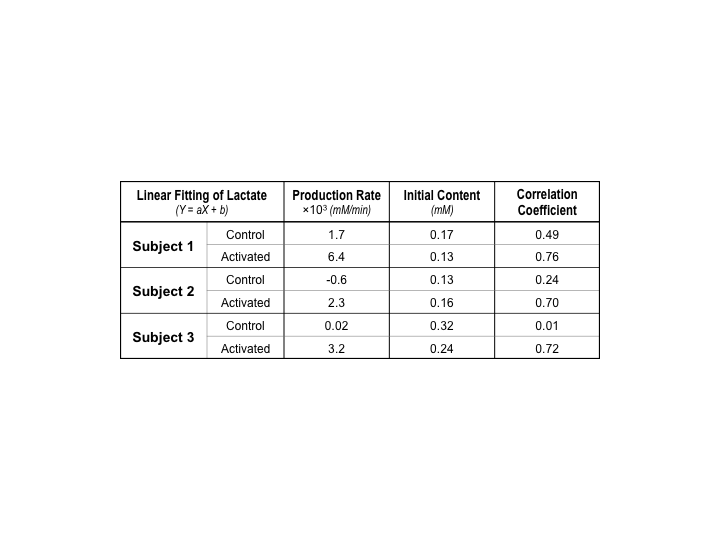
During the functional DMRSI study, all subjects were highly engaged, with ≥88% correct responses to stimuli. Figure 1A displays the stack plots of the 2H spectra from two (control versus activated) voxels located in each hemisphere of the primary visual cortex. Significantly elevated Lac and fast declined Glc signals were seen in the activated voxel. Figure 1B presents the BOLD-fMRI map and concentration maps of deuterated Glc, Glx and Lac at 90min post-d66 administration, clearly showing the reduction in Glc and the increase in Lac in the activated visual cortex. For the same subject, the concentration time courses of 2H-labeled water, Glc, Glx and Lac in control and activated brain ROIs are shown in Fig. 2. Figures 3 and 4 present the results of the 2nd and 3rd subjects. It is noticed that the functional metabolic responses of these subjects had similar trends but were somewhat different.By linear fitting of the deuterated Lac time courses, we estimated the apparent lactate production rates as summarized in Table 1. In the activated visual cortices, we detected the highest Lac production rate in Subject 1, which is 2-3 times of that observed in Subjects 2 and 3. In contrast, the increase of the Glx turnover rate (reflecting the TCA cycle activity) for Subject 2 and 3 is larger than that of Subject 1 (Figs. 2&3B&4B).
DISCUSSION and CONCLUSION
Functional changes of glucose consumption, lactate production and TCA cycle activity in human brain can be measured separately using FDG-PET, 1H and/or 13C MRS techniques, however, these methods are unable to assess the coupling/uncoupling relationship of different glucose metabolic pathways from a single imaging measurement in an individual subject 6-8. In this study, using a newly developed dynamic DMRSI method, we simultaneously observed clear evidence of alterations in glycolysis, TCA cycle activity and Lac production in the activated brain regions with varied degrees in different subjects. The Lac production is negligible in the resting-state cortex, indicating that the majority of Glc is metabolized via oxidative pathways for producing ATP molecules. However, it increases dramatically in the activated cortex, clearly showing the metabolic shifting from oxidative metabolism to aerobic glycolysis during brain activation. Such intertwined changes can be reliably detected in single voxels with a small voxel size (see Figs. 1A&3A&4A). This study provides new insights into the relationship of oxidative phosphorylation and aerobic glycolysis in generating energy to support normal brain function during rest and activation, and shows possible individual variances in metabolic capacities to generate ATP energy in supporting evoked neuronal activity 9.In conclusion, the high-resolution dynamic DMRSI technique provides a powerful neuro-metabolic-imaging tool for studying different aspects of glucose metabolism and metabolic shifting or reprogramming in the human brains under normal and diseased state.
Acknowledgements
NIH Grants: R01 CA240953 and NS118330, U01 EB026978 and P41 EB027061.References
1. Siesjö BK. Book: Brain energy metabolism, John Wiley & Sons, New York, 1978.
2. Lu M, Zhu XH, Zhang Y, Mateescu G and Chen W. Quantitative assessment of brain glucose metabolic rates using in vivo deuterium magnetic resonance spectroscopy. J Cereb Blood Flow Metab, 37:3518-3530 (2017).
3. Li Y et al. Machine Learning-Enabled High-Resolution Dynamic Deuterium MR Spectroscopic Imaging. IEEE Trans Med Imaging doi:10.1109/TMI.2021.3101149 (2021).
4. Zhu XH et al. Differentiating TCA Cycle Activity of Gray and White Matter in Human Brain at 7T Using High Resolution Dynamic Deuterium MRS Imaging with SPICE. in Proc. Intl. ISMRM 30: p. 4840 (2022).
5. Liang ZP. Spatiotemporal imaging with partially separable functions. in 4th IEEE International Symposium on Biomedical Imaging: From Nano to Macro - Proceedings, 2007, pp. 988–991.
6. Fox PT, Raichle ME, Mintun MA and Dence C. Nonoxidative glucose consumption during focal physiologic neural activity. Science 241:462-464 (1988).
7. Prichard J et al. Lactate rise detected by 1H NMR in human visual cortex during physiologic stimulation. Proc Natl Acad Sci U S A 88:5829-5831, doi:10.1073/pnas.88.13.5829 (1991).
8. Dienel GA and Hertz L. Glucose and lactate metabolism during brain activation. J Neurosci Res 66:824-838, doi:10.1002/jnr.10079 (2001).
9. Zhu XH, Lee BY and Chen W. Functional energetic responses and individual variance of the human brain revealed by quantitative imaging of adenosine triphosphate production rates. J Cereb Blood Flow Metab, 38(6):959-972 (2018).
Figures