0012
Evaluation of minimal dosage of deuterated glucose for mapping of hepatic metabolism by DMI and natural abundance carbon-13 spectroscopy at 7 T
Simone Poli1,2, Ahmed F. Emara3, Edona Ballabani3, Naomi F. Lange4,5, Andreas Melmer3, David Herzig3, Luc Tappy3, Lia Bally3, and Roland Kreis1,2
1Magnetic Resonance Methodology, Institute of Diagnostic and Interventional Neuroradiology, University of Bern, Bern, Switzerland, 2Translational Imaging Center, Sitem-insel, Bern, Switzerland, 3Department of Diabetes, Endocrinology, Nutritional Medicine and Metabolism UDEM, Inselspital, University Hospital Bern, Bern, Switzerland, 4Department of Visceral Surgery and Medicine, Inselspital, Bern University Hospital, University of Bern, Bern, Switzerland, 5Graduate School for Health Sciences, University of Bern, Bern, Switzerland
1Magnetic Resonance Methodology, Institute of Diagnostic and Interventional Neuroradiology, University of Bern, Bern, Switzerland, 2Translational Imaging Center, Sitem-insel, Bern, Switzerland, 3Department of Diabetes, Endocrinology, Nutritional Medicine and Metabolism UDEM, Inselspital, University Hospital Bern, Bern, Switzerland, 4Department of Visceral Surgery and Medicine, Inselspital, Bern University Hospital, University of Bern, Bern, Switzerland, 5Graduate School for Health Sciences, University of Bern, Bern, Switzerland
Synopsis
Keywords: Deuterium, Metabolism
We present an estimation of the minimal dose for D-glucose needed for evaluation of hepatic glucose dynamics by deuterium metabolic imaging (DMI) and investigate whether a subsequent change in hepatic glycogen content is observable by 13C-MRS at 7 T. Six healthy subjects received an oral glucose load of 60g, 20g or 10g and were examined with interleaved 2H-MRSI/13C-MRS scans for 150 min. Results suggest the feasibility of reducing D-glucose loads to as low as 10g per subject for hepatic DMI with several benefits ‑ including cost, but precision of determination of changes in hepatic glycogen content is substantially reduced.Introduction
Quantitative non-invasive exploration of hepatic glucose metabolism is of high importance due to its central role in glucose homeostasis and relevance for various metabolic diseases1. Deuterium metabolic imaging (DMI) has emerged as novel tool to dynamically assess the metabolic fate of administered deuterated glucose (and other substrates) in animals2 and humans3. To obtain a comprehensive picture of hepatic carbohydrate metabolism, 13C-MRS has been used to follow glycogen kinetics4. For mapping of orally administered [6,6′-2H2]-glucose (D-Glc) in brain and liver, initial work suggested doses of 60g or 0.75g/kg body weight3. High doses of D-Glc are expensive, potentially challenging to digest (in particular for post-bariatric-surgery patients) and extend the time for gastric emptying (and hence the scan time to cover the entire metabolic processing). Thus, the feasibility of using lower doses of D-Glc for dynamic hepatic glucose mapping is evaluated. Here, we estimate the minimal dose of D-Glc needed for evaluation by hepatic DMI while still allowing determination of ensuing variations of glycogen levels by 13C-MRS. Our project builds on previous work5 focusing on glucose and glycogen turnover using DMI and 13C-MRS with standard doses of D-Glc.Methods
Exams are performed at 7T (Terra, Siemens) with a triple-tuned surface coil (1H: quadrature-driven dual loop, 2H and 13C: linearly driven single loops, outer dimensions: 30x10x30 cm) from Rapid Biomedical. Chromium-doped acetone (8 mL, 1% deuterated) inserted in a vial near the coil center served as external reference.- DMI: conventional 3D-MRSI (0.50 ms rectangular excitation pulse, 0.35 ms phase-encoding gradient, TR 500 ms, 4 acquisitions with acquisition-weighting, 12x12x8 phase encodings, nominal resolution of 18.3x18.3x27.5 mm3, 1000 Hz spectral width, 4:08 min acquisition time). MRI-visible fiducial markers on the coil.
- 13C-MRS: pulse-and-acquire sequence (2 ms hyperbolic-secant-pulse excitation, TR 600 ms, 512 acquisitions, Nuclear-Overhauser-irradiation (fixed voltage, 510 ms), acquisition time 5:08 min).
Data processing and fitting was performed in jMRUI using AMARES6.
Study population according to D-Glc intake: six healthy subjects each received an oral glucose load of either 60 g (0.74 g/kg, 0.73 g/kg), 20 g (0.29 g/kg, 0.21 g/kg) or 10 g (0.16 g/kg, 0.15 g/kg) of D-Glc (in 200 ml of water) to ingest in supine position (i.e. two subjects per dose). Scanning was performed until 150 min after D-Glc intake. Blood sampling was performed for plasma concentration of (enriched) glucose, insulin, glucagon and C-peptide. Subjects underwent 48h of standardized diet and withdrawal from strenuous exercise prior to scanning.
The time courses of D-water and glycogen signals were represented by a linear model, where the starting point was set when the related D-Glc signal reached 25% of the baseline natural abundance water signal (P-values for non-zero slope).
Results and Discussion
Fig-1 shows the spectral quality of DMI at different time points (T0, T30, T60, T150) for three subjects receiving different D-Glc doses. Each spectrum represents the average of 6 voxels in the liver, manually selected close to the coil for optimal signal. The 60 g dose resulted in a hepatic D-Glc signal (3.7 ppm) comparable to the amplitude of water (4.7 ppm) around T60 and remaining visible until the end of the session. For 20 g and 10 g, the maximum D-Glc signal was lower and strongly decreased towards the end of the exam, suggesting a more substantial coverage of Glc digestion. SNR of water of a single voxel spectrum near the center of the coil was ~34 and the linewidths ~21 Hz.Fig-2 shows the time course of the D-Glc signal with a time resolution of 5-10 minutes for D-Glc and D-water for all subjects and doses. Even for 10 g, the signal was well defined and adequate for fitting. For 60 g, a strong increase in the water signal was observed in the second half of the scan time, indicating metabolization into end products of the TCA cycle. For 20 g and 10 g the increase is progressively lower, but still significant even for single subjects.
Fig-3 illustrates the glycogen signal kinetics from 13C-MRS for different doses. While for the 60 g cases we can detect an increase of ~10-15% at the end of the scan5, no significant signal increase is found for individual subjects for lower doses. Quantitative evaluations of the time courses for D-water and glycogen signals are reported in Table-1.
Conclusions
These initial results suggest the feasibility of lowering D-Glc loads to as low as 10 g for kinetic evaluation of hepatic D-Glc by DMI. The benefits are manifold: 1) more complete observation of the whole dynamic of increase and decay to baseline of D-Glc (beneficial for metabolic modeling); 2) reduced cost for agents (from ~1000$ to ~200$); 3) ease of intake (most relevant for post-bariatric surgery patients). However, the observation of the concomitant conversion of glucose to glycogen by natural abundance 13C MRS, necessary to fully understand the metabolic fate of D-Glc, is limited at such low doses to evaluations of larger cohorts. Amelioration of this problem might be possible with the use of denoising for 13C-MRS (potentially also beneficial for DMI) or with substituting some of the deuterated by unlabeled glucose.Acknowledgements
This is project is supported by the Swiss National Science Foundation (PCEGP3_186978) and Diabetes Center Bern. We further acknowledge the support received from the study nurse team (Valérie Brägger, Joana Filipa Rodrigues Cunha Freitas, Sandra Tenisch), Andreas Melmer and Laura Goetschi from the Department of Diabetes, Endocrinology, Nutritional Medicine and Metabolism, Inselspital, Bern University Hospital.References
- Petersen MC, Vatner DF, Shulman GI. Regulation of hepatic glucose metabolism in health and disease. Nat Rev Endocrinol. 2017 Oct; 13(10):572-587.
- Lu M, Zhu XH, Zhang Y, Mateescu G, Chen W. Quantitative assessment of brain glucose metabolic rates using in vivo deuterium magnetic resonance spectroscopy. J Cereb Blood Flow Metab. 2017 Nov; 37(11):3518-3530.
- De Feyter HM, Behar KL, Corbin ZA, et al. Deuterium metabolic imaging (DMI) for MRI-based 3D mapping of metabolism in vivo. Sci Adv. 2018; 4(8):eaat7314.
- Buehler T, Bally L, Dokumaci AS, Stettler C, Boesch C. Methodological and physiological test-retest reliability of (13) C-MRS glycogen measurements in liver and in skeletal muscle of patients with type 1 diabetes and matched healthy controls. NMR Biomed. 2016 Jun; 29(6):796-805.
- Poli S, Emara AE, Ballabani E, Buser A, Tappy L, Bally L, and Kreis R. Interleaved 1H-MRI, 2H-MRSI and 13C-MRS for time-resolved in vivo elucidation of glucose metabolism in human liver at 7 T. ISMRM; 2022.
- Vanhamme L, van den Boogaart A, Van Huffel S. Improved method for accurate and efficient quantification of MRS data with use of prior knowledge. J Magn Reson. 1997 Nov;129(1):35-43.
Figures
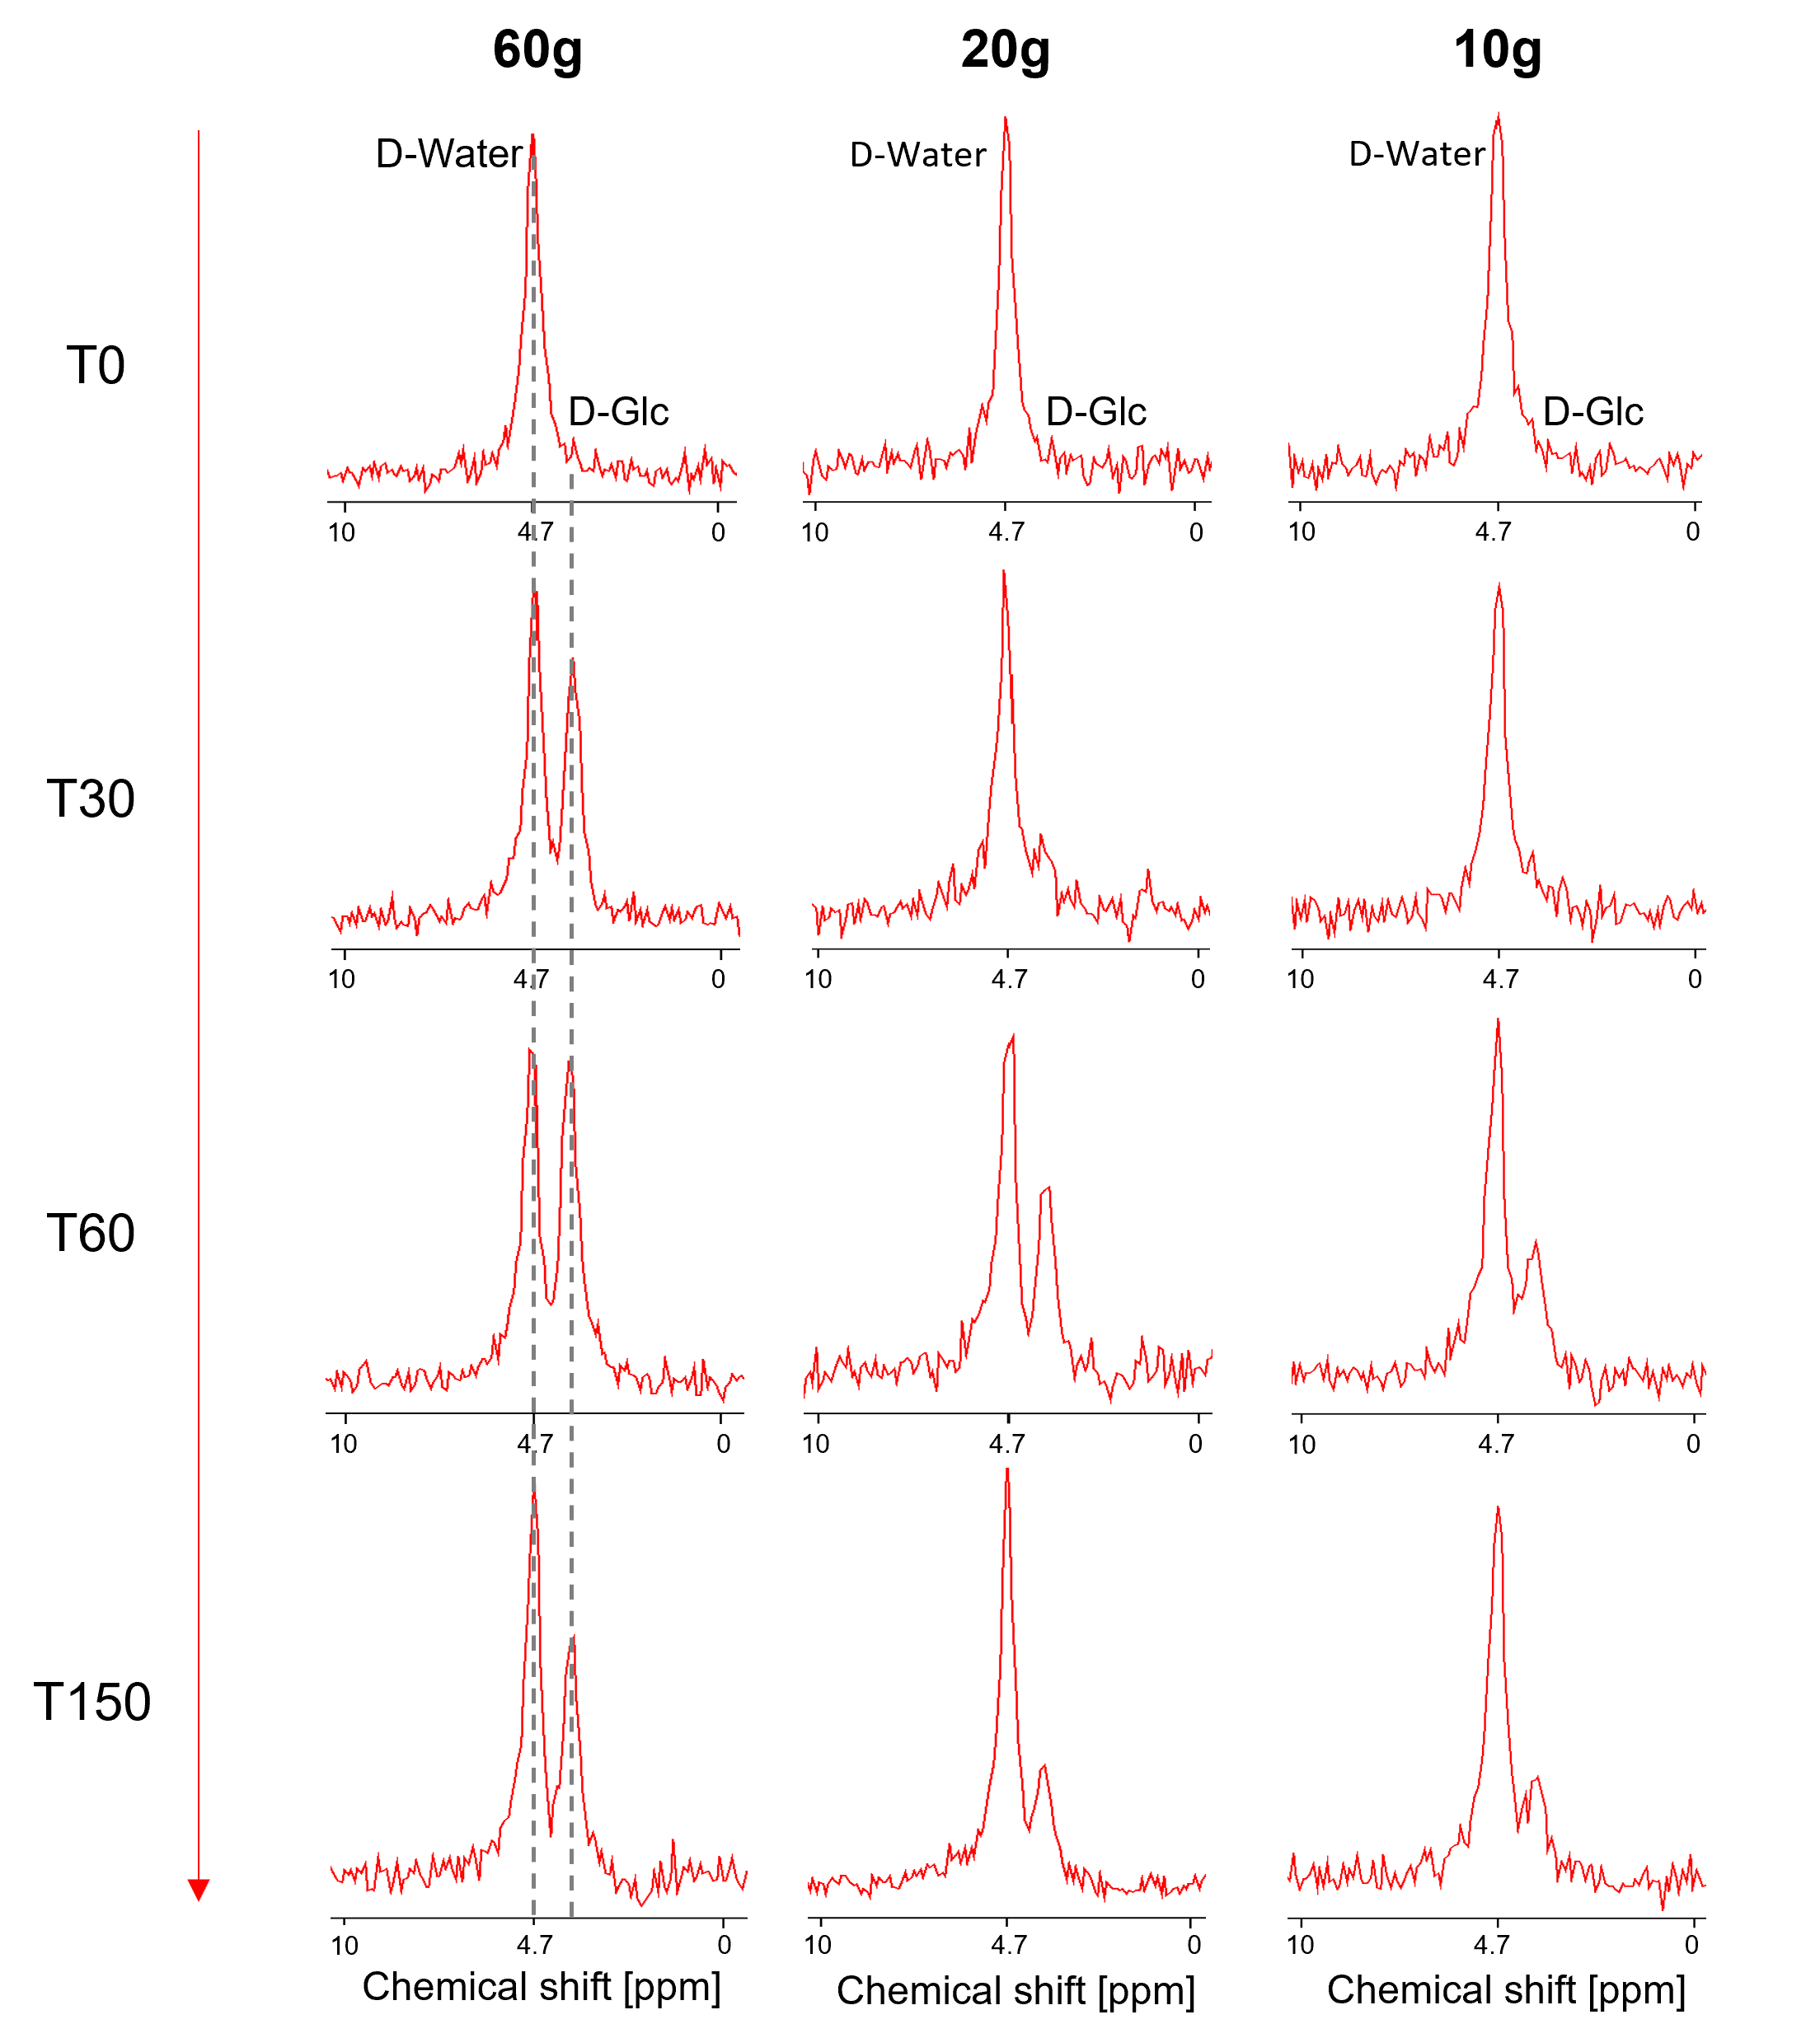
2H-MRSI spectra from DMI datasets of one subject
per D-Glc dose at selected time points before and up to 150 min after Glc
ingestion (T0 corresponds to the time of Glc intake with the spectrum recorded
before intake).
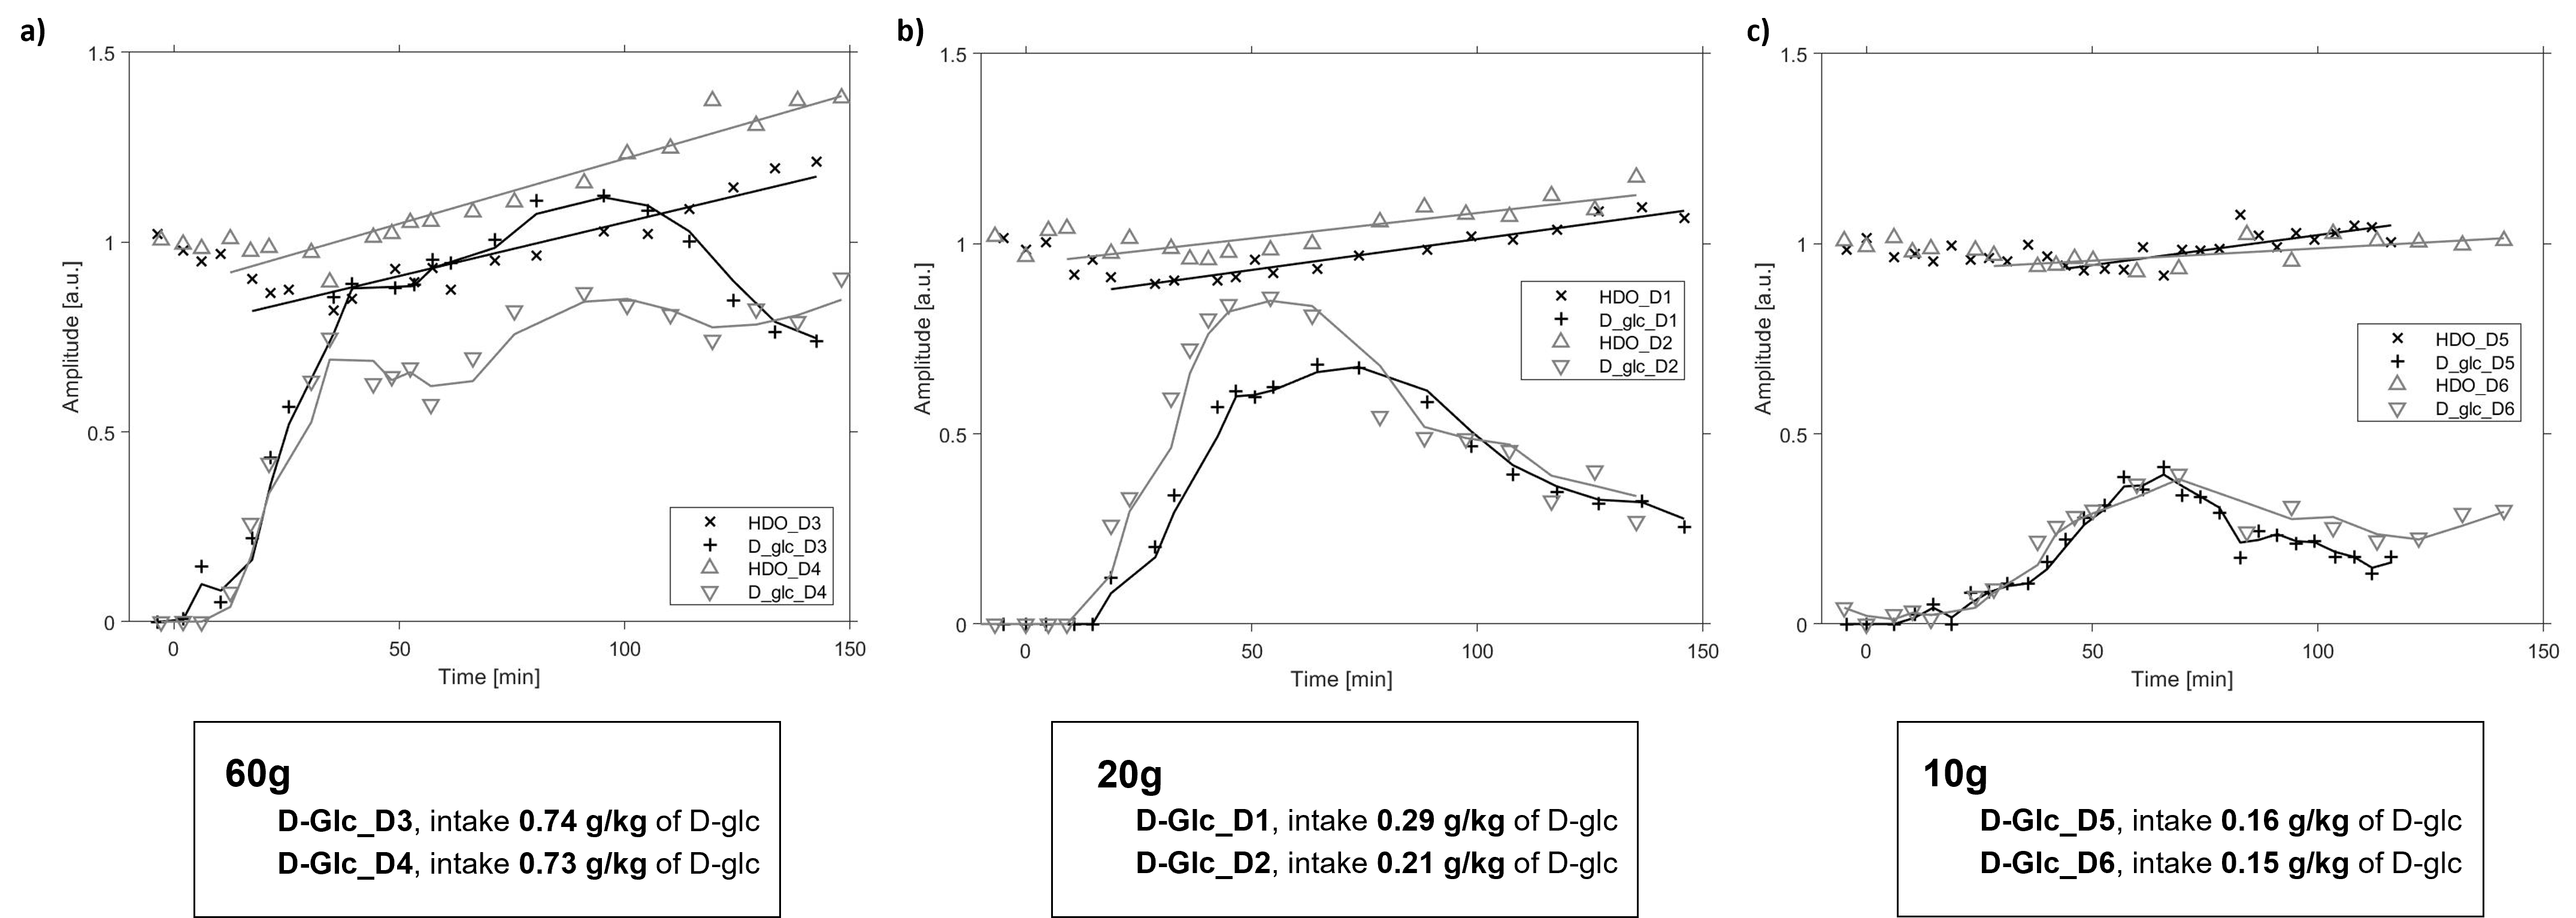
Time courses for hepatic D-Glc and D-water
normalized by the initial D-water baseline signal for two subjects per dose: a)
60 g, b) 20 g, c) 10 g. The smooth lines represent the moving
average for D-Glc. A linear signal increase is modeled for D-water, starting
when the D-Glc signal is 25% of the initial D-water signal. D-glc intake is reported based on
body weight for each subject.
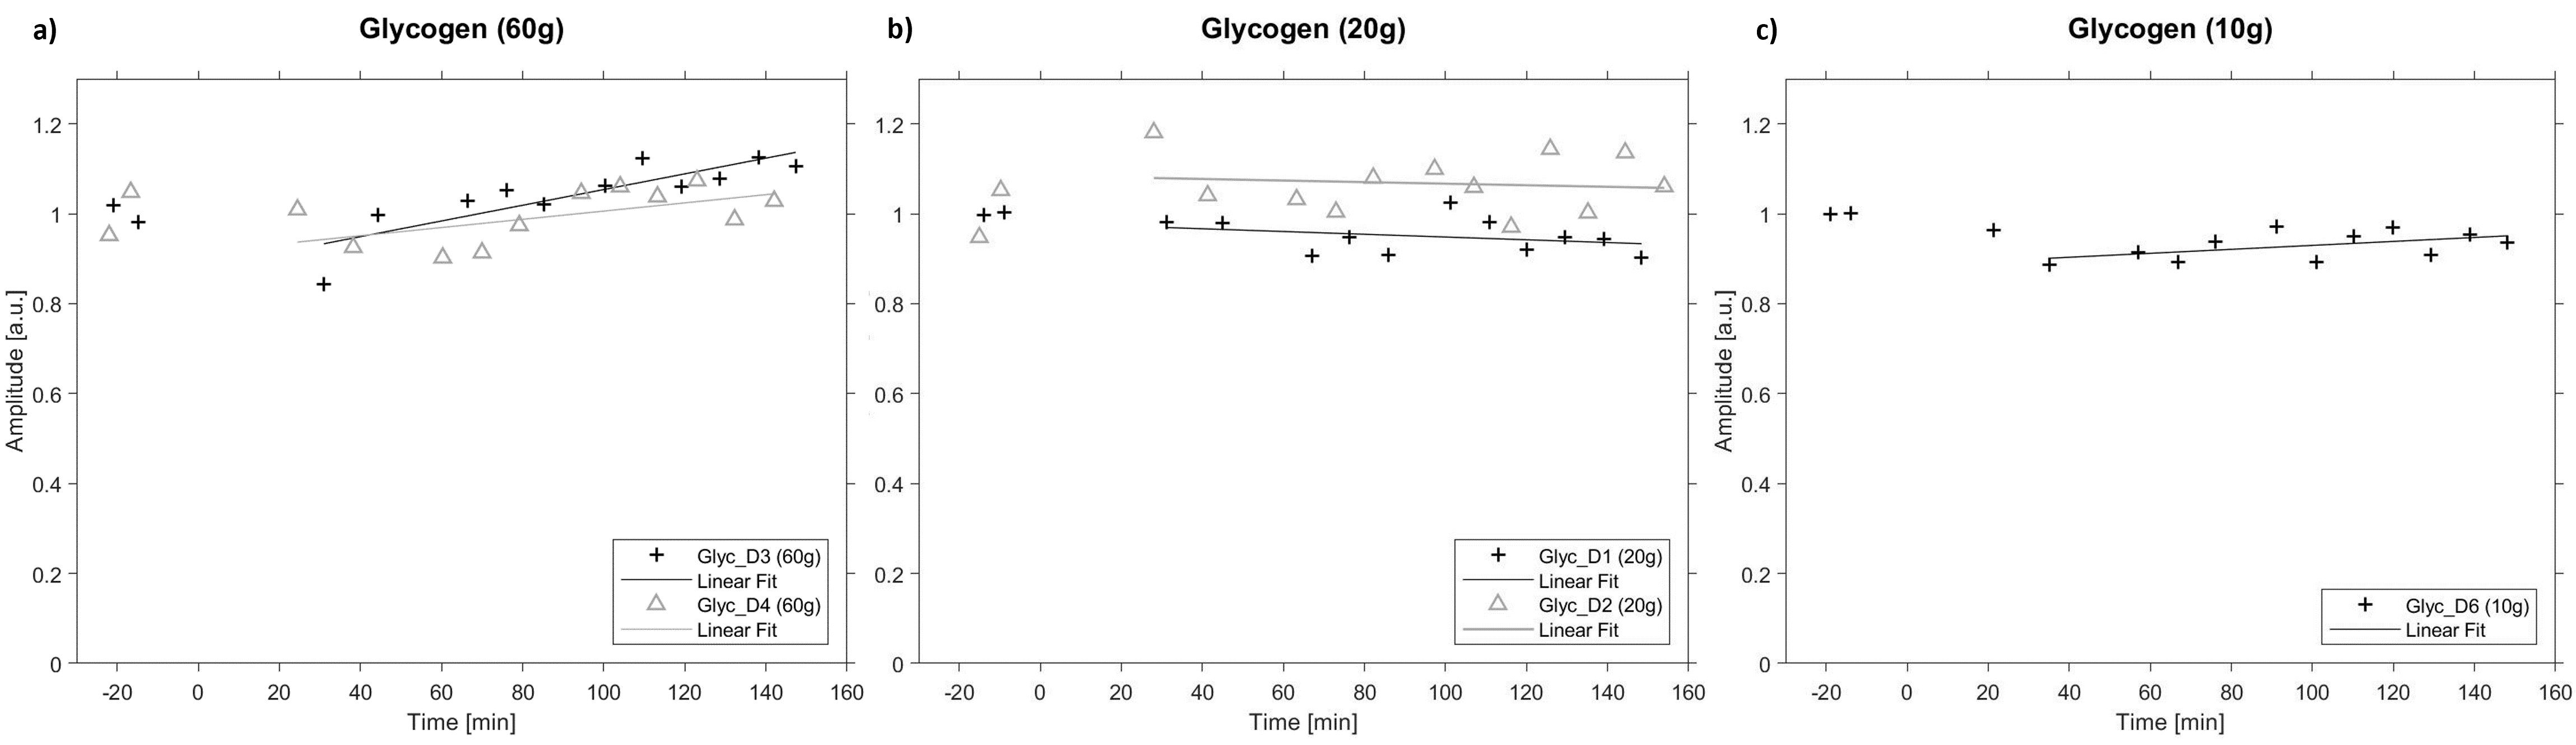
Time courses for hepatic glycogen signal (scaled
to 1 for the pre-load amplitude) for two subjects for a) 60 g and b)
20 g dose and one subject for c) 10 g dose. The lines represent the linear
model for glycogen, starting at the same time point as in Fig.2, i.e. based on
the hepatic D-Glc signal amplitude.
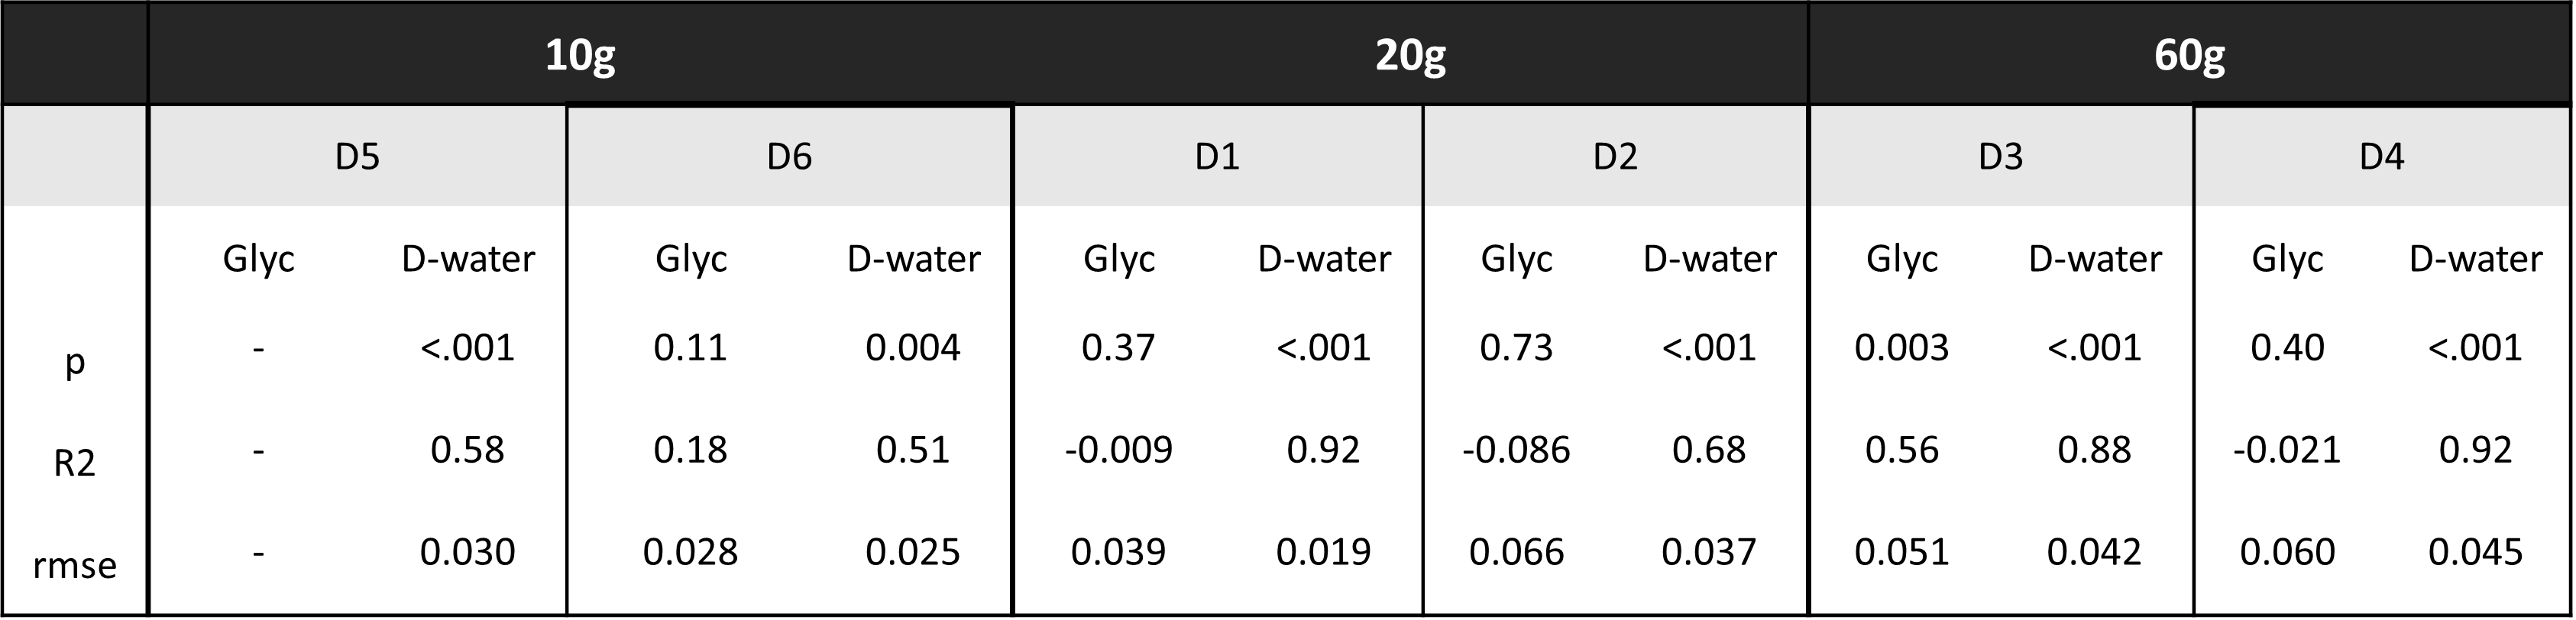
Model
parameters and statistics for the time course of D-water (a) and glycogen (b). P-values
indicate significance vs. the null hypothesis of a constant signal; R2
is adjusted for the number of variables and RMSE (in units of the preload
amplitudes) represent the root mean square errors for the linear model with
start time when D-Glc reaches 25% of the initial water signal.
DOI: https://doi.org/10.58530/2023/0012