0011
Reproducibility of non-invasive 3D imaging of glucose downstream metabolism using deuterium labeling: indirect 1H QELT at 3T vs direct 2H DMI at 7T1Department of Biomedical Imaging and Image-Guided Therapy, Medical University of Vienna, Vienna, Austria, 2Centre for Functional and Diagnostic Imaging and Research, Danish Research Centre for Magnetic Resonance, Copenhagen, Denmark, 3Department of Radiology, University Hospital Amager and Hvidovre, Copenhagen, Denmark, 4Department of Neurosurgery, Medical University of Vienna, Vienna, Austria, 5Department of Medicine III, Division of Endocrinology and Metabolism, Medical University of Vienna, Vienna, Austria, 6Department of Psychiatry and Psychotherapy, Comprehensive Center for Clinical Neurosciences and Mental Health (C3NMH), Medical University of Vienna, Vienna, Austria
Synopsis
Keywords: Deuterium, Brain
Deuterium metabolic imaging (DMI) and quantitative exchange label turnover (QELT) are emerging MR techniques to non-invasively map brain glucose uptake and downstream metabolism using safe and affordable deuterium labeled glucose as tracer. This work compares dynamically detected deuterium labeled Glutamate+Glutamine time courses between three-dimensional 3T-1H QELT-MRSI and 7T-2H-DMI using quantification of concentration estimates. Comparable enrichment of deuterated Glx could be observed in gray matter (1.59±0.24mM vs. 1.39±0.17mM) while differences were found in WM (0.89±0.32 mM vs. 1.31±0.2 mM) presumably due to partial volume contamination. Results showed a successful translation of QELT to clinical 3T.Introduction
Non-invasive and reliable imaging of brain glucose (Glc) metabolism is of particular interest for clinical research and application, as metabolic impairment is present in many pathologies, such as cancer, diabetes and Alzheimer’s disease (1-3). FDG-PET as the current gold standard for imaging of glucose uptake does not provide information on downstream metabolism such as neurotransmitter synthesis and requires injection of radioactive and unstable tracer (4). Deuterium metabolic imaging (DMI) and quantitative exchange label turnover (QELT) are novel MR techniques to non-invasively image Glc uptake and downstream metabolism e.g. glutamate (Glu), glutamine (Gln) and lactate synthesis in the human brain using deuterium labeled Glc as harmless, and stable tracer (5-11). DMI detects deuterium enrichment directly via 2H MRSI using dual-tuned coils, while QELT detects a decrease of signal amplitudes in conventional 1H MR spectra without additional hardware, due to deuterium-to-proton exchange in the respective molecule.The purpose of this study was to translate QELT MRSI to clinical 3T and compare the dynamics of deuterium labeled Glx (Glu+Gln) enrichment in the human brain between 3D 1H QELT MRSI and 3D 2H DMI on 3T and 7T, respectively, using quantification of concentration estimates.Methods
The study was approved by the local ethics committee and participants gave written informed consent. Five healthy volunteers (4m/1f) were scanned twice on separate days after overnight fasting and oral [6,6’]-2H glucose administration (0.8 g/kg body weight) on clinical 3T (Prisma-fit) and experimental 7T (Terra dot Plus) Siemens MR systems. 3T QELT was performed using dynamic real-time-motion-, shim- and frequency-corrected three-dimensional FID 1H-MRSI with concentric ring trajectory readout (12) and a 64-channel head coil (Siemens, Erlangen Germany). Over ∼60 min metabolic-maps of Glx and total creatine (tCr) were acquired every ∼4 min with ∼0.22 ml isotropic resolution (TR=960 ms, TE=0.8ms, FOV: 200x200x130, Nmaps=14). 7T DMI was performed using three-dimensional FID-MRSI with weighted phase encoding and a 32-channel head coil (Nova Medical Group). Metabolic maps of Glx and deuterated water (D2O) were acquired every ∼7 min with ∼2 ml isotropic resolution (TR=290 ms, TE=1.5ms, FOV: 200x200x175, 2 averages, Nmaps=10). Data reconstruction and spectral fitting was performed with an in-house developed post processing pipeline (MATLAB R2021, LCModel, Python3.10)(13,14). Glx signal evolution due to deuterium-to-proton exchange (decreasing in 3T-QELT, increasing in 7T-DMI) was linearly fitted over regional mean (gray and white matter) and over all subjects. Absolute quantification was performed using tCr and D2O as internal reference for 3T-QELT and 7T-DMI, respectively, assuming relaxation times and concentrations of internal references from literature (1H T1: tCrGM/WM= 1.46 s/1.24s, GlxGM/WM= 1.27s/1.24s, T2: tCrGM/WM = 201ms/198ms, GlxGM/WM= 134ms/148ms, M(abs)-GM/WM=7.5mM/5.7mM; 2H D2OT1/T2=350ms/30ms, GlxT1/T2=150ms/40ms) (15-18).Results
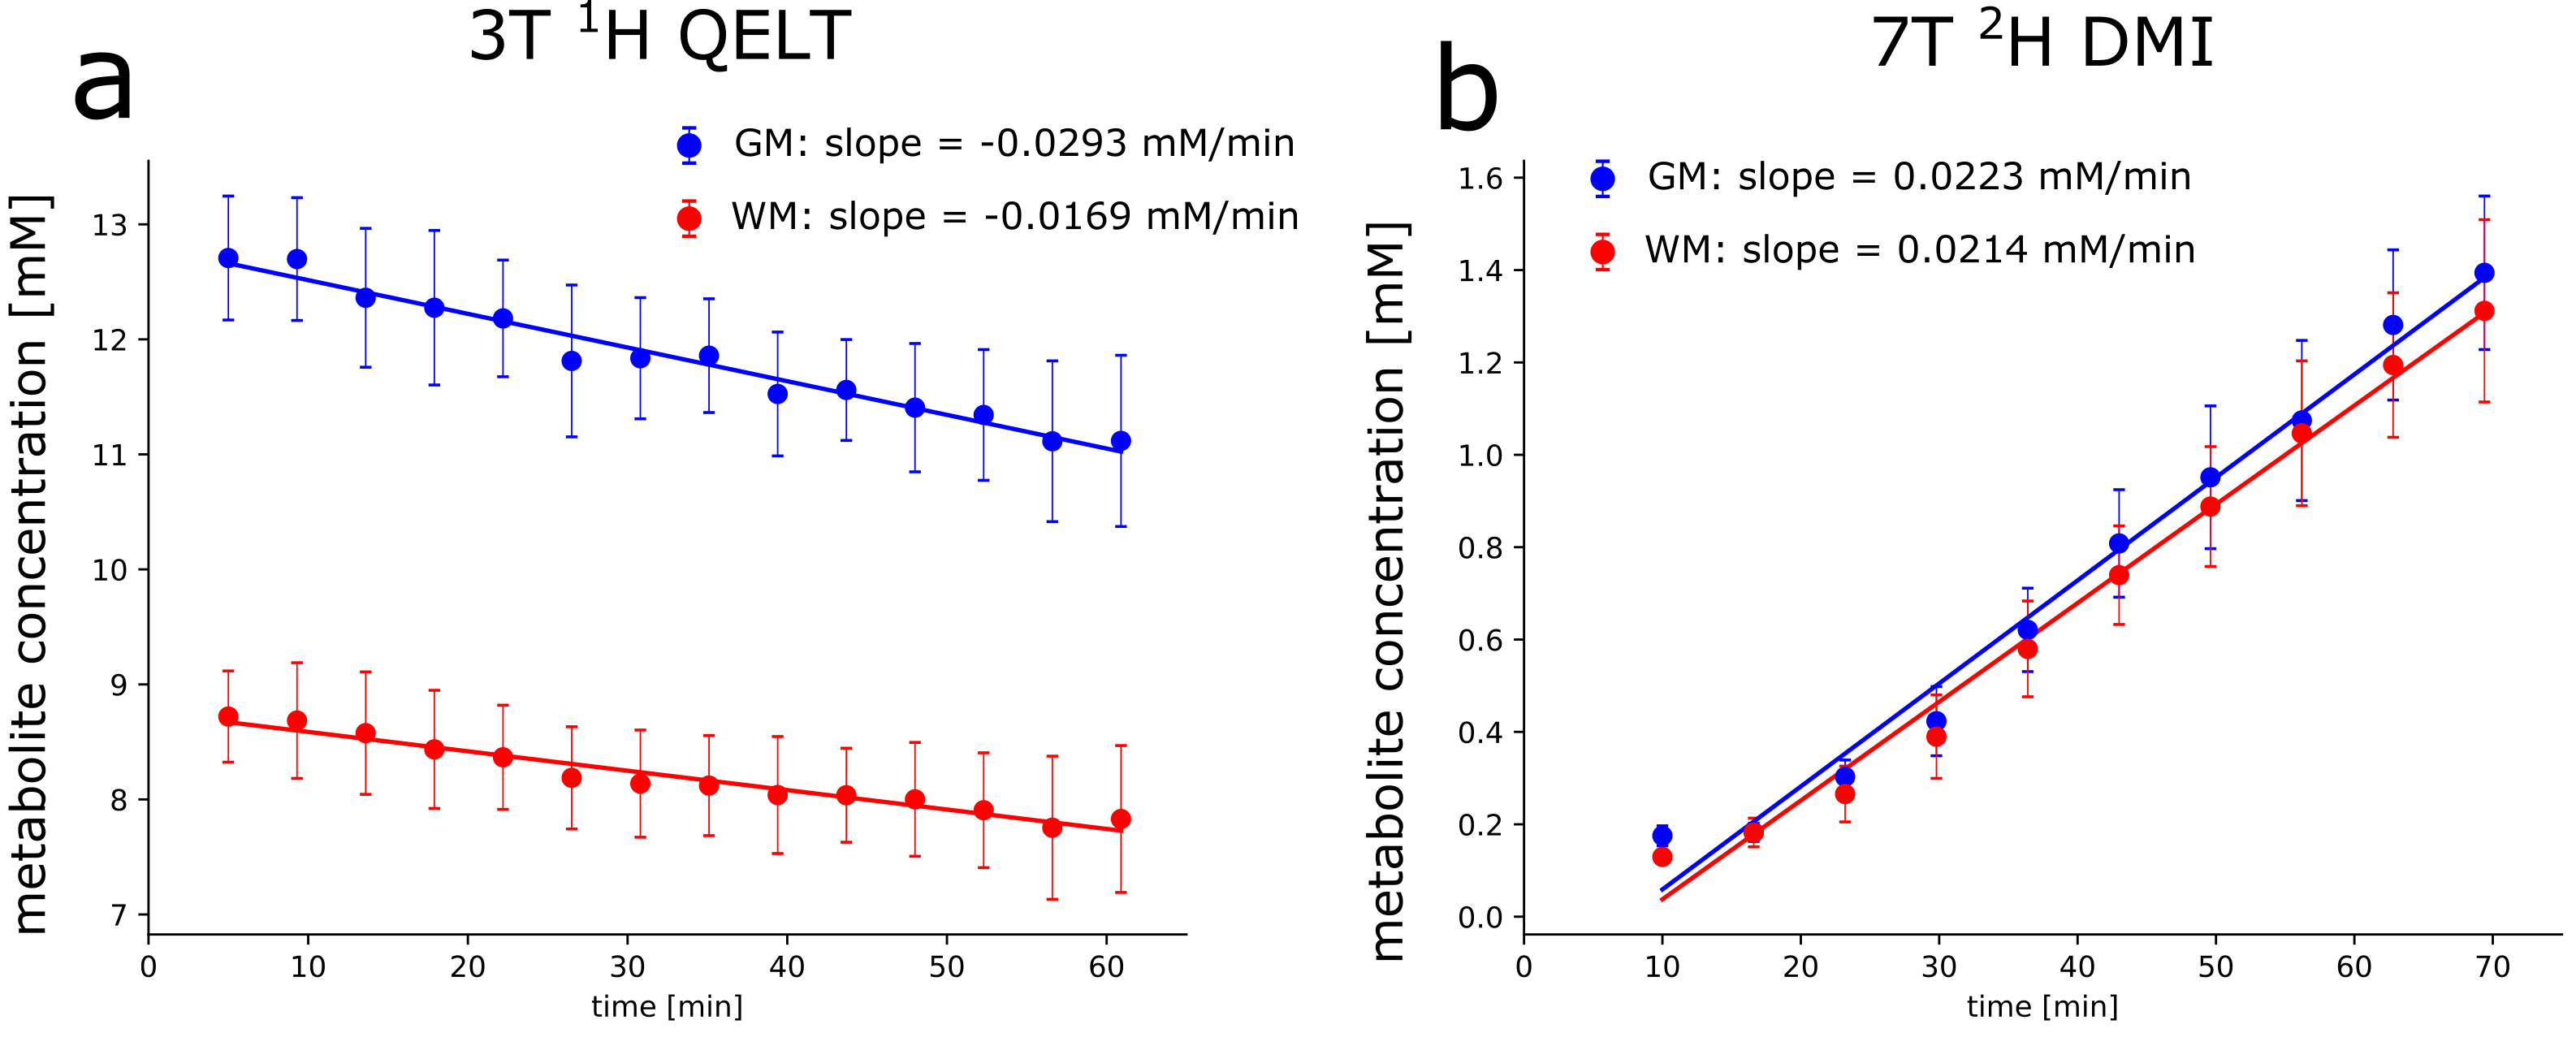
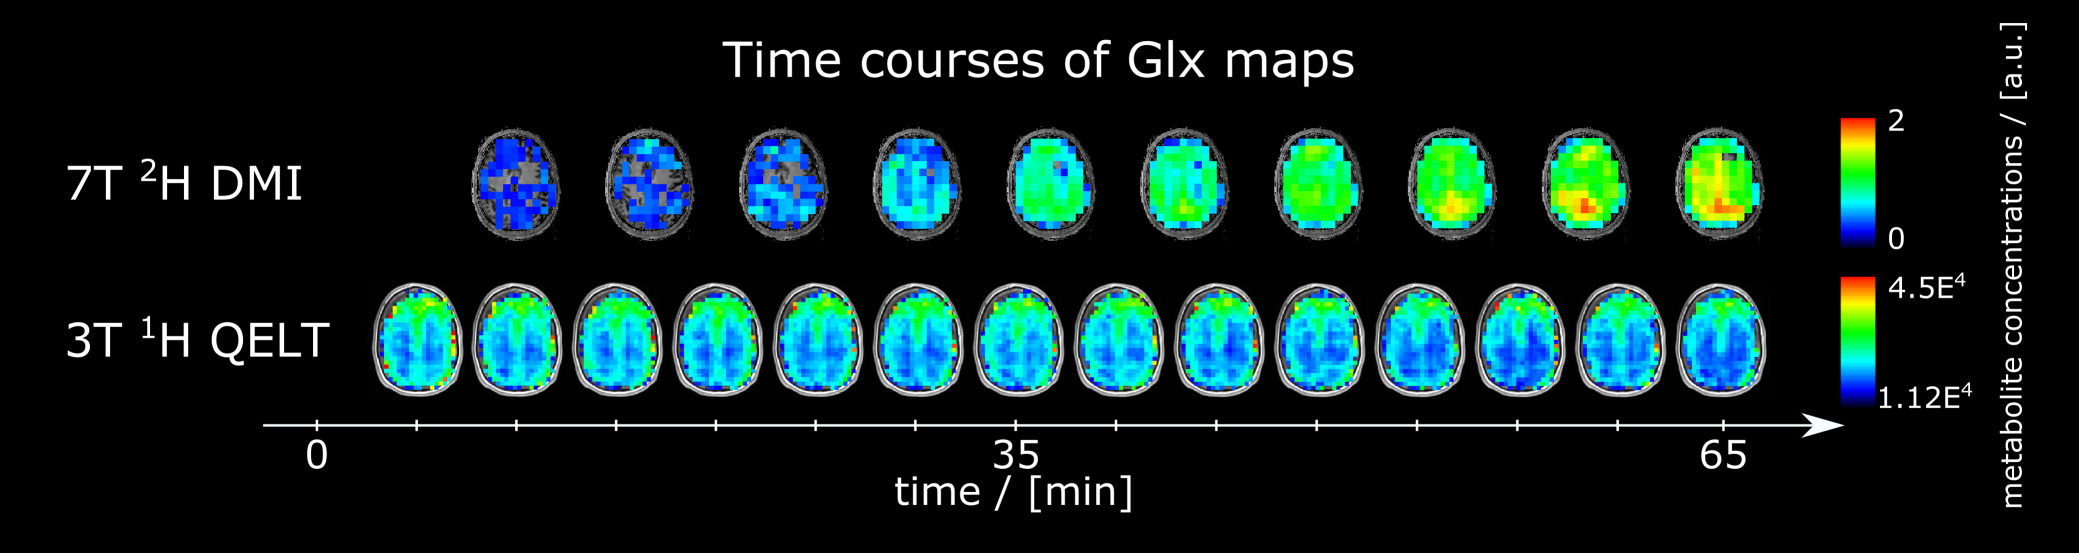
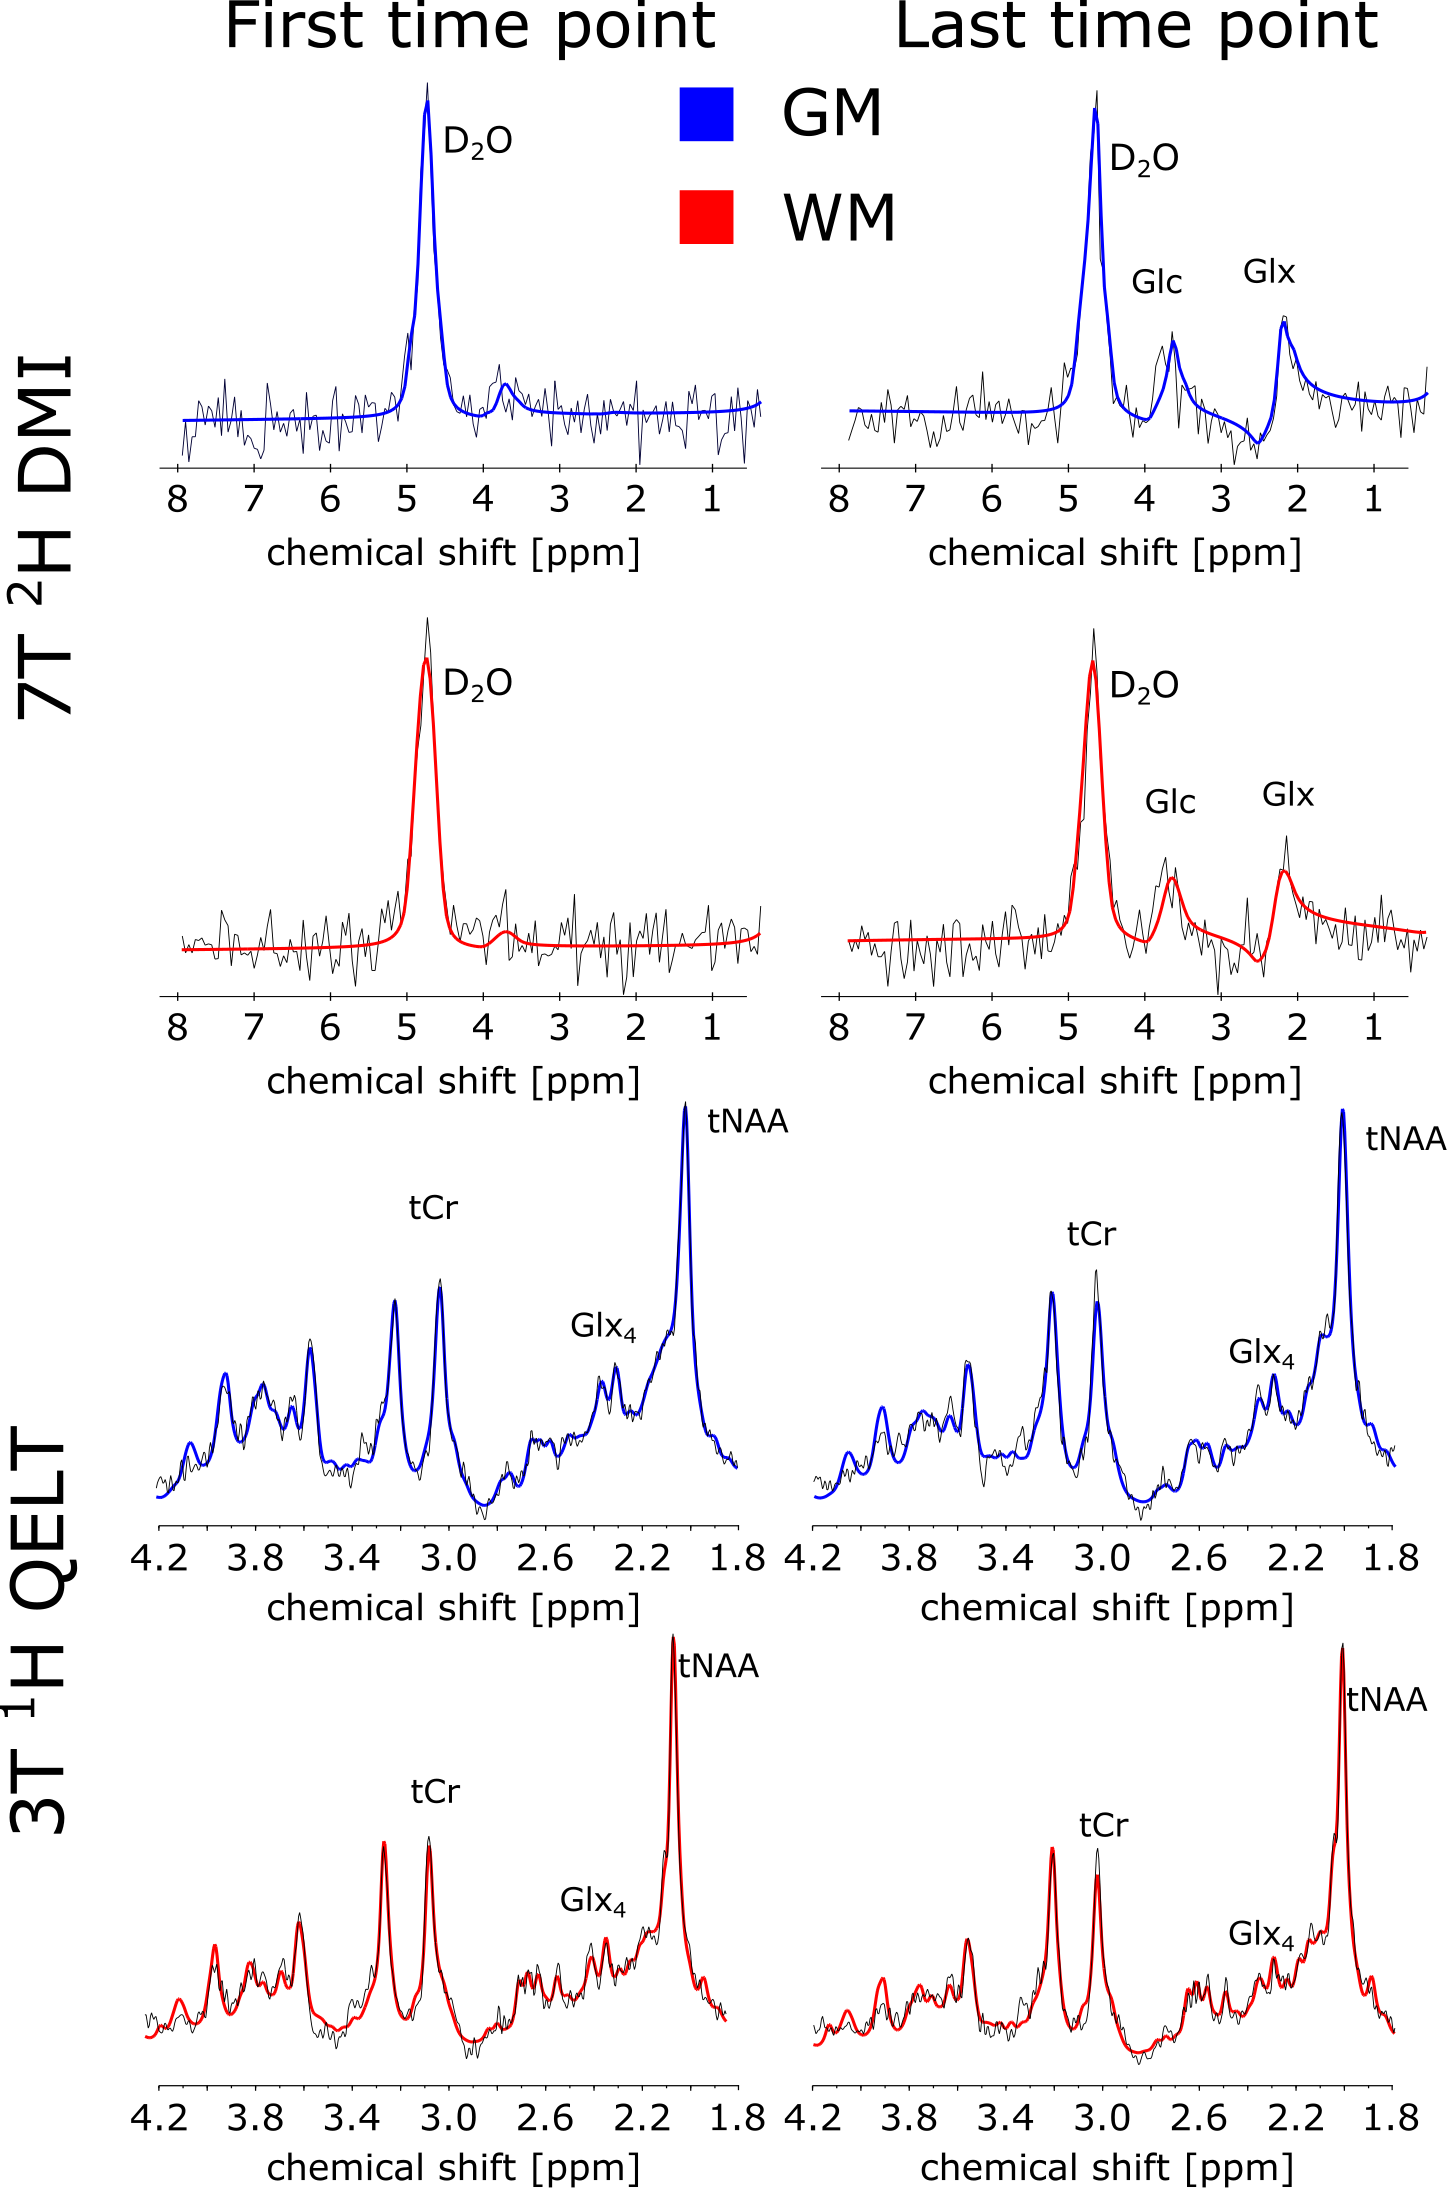
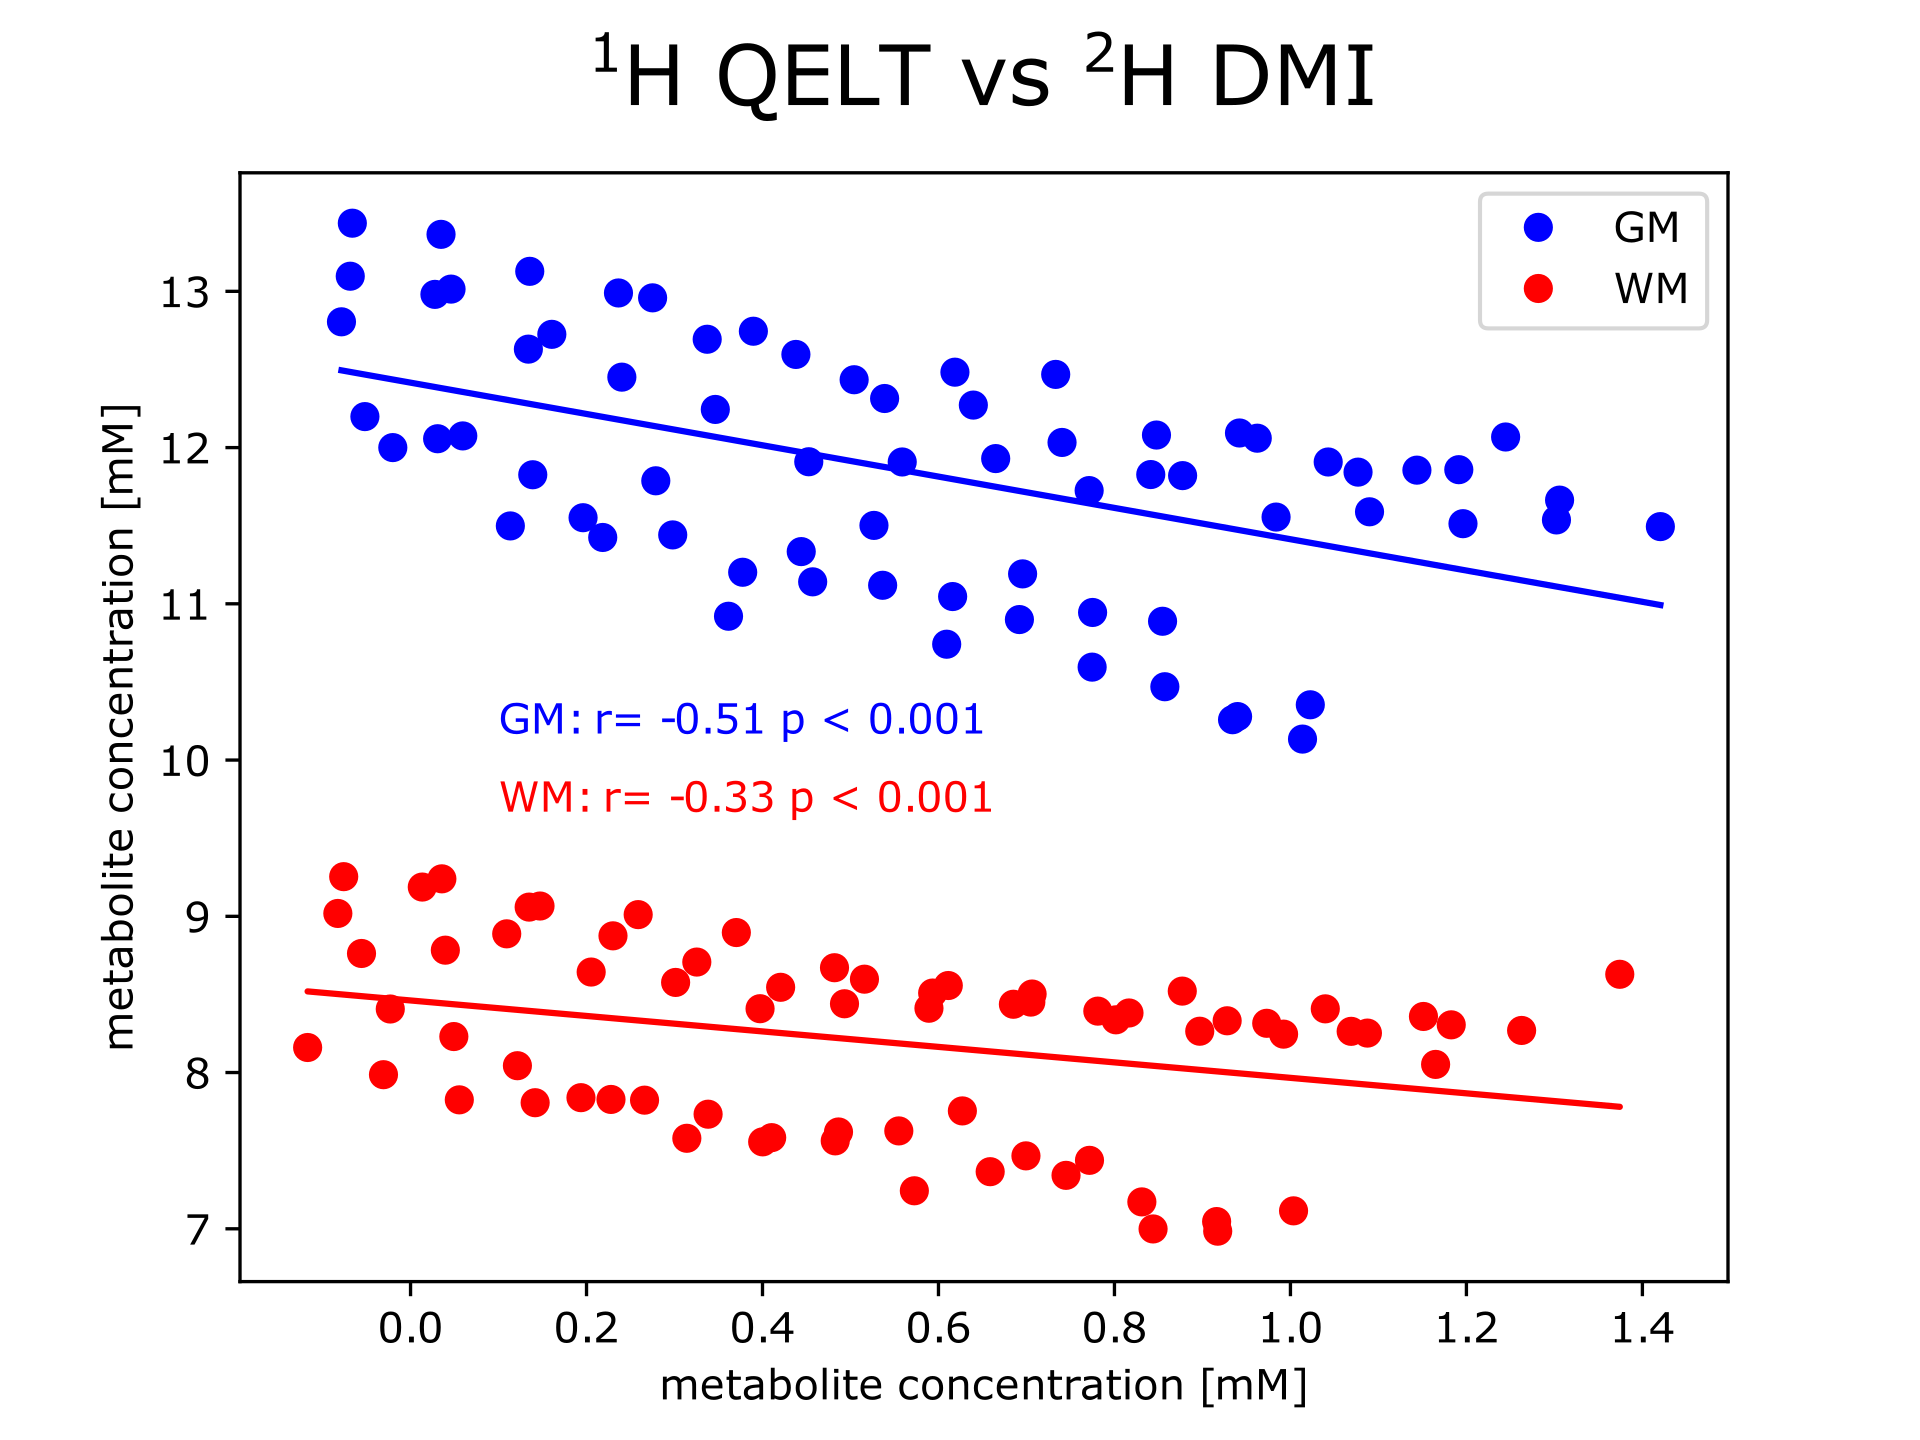
3T QELT data showed a statistically significant decrease of Glx (p<0.01) over time in both gray (GM) and white matter (WM) with -0.0293 mM/min and -0.0166 mM/min, respectively. 65 min after [6,6’]-2H glucose administration Glx concentrations decreased by 1.59±0.24 mM and 0.89±0.32 mM in GM and WM, respectively, see Figure 1a. Similarly, in 7T DMI data Glx concentrations significantly (p<0.01) increased in GM and WM with 0.0223 mM/min and 0.0214 mM/min after 66 min to 1.39±0.17 mM and 1.31±0.2 mM, respectively, see Figure 1b. Time course of axial Glx maps from 3T QELT and 7T DMI data of one representative volunteer are shown in Figure 2. Sample spectra and LCModel fits of the first and last time point from representative single GM and WM voxels are shown in Figure 3. Weak (r=-0.33, p<0.01) to moderate (r=-0.51, p<0.01) correlations between decreasing QELT and increasing DMI of Glx were found in WM and GM, respectively see Figure 4.Discussion and Conclusion
In this study we presented a successful translation of the 1H QELT MRSI method to clinical 3T and compared dynamic Glx time courses with 2H DMI data acquired at 7T using absolute quantification. While in GM the absolute decrease of Glx after ∼65 min between 1H QELT and 2H DMI data is comparable with 14% higher enrichment in 1H QELT data (-1.59 mM vs 1.39 mM), WM shows 50 % higher enrichment in 2H-DMI data (-0.89 mM vs. 1.31 mM), which could be explained by partial volume contamination due to lower resolution of 2H DMI (0.21 ml vs. 2 ml). This is supported by the fact, that metabolic activity is similar between GM and WM in 2H DMI data, although literature reports faster metabolic activity in GM(19-22). Higher Glx concentrations and faster metabolic activity (73%) in GM vs. WM detected by 1H QELT MRSI at 3T is in good agreement with literature. This study demonstrates the feasibility of 1H QELT MRSI on clinical 3T to non-invasively image oxidative glucose downstream metabolism without additional hardware. Quantified concentration estimates were in good agreement with literature and comparable with DMI data acquire from the same cohort of subjects at 7T.Acknowledgements
Funding:
Austrian Science Fund WEAVE I 6037
NIH R01EB031787
PB was supported by the European Union’s Horizon 2020 research and innovation program under a Marie Skłodowska-Curie grant agreement, no. 846793, and by a NARSAD Young Investigator Grant from the Brain and Behavior Research Foundation, no. 27238.
References
1. Koppenol WH, Bounds PL, Dang CV. Otto Warburg's contributions to current concepts of cancer metabolism. Nat Rev Cancer 2011;11(5):325-337.
2. Manji H, Kato T, Di Prospero NA et al. Impaired mitochondrial function in psychiatric disorders. Nature Reviews Neuroscience 2012;13(5):293-307.
3. Norat P, Soldozy S, Sokolowski JD et al. Mitochondrial dysfunction in neurological disorders: Exploring mitochondrial transplantation. NPJ Regen Med 2020;5(1):22.
4.Kumar M, Nanga RPR, Verma G,et al. Emerging MR Imaging and Spectroscopic Methods to Study Brain Tumor Metabolism. Front Neurol 2022;13:789355.
5. Bednarik P, Goranovic D, Svatkova A et al. Deuterium labeling enables non-invasive 3D proton MR imaging of glucose and neurotransmitter metabolism in the human brain at 7T. Nat Biomed Eng 2022.
6. Cember ATJ, Wilson NE, Rich LJ et al. Integrating (1)H MRS and deuterium labeled glucose for mapping the dynamics of neural metabolism in humans. Neuroimage 2022;251:118977.
7. De Feyter HM, Behar KL, Corbin ZAet al. Deuterium metabolic imaging (DMI) for MRI-based 3D mapping of metabolism in vivo. Sci Adv 2018;4(8):eaat7314.
8. Kaggie JD, Khan AS, Matys T et al. Deuterium metabolic imaging and hyperpolarized (13)C-MRI of the normal human brain at clinical field strength reveals differential cerebral metabolism. Neuroimage 2022;257:119284.
9. Rich LJ, Bagga P, Wilson NE et al. (1)H magnetic resonance spectroscopy of (2)H-to-(1)H exchange quantifies the dynamics of cellular metabolism in vivo. Nat Biomed Eng 2020;4(3):335-342.
10. Ruhm L, Avdievich N, Ziegs T et al. Deuterium metabolic imaging in the human brain at 9.4 Tesla with high spatial and temporal resolution. Neuroimage 2021;244:118639.
11. Ruhm L, Ziegs T, Wright AM et al. Dynamic observation of <sup>2</sup>H labeled compounds in the human brain with <sup>1</sup>H versus <sup>2</sup>H magnetic resonance spectroscopy at 9.4T. bioRxiv 2022:2022.2001.2024.477582.
12. Moser P, Eckstein K, Hingerl L et al. Intra-session and inter-subject variability of 3D-FID-MRSI using single-echo volumetric EPI navigators at 3T. Magn Reson Med 2020;83(6):1920-1929.
13. Povazan M, Hangel G, Strasser B et al. Mapping of brain macromolecules and their use for spectral processing of (1)H-MRSI data with an ultra-short acquisition delay at 7 T. Neuroimage 2015;121:126-135.
14. Strasser B, Chmelik M, Robinson SD et al. Coil combination of multichannel MRSI data at 7 T: MUSICAL. NMR Biomed 2013;26(12):1796-1805.
15. Choi C, Coupland NJ, Bhardwaj PP et al. T2 measurement and quantification of glutamate in human brain in vivo. Magn Reson Med 2006;56(5):971-977.
16. De Feyter HM, de Graaf RA. Deuterium metabolic imaging - Back to the future. J Magn Reson 2021;326:106932.
17. Gasparovic C, Song T, Devier D et al. Use of tissue water as a concentration reference for proton spectroscopic imaging. Magn Reson Med 2006;55(6):1219-1226.
18. Mlynarik V, Gruber S, Moser E. Proton T (1) and T (2) relaxation times of human brain metabolites at 3 Tesla. NMR Biomed 2001;14(5):325-331.
19. Hyder F, Fulbright RK, Shulman RG, Rothman DL. Glutamatergic function in the resting awake human brain is supported by uniformly high oxidative energy. J Cereb Blood Flow Metab 2013;33(3):339-347.
20. Hyder F, Rothman DL. Quantitative fMRI and oxidative neuroenergetics. Neuroimage 2012;62(2):985-994.
21. Yu Y, Herman P, Rothman DL, Agarwal D, Hyder F. Evaluating the gray and white matter energy budgets of human brain function. J Cereb Blood Flow Metab 2018;38(8):1339-1353.22. Pan JW, Stein DT, Telang F, Lee JH, Shen J, Brown P, Cline G, Mason GF, Shulman GI, Rothman DL, Hetherington HP. Spectroscopic imaging of glutamate C4 turnover in human brain. Magn Reson Med 2000;44(5):673-679.
Figures