0010
In Vivo Assessment of β-Hydroxybutyrate Metabolism in Mouse Brain Using Deuterium (2H) Magnetic Resonance Spectroscopy1Department of Radiology, Perelman School of Medicine, University of Pennsylvania, Philadelphia, PA, United States, 2Department of Psychiatry, Perelman School of Medicine, University of Pennsylvania, Philadelphia, PA, United States, 3Department of Neurology, Perelman School of Medicine, University of Pennsylvania, Philadelphia, PA, United States
Synopsis
Keywords: Spectroscopy, Deuterium, , 2H-MRS, Brain, TCA, Metabolism
Impaired neurometabolism is often attributed to altered TCA flux (VTCA). Since, β-hydroxybutyrate metabolism bypasses glycolytic flux, it can be better used to monitor VTCA. In the current study, [3,4,4,4]-2H4-β-hydroxybutyrate was infused in 6-month-old mice, and the level of [4,4]-2H2-Glx was monitored using 2H-MRS. A kinetic model was fitted to determine the rate of BHB metabolism (CMRBHB) and VTCA. Glx labeling followed a sigmoidal curve to reach a quasi-steady state concentration (~1.6±0.1 mM) in 30 minutes. CMRBHB and VTCA were determined to be 0.054±0.004 and 0.12±0.01 µM/g/min. In conclusion, this method can be used to monitor neurometabolism in health and disease.Introduction
Impaired brain energy metabolism has been consistently observed in different neurodegenerative1 and neuropsychiatric disorders2,3, due to impaired glucose transport, glycolysis, tricarboxylic acid (TCA) cycle flux (VTCA)2 or oxidative phosphorylation (oxphos). In various neurodegenerative diseases4-7 a decoupling between these events has been reported. At the same time, metabolic fate studies using labeled glucose have shown a consistent reduction in VTCA, and such decoupling may impact these measurements. Since β-hydroxybutyrate (BHB) metabolism through TCA cycle circumvents glycolysis and hence these challenges, the use of labeled BHB for the measurement of VTCA might be more appropriate than glucose. Studies have been performed to monitor the real-time metabolism of BHB in human and rodent brains using quantitative autoradiography8, 13C, and 1H-[13C]-MRS9-11. However, inherent limitations, like the use of radioactive tracer or low sensitivity of 13C and technical complexity have limited their clinical translation.Recently, the use of 2H-MRS, to monitor glutamate/glutamine (Glx) labeling from [6,6-2H2]glucose12-15 for the estimation of VTCA has shown promising outcomes. Rapid signal averaging due to short T1 of 2H improves signal-to-noise ratio (SNR) and its low natural abundance (0.01156%) results in nearly undetectable metabolite background signals, while 10.12 mM naturally abundant semi-heavy water (HDO) serves as an internal reference for quantification12,14. In the current study, we monitored the cerebral metabolism of [3,4,4,4]-2H4-BHB (d4-BHB) for the first time using 2H-MRS by observing label accumulation in Glx and HDO.
Methods
The protocol used for animal experiments were approved by the Institutional Animal Care and Use Committee of the University of Pennsylvania. Nine-month-old C57BL6/J mice (n=5; 3 male and 2 female) fasted for ~10 hours were anesthetized using isoflurane (1.6%). The tail vein was catheterized for infusion of the substrate. A home-built four-turn 2H surface coil tuned to 61.33 MHz with a 9.4T preclinical scanner (diameter 30 cm) interfaced with an Avance III HD console (Bruker, Germany) was used for 2H-MR spectroscopy.Using a pulse-acquire sequence, a baseline 2H MRS spectrum was acquired (bandwidth 1500 Hz, FA 50°, 256 points, 2500 averages, and TR 150 ms; acquisition time: 6.25 minutes) (Figure 1A). Following that, infusion of d4-BHB (1 mol/L in saline; pH 7.0; Cayman Chemical Company, USA) was started which continued for 87.5 minutes and a total of 14 spectra were acquired during this time. As a control experiment, one mouse was infused with unlabeled BHB and 2H MRS data was acquired in a similar fashion for 60 minutes. A line broadening of 5 Hz exponential filter (Mestrelab, Spain) was used, and spectra were denoised using singular value decomposition16. The fitted peak integrals of BHB and Glx were normalized to the baseline HDO (10.12 mM13) signal for the calculation of metabolite concentrations. A kinetic model was fitted to data14 (Figure 4A) for the estimation of CMRBHB and VTCA.
Results
A representative spectrum acquired 43.75 minutes post-infusion (figure 1B) shows clear resonances of HDO (4.8 ppm), d2-Glx, (2.3 ppm), and d4-BHB (1.3 ppm). A time-course spectra presented in figure 2 shows the evolution of these signals with time and after denoising, a significant improvement in SNR can be seen (Figure 2). The average concentrations of Glx, BHB (Figure 3A), and HDO from unlabeled and d4-BHB (Figure 3B) for each time point are plotted over the course of the infusion. As a result of BHB metabolism, an increase in the level of d2-Glx was observed with time until a quasi-steady state concentration of ~1.6±0.6 mM was attained following 30 minutes of infusion (Figure 3A). The level of HDO continued to increase linearly (R2 = 0.998) throughout the infusion from 10.1 to ~42.1±7.3 mM, while its level remained unchanged in the mouse infused with unlabeled BHB (Figure 3B). The parameters determined from the regressed fits of the kinetic model to the d2-Glx and d4-BHB concentrations are listed in Table 1 (Figure 4B). The units are converted to µmol/g/min assuming the brain tissue density of 1.1 g/ml. Estimated values of CMRBHB and VTCA from this fitting were found to be 0.054±0.004 and 0.12±0.01 µM/g/min, respectively.Discussions
This study demonstrates the feasibility of measuring brain energy metabolism using d4-BHB tracer and 2H-MRS. As an interesting outcome of this study, we observed a four-fold increase in the level of HDO as the ultimate metabolic fate of d4-BHB. We tried to address the generation of HDO from d4-BHB metabolism based on existing literature17 as demonstrated in figure 5. Apart from direct yield, oxidation of NADD and FADHD to NAD+ and FAD in ETC also generate HDO. Our observation of robust, linear behavior of the HDO levels suggests a predominant contribution from cerebral metabolism, but the possibility of any inflow from peripheral tissue cannot be excluded, hence it was excluded in the kinetic model. From figure 5, it is evident that a significant amount of label is lost as HDO, and its exclusion could underestimate metabolic fluxes. Thus, further studies are needed to address this issue.Conclusion
Given the noninvasive nature of the method and the availability of high-field MRI scanners with multinuclear capabilities, it can be readily translated to clinical research to probe cerebral ketone body/energy metabolism in healthy and different neurological disease conditions.Acknowledgements
Research reported in this work was supported by the National Institute of Biomedical Imaging and Bioengineering of the National Institutes of Health under Award Number P41EB029460 and by the National Institute of Aging of the National Institutes of Health under Award Number R01AG063869. 3D printed object printed courtesy of the University of Pennsylvania Libraries’ Biotech Commons.
References
1. Soni ND, Ramesh A, Roy D, et al. Brain energy metabolism in intracerebroventricularly administered streptozotocin mouse model of Alzheimer's disease: A (1)H-[(13)C]-NMR study. J Cereb Blood Flow Metab 2021; 41: 2344-2355.
2. Zilberter Y and Zilberter M. The vicious circle of hypometabolism in neurodegenerative diseases: Ways and mechanisms of metabolic correction. J Neurosci Res 2017; 95: 2217-2235.
3. Volkow ND, Wiers CE, Shokri-Kojori E, et al. Neurochemical and metabolic effects of acute and chronic alcohol in the human brain: Studies with positron emission tomography. Neuropharmacology 2017; 122: 175-188.
4. Area-Gomez E, Guardia-Laguarta C, Schon EA, et al. Mitochondria, OxPhos, and neurodegeneration: cells are not just running out of gas. J Clin Invest 2019; 129: 34-45.
5. Theurey P, Connolly NMC, Fortunati I, et al. Systems biology identifies preserved integrity but impaired metabolism of mitochondria due to a glycolytic defect in Alzheimer's disease neurons. Aging Cell 2019; 18: e12924.
6. Yao J, Irwin RW, Zhao L, et al. Mitochondrial bioenergetic deficit precedes Alzheimer's pathology in female mouse model of Alzheimer's disease. Proc Natl Acad Sci U S A 2009; 106: 14670-14675.
7. Peng Y, Gao P, Shi L, et al. Central and Peripheral Metabolic Defects Contribute to the Pathogenesis of Alzheimer's Disease: Targeting Mitochondria for Diagnosis and Prevention. Antioxid Redox Signal 2020; 32: 1188-1236.
8. Blomqvist G, Thorell JO, Ingvar M, et al. Use of R-beta-[1-11C]hydroxybutyrate in PET studies of regional cerebral uptake of ketone bodies in humans. Am J Physiol 1995; 269: E948-959.
9. Pan JW, de Graaf RA, Petersen KF, et al. [2,4-13 C2 ]-beta-Hydroxybutyrate metabolism in human brain. J Cereb Blood Flow Metab 2002; 22: 890-898.
10. Roy M, Beauvieux MC, Naulin J, et al. Rapid adaptation of rat brain and liver metabolism to a ketogenic diet: an integrated study using (1)H- and (13)C-NMR spectroscopy. J Cereb Blood Flow Metab 2015; 35: 1154-1162.
11. Jiang L, Mason GF, Rothman DL, et al. Cortical substrate oxidation during hyperketonemia in the fasted anesthetized rat in vivo. J Cereb Blood Flow Metab 2011; 31: 2313-2323.
12. Simoes RV, Henriques RN, Cardoso BM, et al. Glucose fluxes in glycolytic and oxidative pathways detected in vivo by deuterium magnetic resonance spectroscopy reflect proliferation in mouse glioblastoma. Neuroimage Clin 2022; 33: 102932.
13. De Feyter HM, Behar KL, Corbin ZA, et al. Deuterium metabolic imaging (DMI) for MRI-based 3D mapping of metabolism in vivo. Sci Adv 2018; 4: eaat7314.
14. Lu M, Zhu XH, Zhang Y, et al. Quantitative assessment of brain glucose metabolic rates using in vivo deuterium magnetic resonance spectroscopy. J Cereb Blood Flow Metab 2017; 37: 3518-3530.
15. Mateescu GD, Ye A, Flask CA, et al. In vivo assessment of oxygen consumption via Deuterium Magnetic Resonance. Adv Exp Med Biol 2011; 701: 193-199.
16. Brender JR, Kishimoto S, Merkle H, et al. Dynamic Imaging of Glucose and Lactate Metabolism by (13)C-MRS without Hyperpolarization. Sci Rep 2019; 9: 3410.
17. Voet D, Voet JG and Pratt CW. Fundamentals of biochemistry: life at the molecular level. John Wiley & Sons, 2016.
Figures
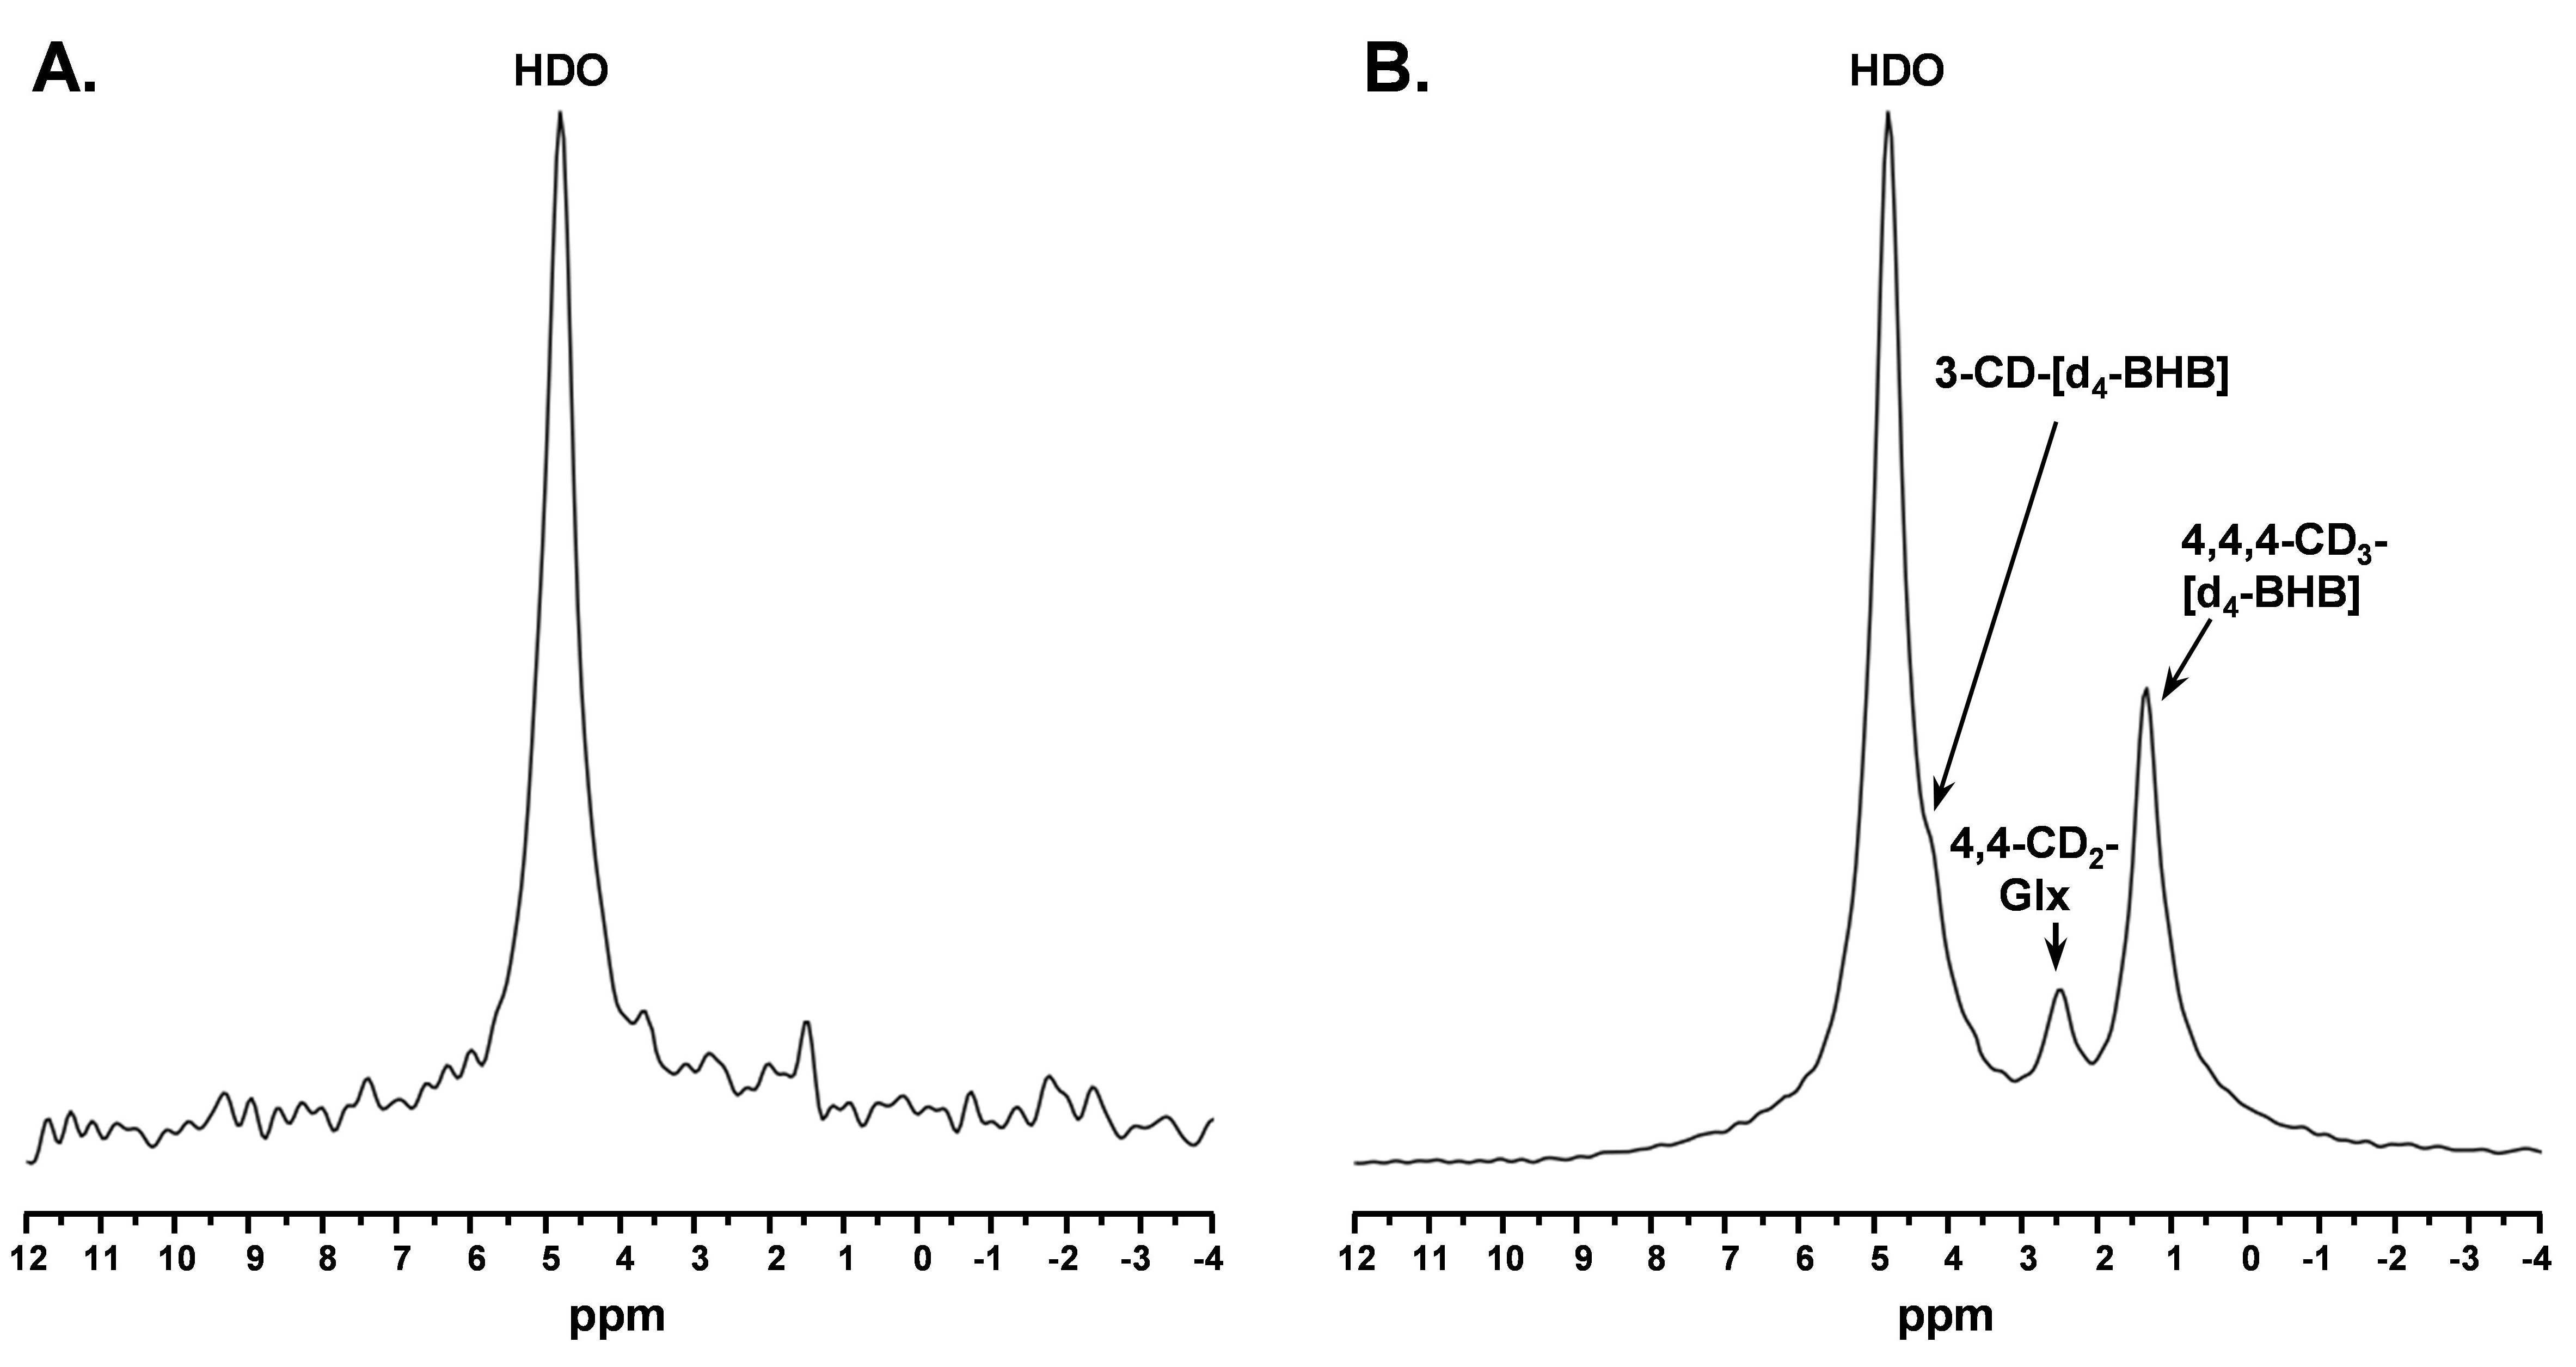
Figure 1. A. Baseline 2H MR spectra prior to infusion of d4-BHB and B. A representative spectrum was acquired 43.75 minutes post-infusion with three observable peaks corresponding to HDO (4.8ppm), 3-CD-BHB (4.2ppm), 4,4-CD2-Glx (2.4ppm), and 4,4,4-CD3-BHB (1.2ppm).
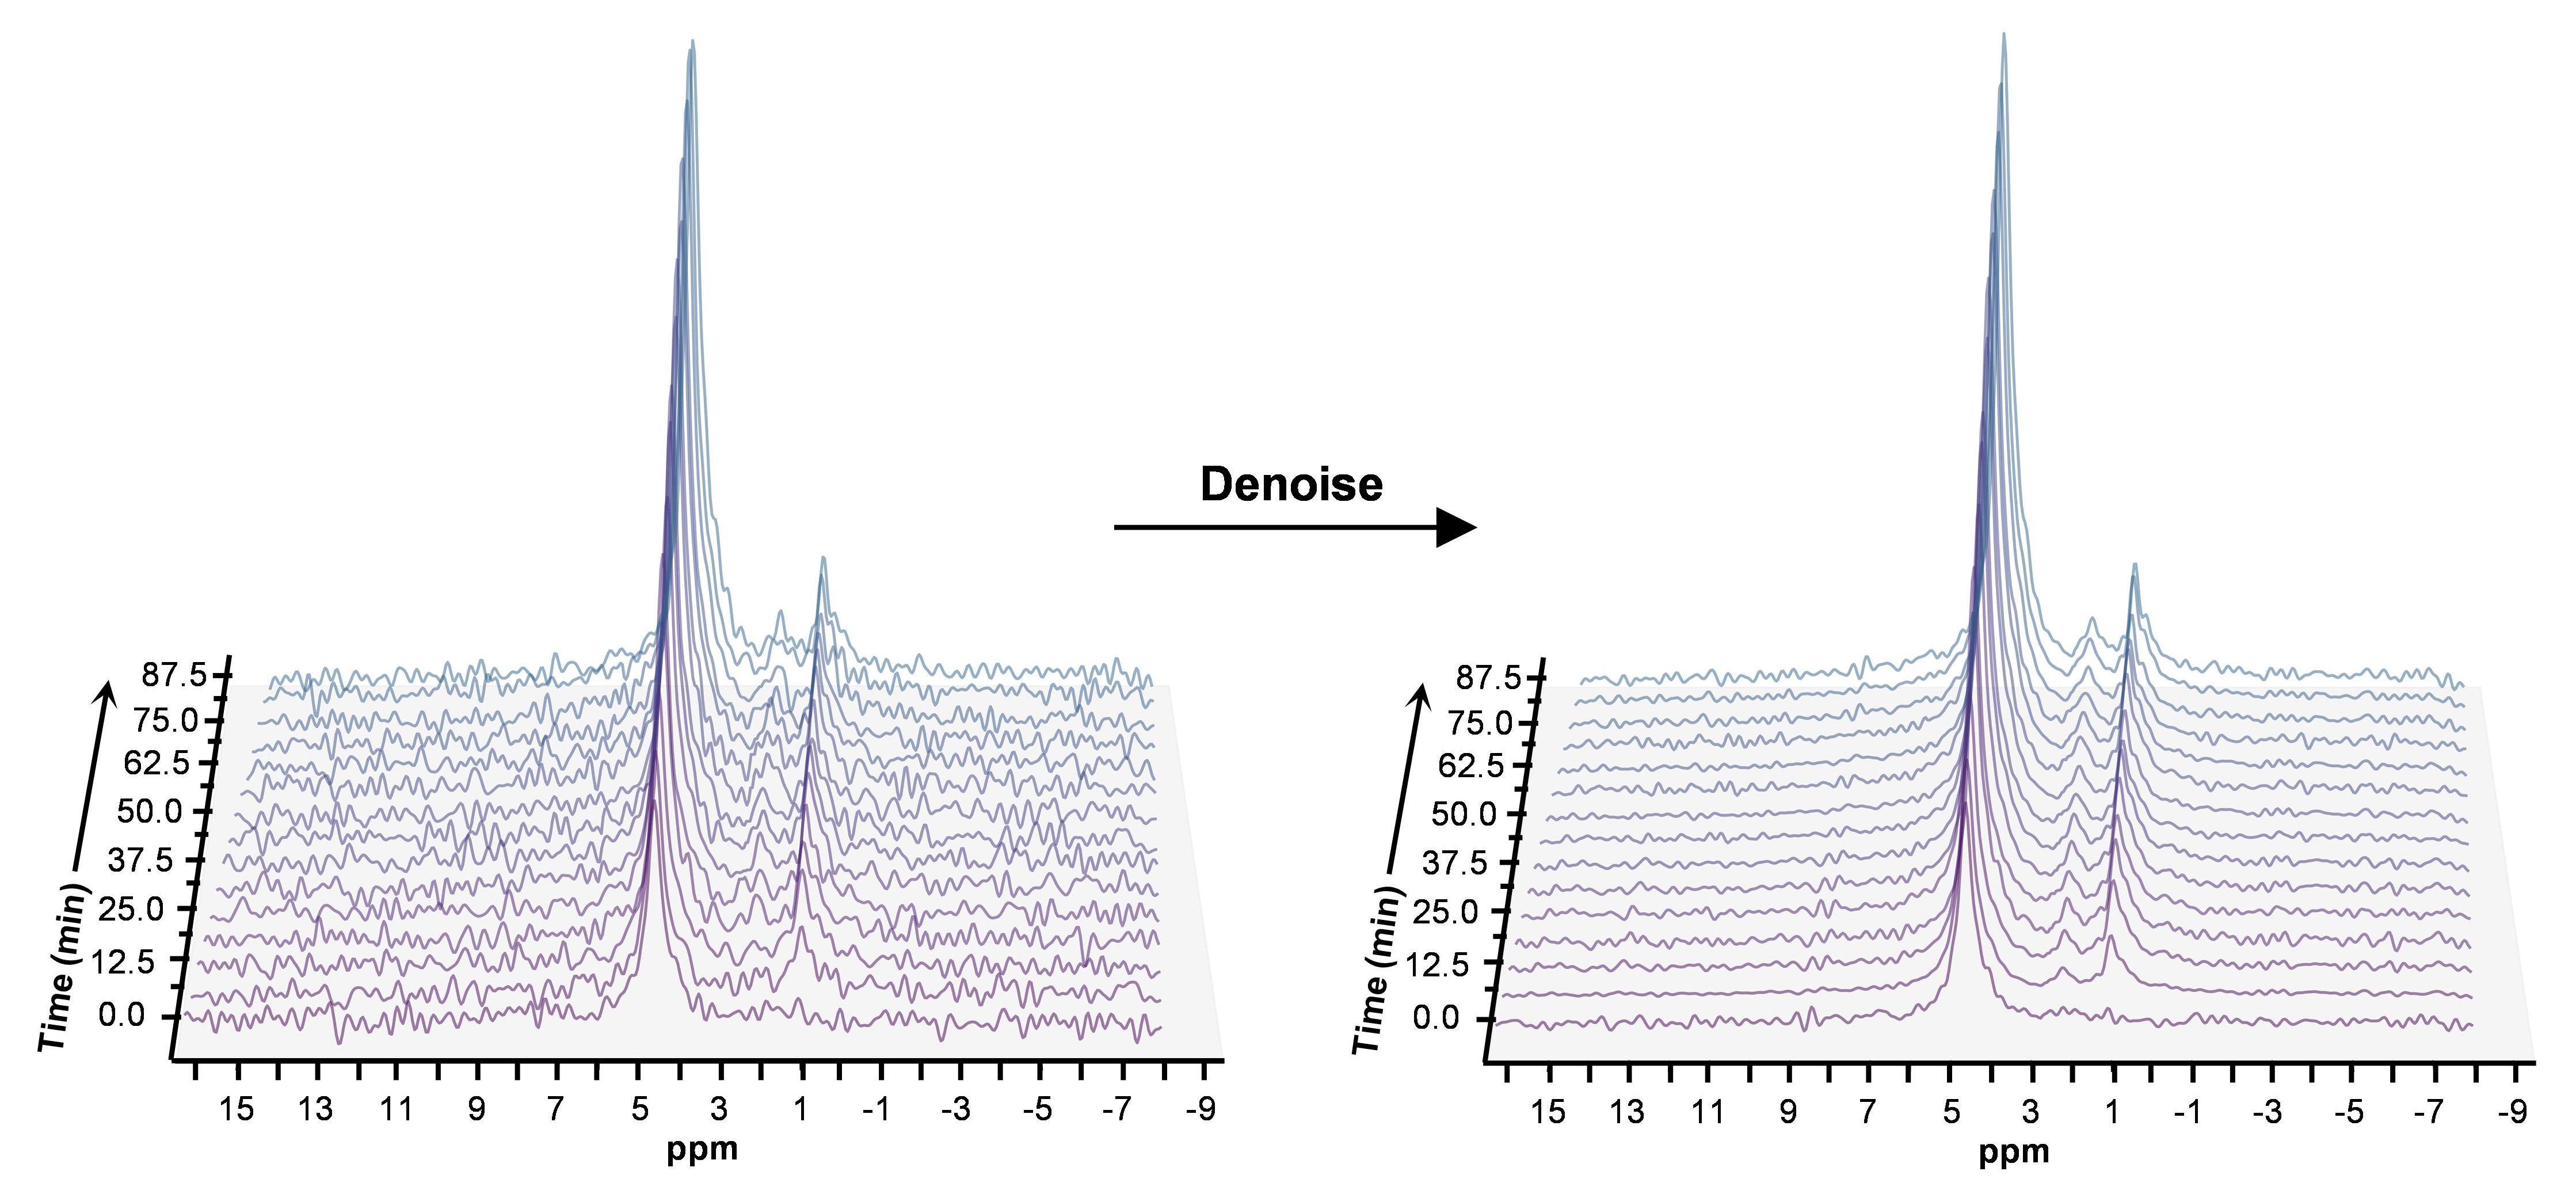
Figure 2. Time series plot of 2H spectra obtained with a temporal resolution of 6.25 minutes, showing the evolution of BHB, Glx, and HDO. Spectra are presented before and after denoising, with substantial improvement in SNR for all observable metabolite peaks.
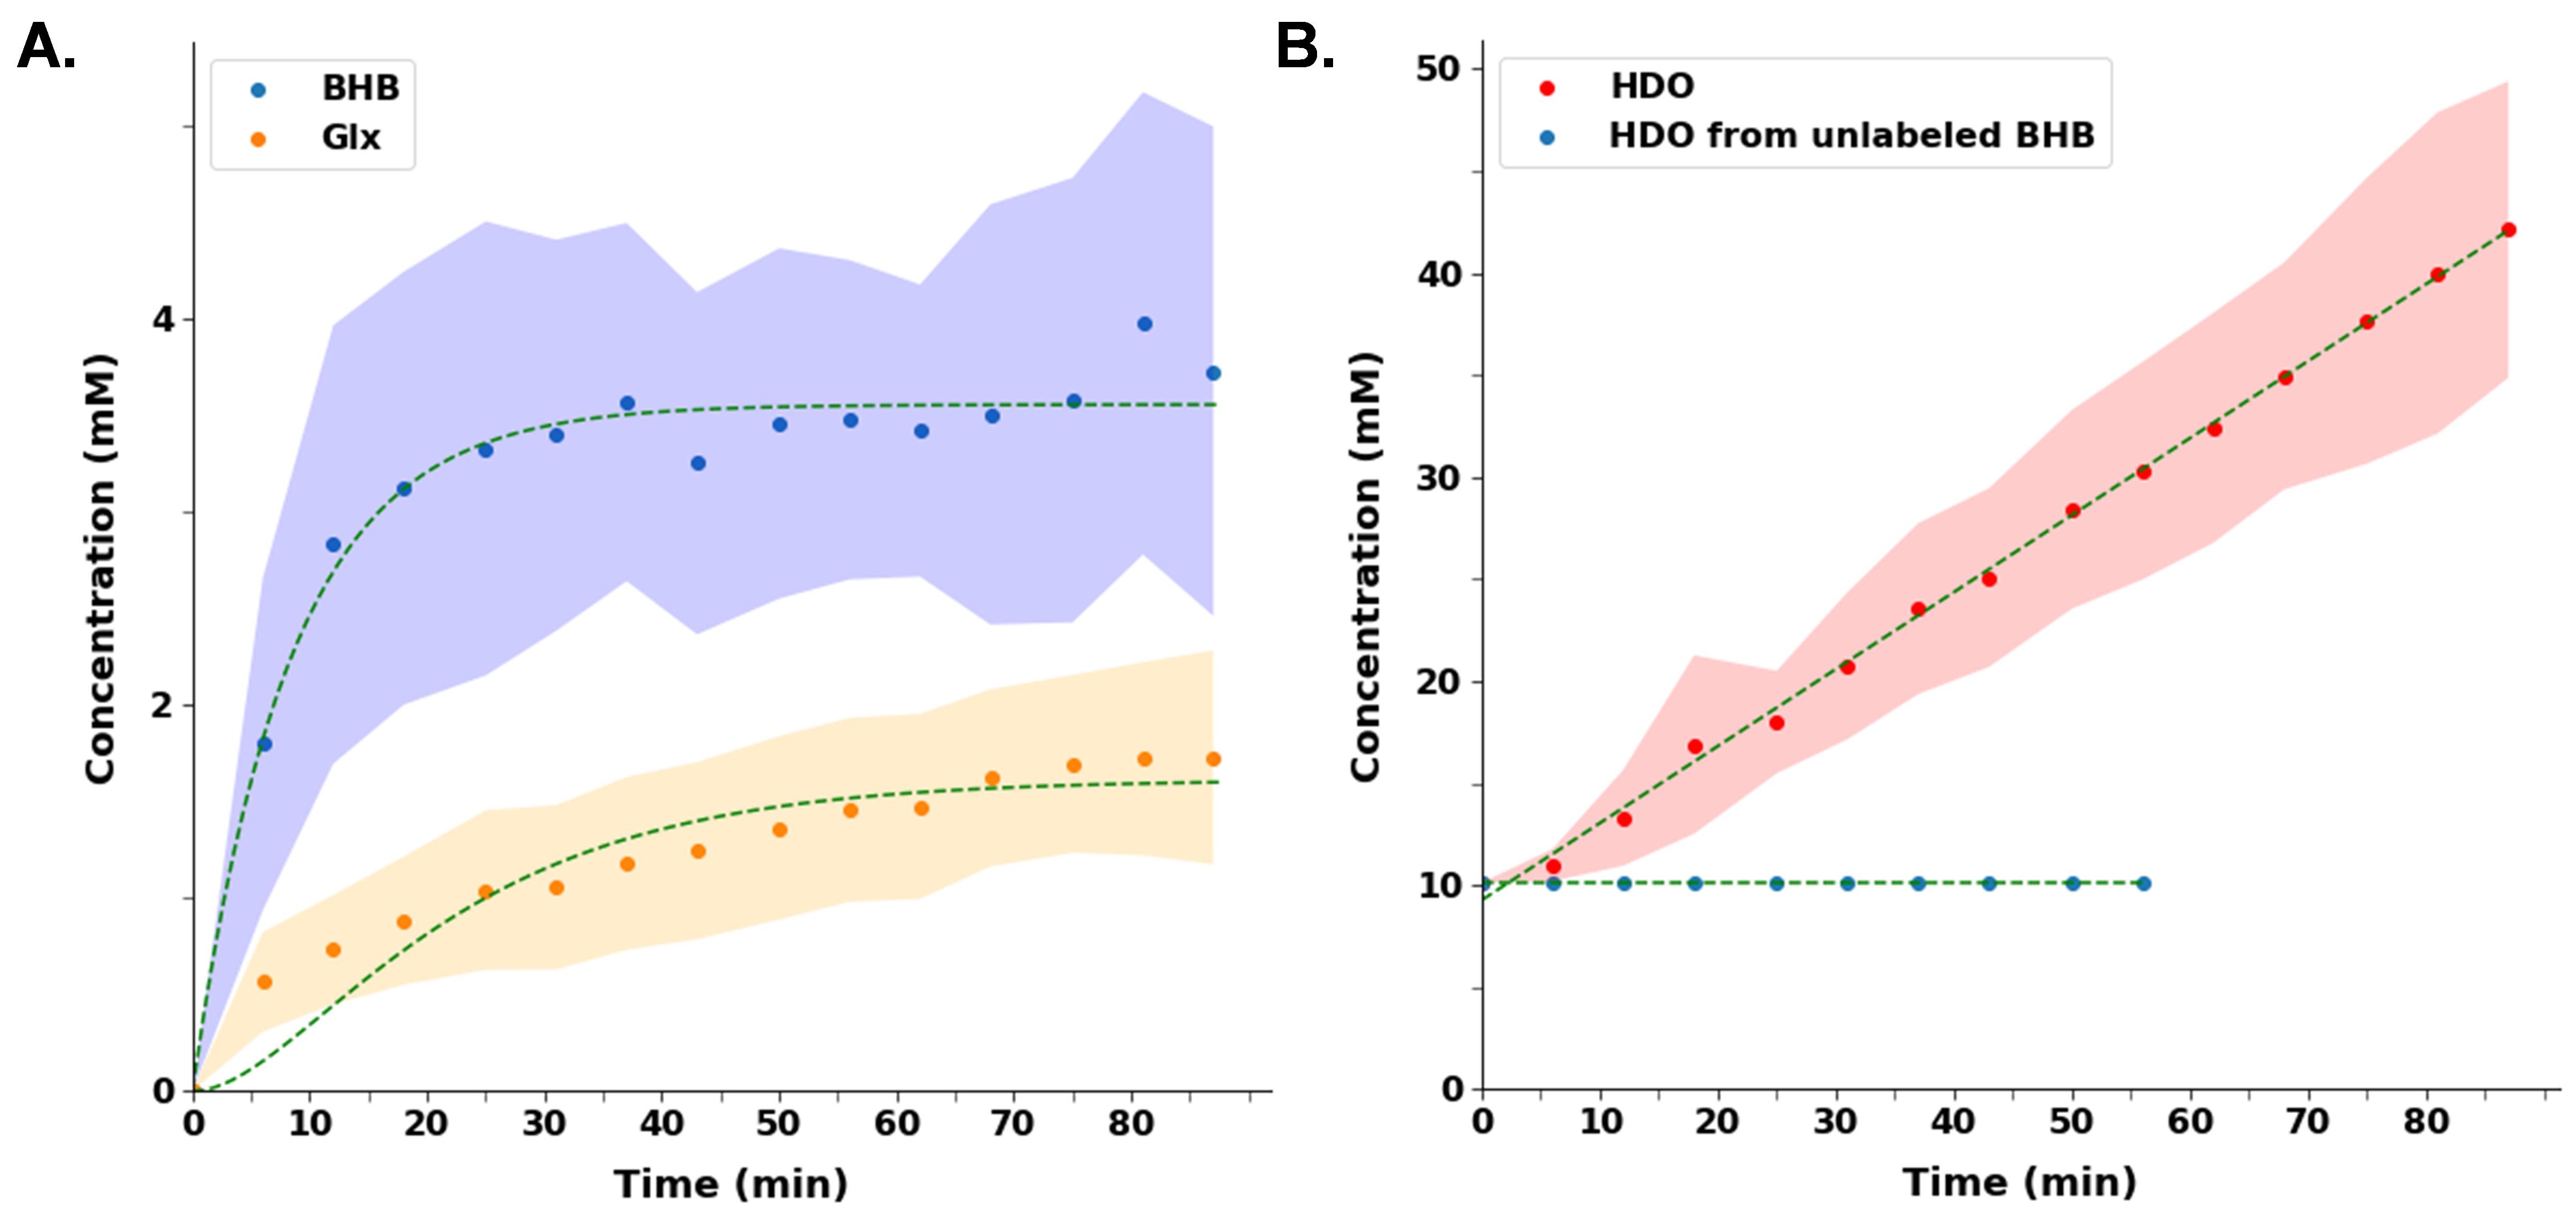
Figure 3 A. Turnover curves showing the concentration of d4-BHB (blue dots) and d2-Glx (orange dots) as a function of time. Glx concentration increases until a quasi-steady state is reached. B. HDO concentration increased linearly (~4-fold) in mice infused with d4-BHB (red dots) while in mouse infused with unlabeled BHB (blue dots) remains unchanged. In both plots, dots and shaded regions represent mean and standard deviations respectively. Smooth curves show interpolated between time points.
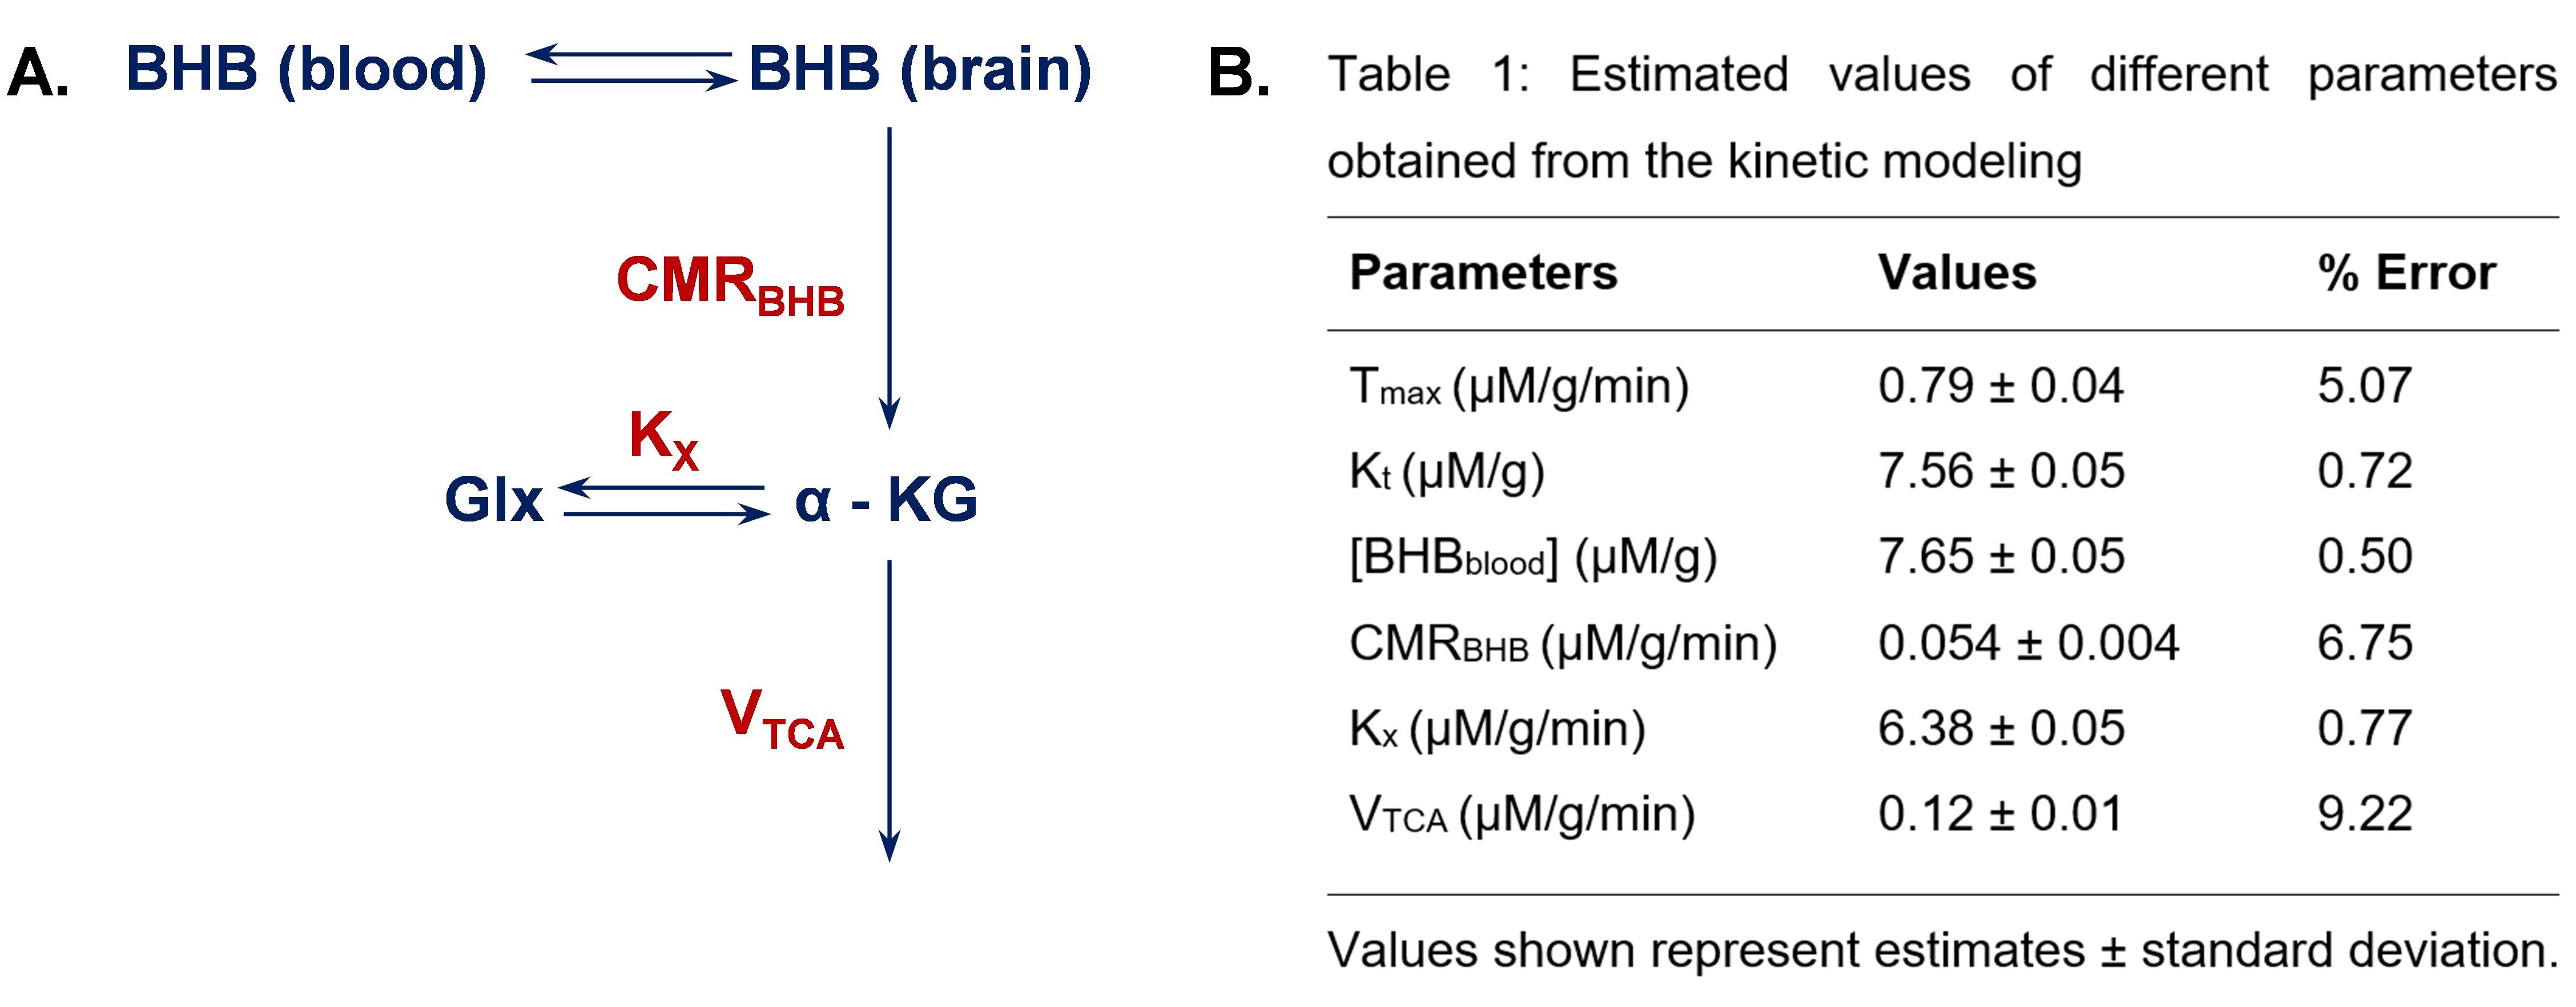
Figure 4 A. A simplified kinetic model of BHB metabolism. Where, Tmax: maximum transport rate (mM/min); Kt: half saturation constant (mM), [BHBblood]: concentration of BHB in the blood (mM); [BHBbrain]: concentration of BHB in the brain (mM); Kx: the exchange rate between Glx and -KG (mM/min); KTCA: rate of TCA cycle (mM/min); [Glx] and [ -KG]: concentration of Glx and α-ketoglutarate in the brain (mM). B. Table showing all the estimated values from the fitting of data into the kinetic model
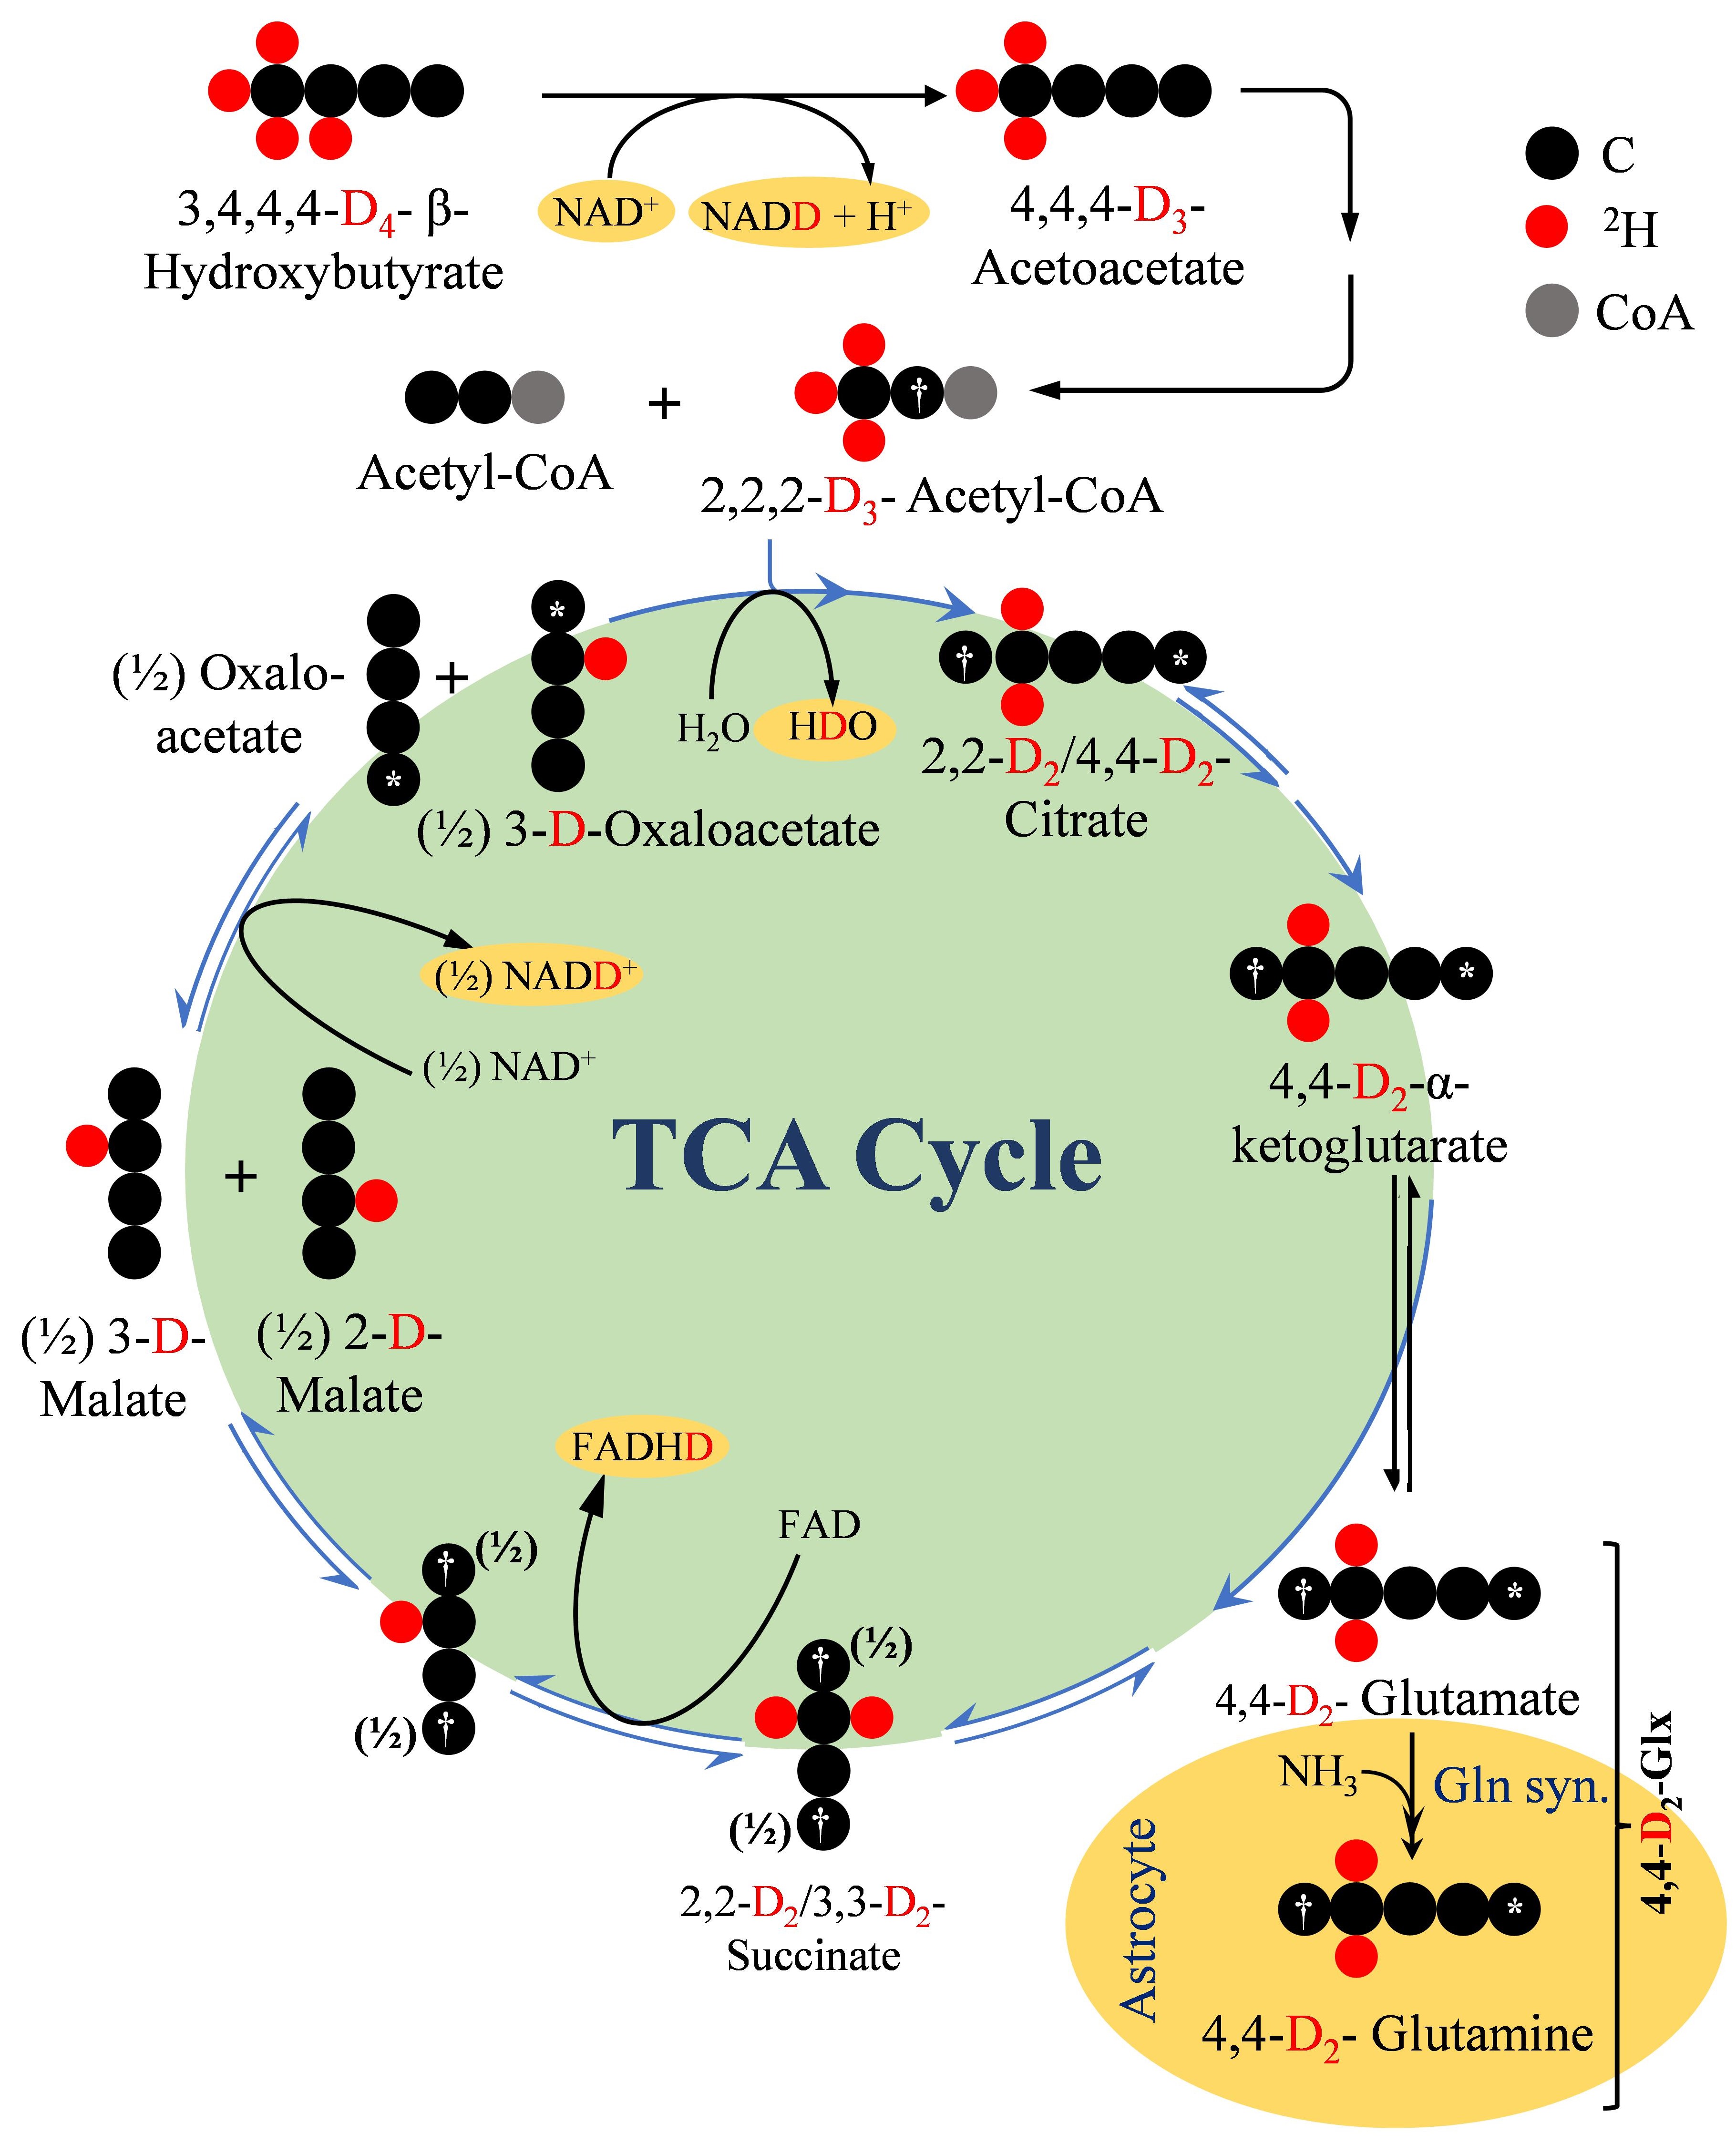
Figure 5. A schematic depiction of the metabolism of 2H4-BHB (D4-BHB) and incorporation of 2H label into downstream metabolites. In brief, metabolism of D4-BHB results into the formation of [2,2-D2]-acetyl-CoA which enters the TCA cycle for further metabolism and forms [4,4-D2]-α-ketoglutarate (D2- α-KG) which is converted into [4,4-D2]-glutamate. Neuronal [4,4-D2]-glutamate is transported to astroglia to be converted into [4,4-D2]-glutamine. D2- α-KG is further metabolized in TCA cycle to produce NADD and FADHD which releases HDO upon oxidation in electron transport chain.